Market Insights: Friday, April 11th, 2025
Market Overview
Stocks surged Friday, capping off one of the wildest weeks Wall Street has seen in years, fueled by a rapid-fire back-and-forth on tariffs and trade tensions. The S&P 500 jumped 1.8%, the Nasdaq gained 2.1%, and the Dow added 1.5%, closing up nearly 600 points. These gains helped the S&P and Dow lock in their best weeks since 2023, while the Nasdaq posted a 7% weekly gain—its strongest since 2022. Despite the chaotic backdrop, markets found footing as investors absorbed the latest from both Washington and Beijing. China announced a significant hike in tariffs to 125%, up from the 84% previously planned, retaliating against President Trump’s ballooning “reciprocal” tariffs. Still, Beijing signaled it would disregard any further U.S. hikes, cooling fears slightly and fueling a late-week rebound. Meanwhile, economic uncertainty loomed large, with consumer sentiment plunging to its lowest level since 2022 and inflation expectations spiking. Gold surged to new highs, signaling heightened fear, and the 10-year Treasury yield topped 4.5% for the first time since February. First quarter earnings also kicked off, with JPMorgan CEO Jamie Dimon warning of "extreme turbulence" in the U.S. economy. Despite the bounce, the market remains fragile, and the outlook clouded as tariffs dominate the macro narrative.
SPY Performance
SPY bounced back Friday, gaining 1.81% to close at $534.09 after opening at $523.91. It traded as high as $536.43 and dipped to a low of $520.10 before buyers stepped in. Volume came in above average at 84.79 million shares, underscoring investor interest in a market that remains highly reactive to macro headlines. The close just shy of $535 positions SPY at a critical resistance area, where bulls will need to show strength to reclaim momentum. For now, it appears the $520 level is acting as near-term support, helping keep the broader downtrend in check.
Major Indices Performance
The Nasdaq led major indices with a 2.06% surge, buoyed by tech leadership and a resilient rally across growth names. The S&P 500 followed with a 1.8% gain, while the Dow rose 1.68%, logging its best week in nearly two years. The Russell 2000 trailed slightly but still posted a solid 1.49% advance. Sector-wise, tech, financials, and industrials powered higher, reflecting optimism around earnings and a slight easing of tariff panic. Defensive plays took a back seat as risk appetite returned late in the week, aided by hopes that the worst of the tariff volatility may be priced in—at least for now.
Notable Stock Movements
Apple led the Magnificent Seven on Friday with a gain north of 4%, helping drive broader market strength. Nvidia also continued its strong run, while most other mega-cap tech names ended the week in the green. However, not all tech giants joined the rally—Tesla, Netflix, and Meta slipped slightly, bucking the broader trend. Despite their minor losses, overall sentiment around the group turned positive again, hinting that investors still see long-term value in these names despite short-term headline risk. The action in tech echoed broader themes of risk-on behavior following two days of extreme price swings.
Commodity and Cryptocurrency Updates
Crude oil rebounded 2.38% to $61.50, continuing its volatile ride but staying within our expected move toward $60—a level we've been targeting for months. Our model continues to forecast a potential move down to $50, where we intend to go long. Gold soared another 2.45% to close at $3,255, breaking through the $3,200 barrier and solidifying its role as the preferred safe haven in a stormy market. Bitcoin climbed 4.59% to settle just above $83,300. We remain buyers in the $77,000 to $83,000 range, with profits to be taken above $85,000. Below $77,000, the trade carries heightened downside risk.
Treasury Yield Information
The 10-year Treasury yield surged 2.39% to close at 4.497%, pushing above the critical 4.5% line. This marks the highest level since February and could pressure equities if yields continue to climb. Yields above 4.8% often lead to sharp equity selloffs, while a breach above 5% has historically triggered major market corrections. With rates now inching toward danger territory, investors must stay vigilant. Bond market volatility continues to mirror the broader macro stress, and any further move higher in yields could undercut bullish momentum in stocks.
Previous Day’s Forecast Analysis
Thursday’s analysis called for a projected SPY range of $510 to $540 with a bearish tilt. The model advised shorting failed rallies into resistance near $530 and $535 and expected downside acceleration if $520 gave way. Longs were only favored on a reclaim of $535, targeting $540 and $545. The strategy emphasized small position sizing, wider stops, and reacting to price behavior around key levels. With the VIX at 40, elevated volatility was a central concern, reinforcing the need for caution. The model emphasized responsiveness to breaking news on tariffs and inflation, expecting continued sharp directional moves.
Market Performance vs. Forecast
SPY opened Friday at $523.91, initially traded down to $520.10, and then reversed hard to close at $534.09. The session largely validated Thursday’s forecast, especially the projected range and bearish-to-neutral bias. The model's short setup near $530 worked early in the day before buyers stepped in and defended $520—a key support level highlighted in the analysis. Once that level held, the door opened for a strong bounce that ultimately brought SPY close to major resistance at $535. The market never broke $540, but the rebound off $520 reinforced the importance of watching key levels. Friday’s performance aligned closely with the model’s view that the environment was two-way and reactive, with both short and long opportunities available.
Premarket Analysis Summary
In Friday’s premarket analysis posted at 7:27 AM, SPY was trading at $526.08 with the model favoring a bearish bias below $530. Key upside targets were $530, $534, and $540, while support was seen at $520 and $517. The tone called for selling rallies unless SPY broke above $530 with conviction. The model expected the day to feature a fragile, choppy middle zone, with a potential drift downward if $530 held as resistance. Any push through that level was expected to be limited in nature, particularly into the afternoon.
Validation of the Analysis
Friday’s price action played out almost exactly as the premarket notes suggested. SPY initially struggled near $530, dipping to $520 before reversing sharply and pushing toward $534—a target explicitly called out in the morning plan. The bias level of $520 served as a critical pivot, with the market finding support there and rallying back toward resistance. While SPY did break $530, the move remained fragile and capped below $540, in line with the analysis. Traders who sold early rallies or bought the $520 bounce had clear, profitable setups. The premarket insights again proved accurate and actionable, providing a solid roadmap for navigating a complex session.
Looking Ahead
Monday brings no new economic data, but three FOMC members are scheduled to speak throughout the day. With markets still digesting last week’s extreme moves and the latest round of tariff news, any Fed commentary could influence sentiment—particularly if it touches on inflation or rate policy. While macro risk remains high, earnings season is just getting started and could take the driver’s seat by midweek. We’ll be watching for any signals that companies are adjusting guidance due to tariffs, inflation, or slowing growth. Traders should expect volatility to remain elevated and be prepared for potential swings driven by headline risk.
Market Sentiment and Key Levels
SPY closed Friday at $534.09, just under the major $535 resistance level. Sentiment has tilted slightly bullish following the late-week rebound, but traders should remain cautious as the broader bearish trend channel from December remains intact. Key resistance levels are now stacked at $535, $540, $543, and $550. Support lies at $527, $525, and $520. If SPY can hold above $535 and break through $540, we could see a push toward $550. However, failure to stay above $527 could invite another test of $520—and below that, $500 comes back into play. The bulls have regained some ground, but control won’t fully shift until $585 is decisively cleared.
Expected Price Action
Our AI model forecasts a trading range of $515 to $550 for Monday, signaling a continued environment of wide, trending moves. The market leans bullish near-term, but with resistance near $535 and $540, any upside push must be supported by strong buying volume. A sustained move above $540 opens the door toward $550. If SPY fails at $535 and breaks below $527, we expect a quick drop to $520 and potentially lower. This forecast is actionable intelligence—traders should watch for failed breakouts or breakdowns near these levels. Macro drivers, especially Fed commentary and earnings guidance, could act as catalysts for large swings.
Trading Strategy
Traders should look to short failed rallies at resistance near $535 and $540, targeting $530, $527, and $520 if price stalls. Long trades are viable above $535 with targets at $540 and $543, and below $520 on a failed breakdown. Tighten stops near resistance. If SPY reclaims $550, expect upside momentum to build, but remain cautious until $585 is cleared. With the VIX still high at 37.56, this remains a volatile and potentially treacherous environment. Reduce position sizes, widen stop losses near key zones, and avoid chasing price action. Use a measured approach with clear entry and exit levels based on model signals.
Model’s Projected Range
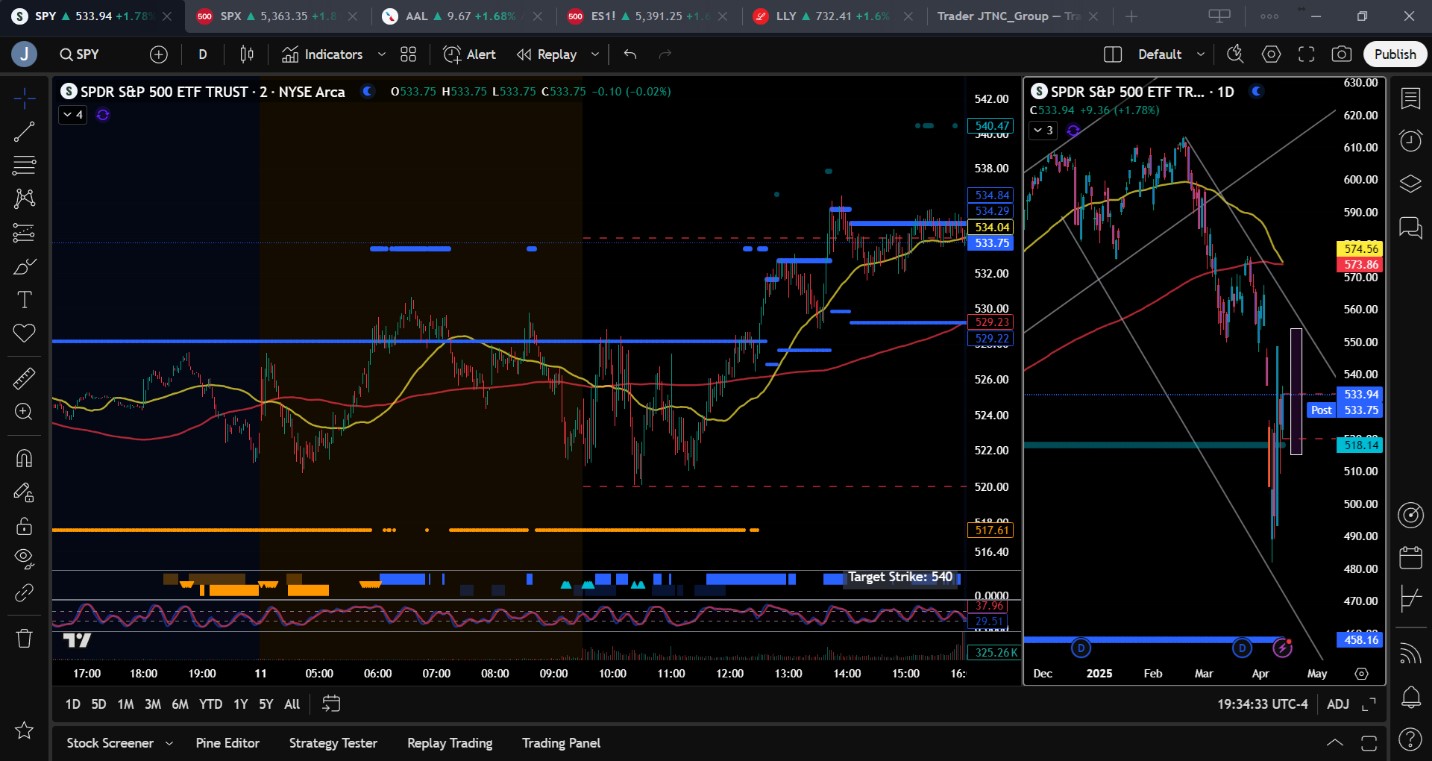
The model’s projected range for Monday is $515.25 to $554.25, with the Call side dominating. This suggests consolidation within a narrowing—yet still relatively wide range, punctuated by bouts of trending price action. SPY closed at $533.94, just shy of major resistance at $535. Despite today’s significant 1.78% gain, the move felt subdued compared to last week’s volatility. As mentioned yesterday, during the early stages of the 2000 crash, sharp selloffs were often followed by short-term rallies exceeding 10%. Yet, over the following 18 months, the market trended steadily downward. Historically, a retest of this week’s lows within 4 to 16 weeks is common, based on 100 years of market data. While a short-term bottom may be forming, resistance remains likely between $575 and $585, after which a resumption of the selloff back toward recent lows—or beyond—becomes probable. We strongly advise considering protective positions or reducing long exposure if the opportunity arises near these levels. With earnings season underway, companies may use tariffs as a scapegoat to lower or sidestep guidance, further fueling market volatility already inflamed by current administration policies. Key resistance levels for Monday are at $535, $540, $543, and $550. Support is seen at $527, $525, and $520. SPY tested major resistance at $535 today; the next challenge is whether bulls can push through. We believe that repeated tests of this level increase the likelihood of a breakout toward $540. A move above $535 would tip near-term momentum further in favor of the bulls. However, true control won’t shift unless $585 is decisively breached. Conversely, a break below $520 opens the door for a test of $500—or lower—given the limited support beneath that level. Resistance remains heavy from $535 through $550, likely capping upside in the near term. Tariffs, bonds, and inflation remain dominant market themes and are expected to continue driving price action over the next 90 days or until clearer guidance emerges from the White House. The VIX closed at 37.56—levels above 35 continue to pose a challenge for the bulls. The broader bearish trend channel, which began with the December highs, remains intact. Price is currently mid-channel and while the structure allows movement in both directions, we expect price action to stay largely contained within the channel, with notable resistance around $565 and support near $475. Momentum has become less directional, though bulls currently hold a slight edge heading into Monday. Still, with the weekend looming and Trade War headlines potentially looming, the market remains vulnerable to $10 swings in either direction. The next major upside test is $550; reclaiming $585 would mark a true shift in control to the bulls. Until then, stay nimble and prepared for anything.
Market State Indicator (MSI) Forecast
Current Market State Overview:
The MSI is currently in a Bullish Trending Market State, with price closing at MSI resistance. The range is wide and there are no extended targets above. This implies a bull trend, given extended targets printed off and on for much of the afternoon session. Overnight, price traded in a wide range with the MSI briefly rescaling to a bullish state. By the open, price was back in a wide MSI Ranging State which contained price until noon. After noon, the MSI began a series of rescalings higher to a bullish state and printed the occasional extended target. While not overly convincing, a bull trend emerged after 1 pm which saw the MSI rescale both higher and lower. We would have been more convinced of the strength of the bull trend had the MSI not rescaled lower at 2 pm. By rescaling lower and stopping printing extended targets right at major resistance of $535, its likely price will struggle to get past MSI resistance. Its possible price retraces a bit to MSI support at $530 before building enough energy to push beyond the critical $535 level. At present, MSI support is at $529.22, with resistance at $534.88.
Key Levels and Market Movements:
On Thursday, we noted: “If bulls can defend $520 and consolidate near $535, a break above $535 could lead to a slow grind toward $540 and beyond.” We also stated: “Control remains split between bulls and bears.” And finally: “We recommend trading what you see using the tools at your disposal.” Once again, we came into the day with a clear plan—knowing what to look for, where to look for it, and when to act. At the open, SPY was trading within a wide MSI Ranging State, with no clear directional bias. We generally avoid trading in this environment. While there were several opportunities to short MSI resistance at $528 down to our model’s support at $520, we opted not to take those trades. After a highly profitable week, we prioritized capital preservation over chasing additional setups on a Friday. We waited patiently through the morning, holding off until the market and the MSI gave us something definitive. Around noon, the MSI rescaled into a bullish state and printed a long extended target above. We considered a long with price at $531.50, but with price testing MSI resistance, we chose to pass again. SPY then pulled back slightly, and we briefly considered a short—but we wanted to see how price behaved at $535 first. At 1:46 PM, SPY tagged $535, and the extended targets stopped printing. That gave us our signal. We entered a short on a double top/failed breakout, looking for a first target at MSI support at $530. The setup didn’t play out as expected. While the trade briefly showed a $3 profit, we stuck to our plan and held for our MSI first target. It never hit, and we closed the position at the bell with a very small profit. We were fortunate not to end the day with a loss. It happens—not often, but it does. Still, one scalp short in a highly profitable week is a win in our book. The key was having a solid plan, following it with discipline, and letting the MSI and model levels guide every decision. The MSI shows who’s in control, when that control shifts, and where the key actionable levels lie—empowering precise entries and exits. When combined with our model levels and daily strategy, it keeps us aligned with dominant market forces. MSI continues to deliver a high level of precision—helping traders avoid traps, stay in sync with momentum, and take profits with confidence. We strongly recommend integrating the MSI into your trading toolkit. Paired with a structured plan, it becomes a powerful engine for long-term performance.
Trading Strategy Based on MSI:
Monday brings no major economic data, but several FOMC members are scheduled to speak. As with today, the tariff situation remains the dominant market mover, with price action continuing to react sharply to headlines out of the White House. Today, the bulls successfully defended the critical $520 level and pushed SPY up to major resistance at $535. PPI data came in favorable, while UoM Consumer Sentiment disappointed—understandably so, given the mounting pressures on everyday consumers in recent weeks. With the MSI currently in a wide bullish state, the market has room to attempt further upside. However, $535 remains both MSI resistance and a major structural level that must be reclaimed before SPY can move meaningfully higher. A modest pullback overnight seems likely, allowing for consolidation before any attempt to break above $535. For the bulls, holding $530 will be key to sustaining today’s momentum. That said, conviction remains elusive—it’s still difficult to maintain a strong directional lean. As always, we recommend trading what you see, using the tools at your disposal. Here’s what to watch for: If bulls defend $530 and consolidate near $535, a breakout could trigger a slow grind toward $540 and beyond. If $530 fails, expect a move back to test $520—and if that level breaks, SPY could revisit the week’s lows near $500. Control remains split between bulls and bears, with a slight edge to the bulls heading into Monday. However, external forces remain the primary catalyst, making it dangerous to rely solely on model levels. The key is to stay adaptive—let the market reveal its hand. Fortunately, the MSI updates in real time, delivering actionable intraday structure and momentum insights. When used well, it prevents you from trading off outdated assumptions or narratives. Monday Strategy: Two-way trading is advisable—ideally targeting failed breakouts and failed breakdowns. Avoid fighting extended targets or trading against a wide MSI state. Respect the tools: The Premarket Report combines fresh data and AI-driven insights to shape a strategic plan. The MSI reveals real-time structure, momentum shifts, and key inflection points. Our model levels define high-probability targets and entry zones. Stay nimble. Adapt. Trade what you see—not what you think. As volatility cools, expect SPY’s pace to slow and the MSI’s range to normalize. Keep a close eye on the MSI—it offers critical, real-time visibility into who’s in control and where key momentum zones lie. Respect extended targets—they signal strong conviction and herd-driven moves. Used together, the MSI and model levels help you stay aligned with market forces and avoid costly missteps. If you're not already using these tools, now is the time. Connect with your rep—these are game-changers in environments like this.
Dealer Positioning Analysis
Summary of Current Dealer Positioning:
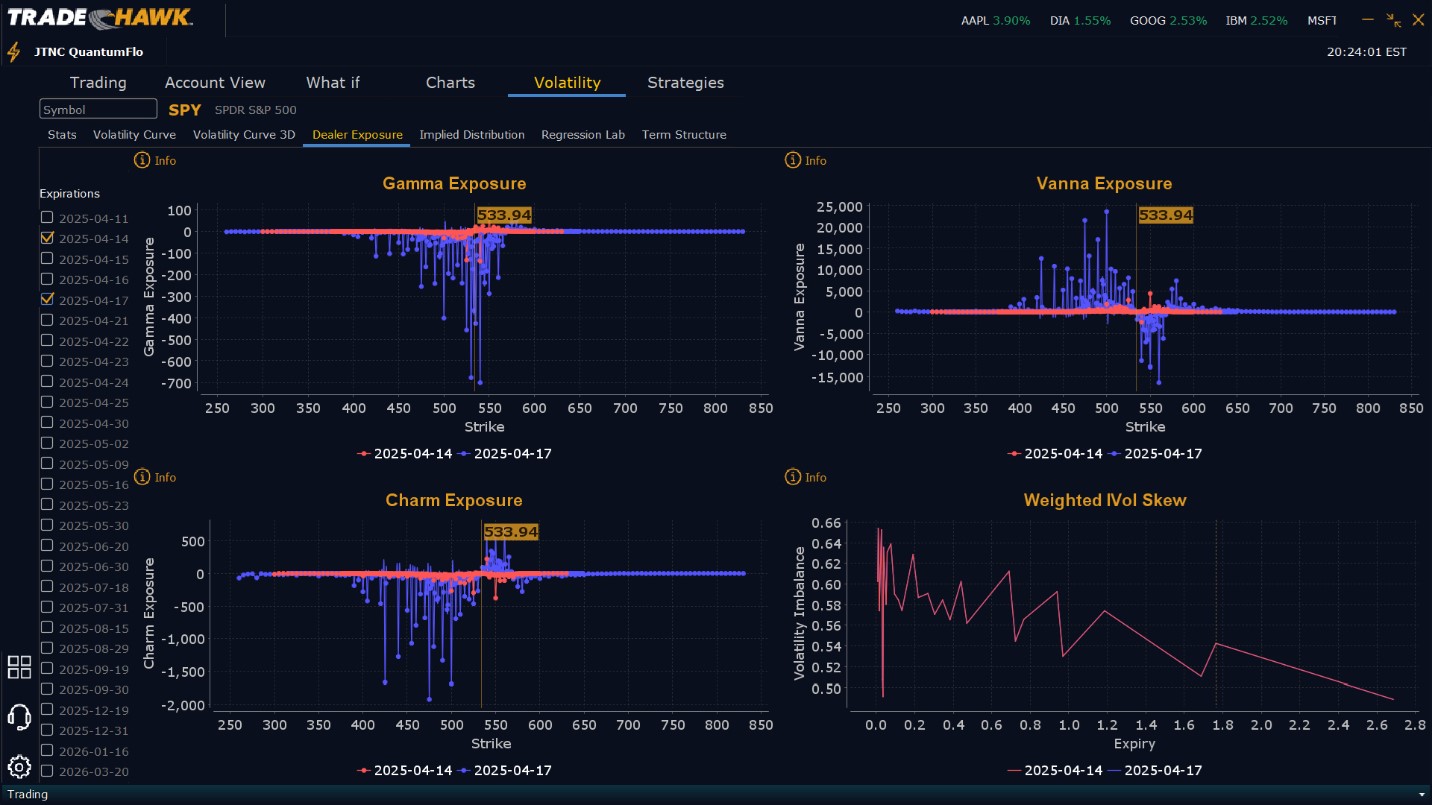
Dealers are selling $541 to $570 and higher strike Calls while also buying $534 to $540 Calls indicating the Dealers desire to participate in any rally on Monday to as high as $555. To the downside Dealers are buying $533 to $480 and lower strike Puts in a 1:1 ratio to the Calls they are buying/selling, implying a neutral to slightly bullish posture for Monday. Dealer positioning has changed from neutral/slightly bearish to neutral/slightly bullish.
Looking Ahead to Next Thursday (Friday is a holiday):
Dealers are selling $565 to $585 and higher strike Calls while also buying $534 to $564 Calls in large size indicating the Dealers strong desire to participate in any rally next week. Dealers are heavily long Calls indicating a firm belief the market will move higher next week. To the downside, Dealers are buying $532 to $425 and lower strike Puts in a 2:1 ratio to the Calls they’re buying/selling. This reflects a slightly bearish outlook for next week. Dealer positioning has changed from more bullish to slightly bearish. Dealers hold large amounts of downside protection, yet they appear positioned for a major rally that may develop next week. While the ratio is a bit bearish, the way Dealers are positioned, not selling any Calls below $565 leads us to believe, the Dealers anticipate higher prices next week. We advise reviewing Dealer positioning daily for directional clues. These positions evolve quickly, and tracking them is essential for staying ahead of shifting market sentiment.
Recommendation for Traders
Traders should remain cautious heading into next week. SPY is knocking on major resistance at $535 and if it breaks through, there’s room for a quick run to $540 and even $550. However, a rejection here could send price back toward $527 or $520. Short trades near $535 are valid if price stalls, while long trades above $535 have clear targets. With the VIX at 37.56, volatility is still a serious factor. Traders should use reduced position sizes, stay nimble, and avoid chasing price. Manage stop-losses carefully and look for high-probability setups near major support and resistance. Be sure to review our premarket analysis before 9:00 AM ET for the latest signals and strategic insights.
Good luck and good trading!
