Market Insights: Friday, April 10th, 2026
Market Overview
US stocks showed mixed action Friday as investors digested March inflation data and awaited results from weekend US-Iran peace talks. The tech-heavy Nasdaq managed a modest 0.2% gain near midday while the Dow pulled back 0.5% and the S&P 500 slipped 0.1%. The indecisive trading followed Thursday's broad gains that pushed the Dow back into positive territory for the year, with all three major indices posting their second consecutive weekly advance despite Friday's lackluster performance.
March inflation data revealed the war's economic impact as consumer prices surged 3.3% annually, with the monthly gain of 0.9% marking the largest increase since 2022. The rapid acceleration from February's 2.6% level came as the US-Iran conflict sent energy costs soaring, highlighting how geopolitical tensions have introduced new cost pressures into the financial system. President Trump ramped up pressure on Iran to lift its blockade of the Strait of Hormuz ahead of weekend negotiations, though traffic through the critical energy chokepoint remains severely restricted.
Beneath the surface calm, software stocks continued their relentless decline as investors returned to pre-war trading patterns that have punished tech names across the board. The S&P 500 aimed to secure its eighth consecutive daily gain, a streak that historically suggests bulls tend to maintain control even if the market pauses. With momentum indicators showing the current run arriving at more reasonable levels compared to previous streaks, the technical backdrop appears healthier than similar advances that marked major market tops.
SPY Performance
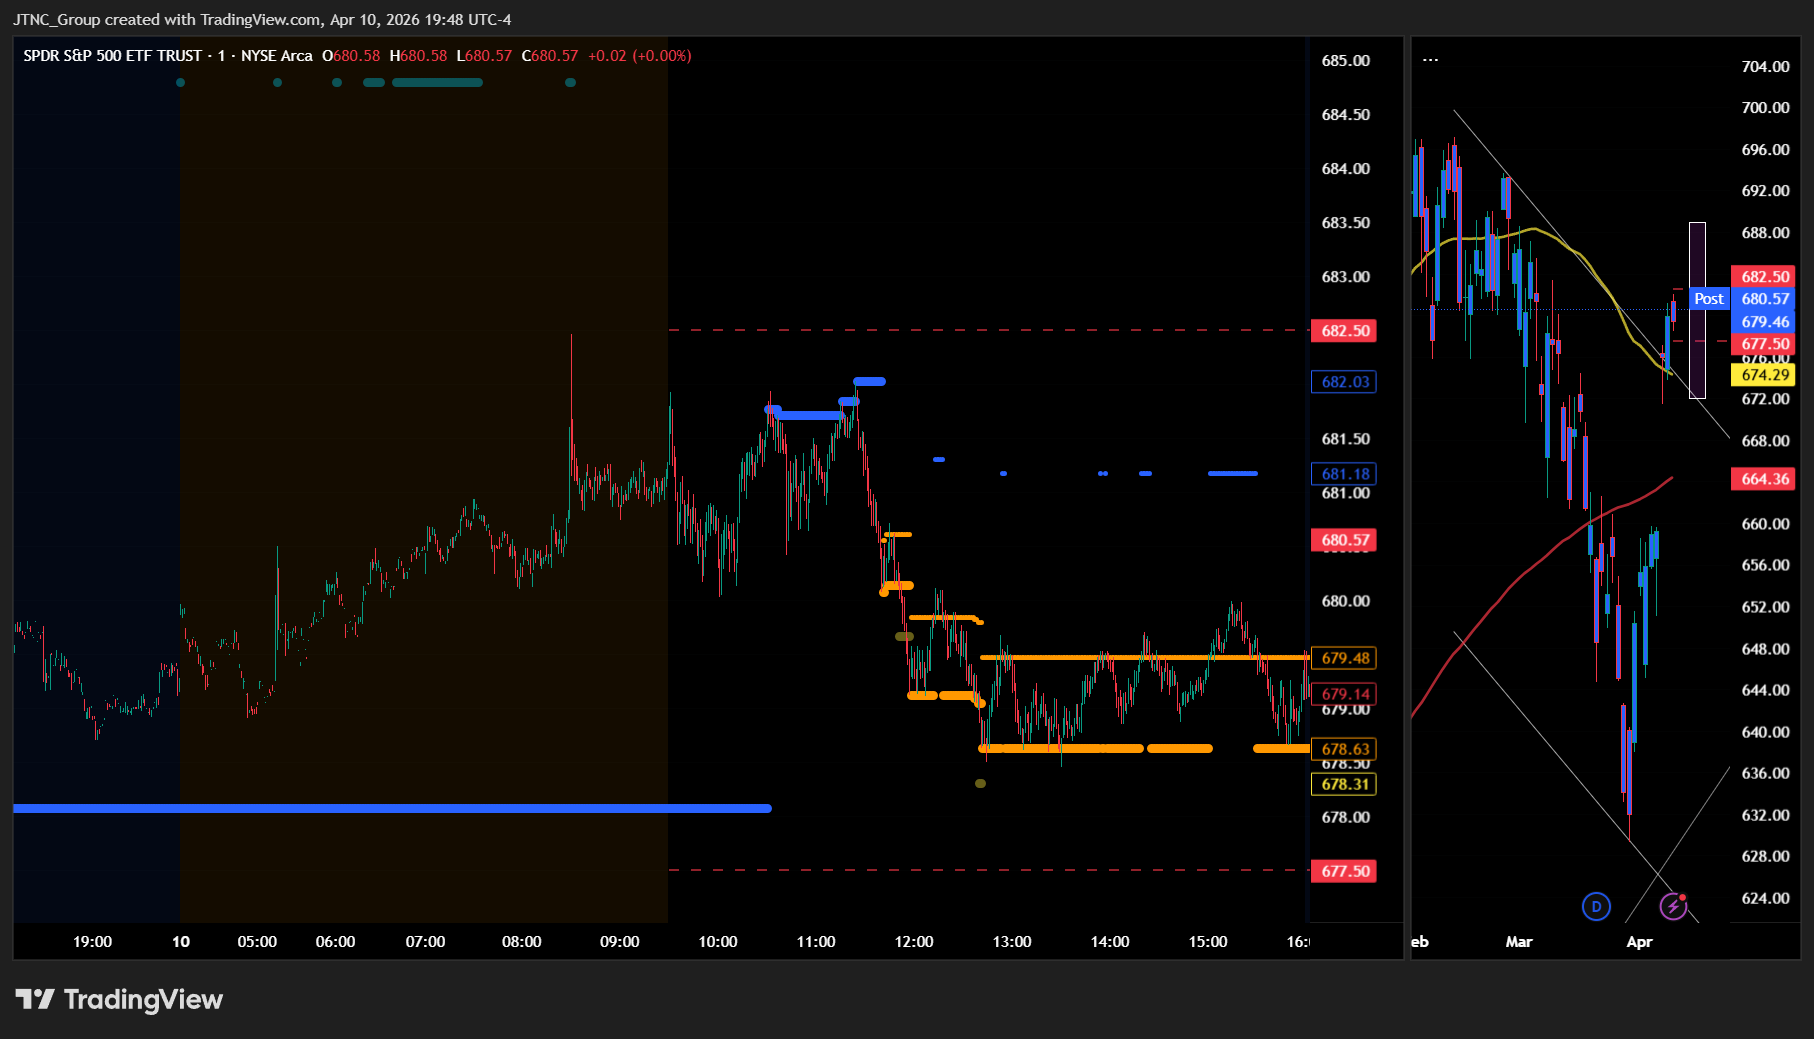
SPY opened at $681.32 and navigated a relatively narrow $3.58 trading range during a session marked by modest selling pressure, touching a high of $682.03 in early trading before retreating to a low of $678.45. The index closed at $679.53, posting a marginal 0.06% decline that essentially held steady after the prior session's advance and demonstrated the market's ability to digest recent gains without significant deterioration. Volume registered 38.35 million shares, running below average levels and suggesting restrained participation as market participants remained cautious amid mixed signals from both technical and fundamental factors. The price action showed initial strength near the open before encountering resistance around $682, with SPY subsequently drifting lower in a controlled fashion that avoided any sharp selling pressure while testing support in the upper $678 range. The VIX's modest rise of 0.36% to 19.56 reflected a slight uptick in caution among market participants, though volatility measures remained well contained compared to recent elevated readings and indicated that fear levels stayed largely in check. SPY's ability to limit downside despite the negative close while maintaining proximity to recent highs suggests that underlying demand remains present, with the combination of below-average volume and minimal volatility expansion pointing toward a pause in the recent upward momentum rather than any meaningful shift in market sentiment.
Major Indices Performance
The Nasdaq managed a modest 0.35% gain to lead major indices, as technology stocks found selective buying interest despite mixed individual performances within the sector's largest names. The tech-heavy benchmark's advance came amid continued investor appetite for growth-oriented exposure, though the gains were more measured compared to recent sessions. This outperformance reflected the market's ongoing preference for technology names even as broader market sentiment remained cautious.
The Russell 2000 declined 0.3% as small-cap stocks gave back some of their recent gains, with domestically-focused names facing pressure amid mixed economic signals. The small-cap benchmark's retreat suggested that the recent rotation into smaller companies encountered some resistance, as investors showed more selective behavior across market capitalizations. This pullback interrupted the index's recent momentum and indicated some consolidation after strong prior advances.
The Dow Jones Industrial Average posted the session's weakest performance with a 0.56% decline, as blue-chip industrials and value-oriented large-caps faced selling pressure. The industrial average's underperformance stood in contrast to technology's resilience, highlighting the continued divergence between growth and value segments of the market. This weakness across traditional value names suggested that investors remained cautious about cyclical exposure amid ongoing economic uncertainties.
Notable Stock Movements
NVIDIA dominated the Magnificent Seven with a commanding 2.63% surge that established the chipmaker as the undisputed leader among technology giants and reinforced the group's capacity to generate meaningful outperformance even during mixed market conditions. The semiconductor leader's substantial advance provided critical momentum that helped offset weakness elsewhere in the cohort, demonstrating how individual breakout performances continue to drive the collective influence of these market-moving names.
Microsoft emerged as the primary drag within the technology titans, declining 0.59% in what represented the most significant pullback among the group's constituents and highlighted the selective nature of today's technology trading. Alphabet joined Microsoft in negative territory, creating a pocket of weakness that contrasted sharply with the strength displayed by the remaining members, though this isolated selling pressure proved insufficient to derail the cohort's otherwise constructive performance.
The Magnificent Seven's predominantly positive showing delivered essential support for the broader market's mixed session, with NVIDIA's leadership underscoring the group's ability to generate upward momentum when key semiconductor components deliver outsized gains. This mostly green performance across the majority of members reflects continued institutional appetite for mega-cap technology exposure, with the cohort's resilience validating persistent investor confidence in these market-leading names despite an environment characterized by sector rotation and measured trading activity.
Commodity and Cryptocurrency Updates
Crude oil retreated 1.55% to $96.35, pulling back from recent highs but maintaining its position well above the $70 threshold that has defied longer-term model expectations throughout this rally. The modest decline follows the commodity's extraordinary run toward triple digits, though the pullback appears more like profit-taking than a fundamental shift in the underlying supply dynamics that have driven crude's impressive advance. The sustained elevation above $70 continues complicating Federal Reserve policy considerations, as energy prices remain a meaningful contributor to inflationary pressures that could influence monetary policy decisions going forward.
Gold declined 0.18% to $4,784, experiencing a minor setback after its recent historic performance as the precious metal consolidates near record territory. The modest pullback represents little more than a pause in gold's extraordinary advance, with the metal continuing to attract safe-haven demand despite reaching unprecedented valuations. Investor appetite for hard assets remains robust as market participants maintain their view of gold as essential portfolio protection, with the slight decline doing nothing to diminish the metal's appeal amid ongoing economic uncertainties.
Bitcoin surged 2.05% to close above $73,236, delivering strong gains that extended the cryptocurrency's recent momentum and pushed it to fresh highs for this cycle. The solid advance reinforces Bitcoin's technical strength as digital asset markets continue attracting institutional interest and benefiting from improving regulatory clarity. The upward movement demonstrates underlying stability in the cryptocurrency space, with Bitcoin maintaining its position as the dominant digital asset while broader market conditions support alternative investment strategies and portfolio diversification into non-traditional assets.
Treasury Yield Information
The 10-year Treasury yield climbed meaningfully today, rising 0.56% to close at 4.320%, moving closer to our critical 4.5% threshold that historically signals the beginning of systematic pressure on equity markets. This uptick represents a more substantial move than recent sessions and places yields just 18 basis points away from the level where stock market headwinds typically intensify and sustained rallies become increasingly difficult to maintain. The yield advance occurred alongside mixed equity performance, with the Nasdaq managing modest gains while the Dow declined, suggesting markets are already beginning to feel the gravitational pull of higher borrowing costs even before reaching our key inflection point. Today's Treasury movement reinforces the precarious balance equity markets must maintain as yields approach levels that have historically proven problematic for risk asset valuations. Our framework remains crucial for understanding the path ahead: any breach above 4.5% would create systematic equity pressure that typically overwhelms positive sentiment, while a climb above 4.8% historically precedes significant market selloffs as institutional investors begin reducing risk exposure. The more severe threats emerge above 5%, where serious systematic risks develop that can trigger major corrections across all equity sectors, and any move beyond 5.2% would historically signal that 20%+ declines become highly probable across major indices. With yields now advancing at a faster pace and sitting uncomfortably close to our first warning level, traders must monitor Treasury markets closely for any acceleration that could quickly push borrowing costs into territory where equity optimism transforms into widespread selling pressure across risk assets.
Previous Day’s Forecast Analysis
Our previous forecast called for SPY to trade within a $667.50 to $678 range on Friday, representing a $10.50 trading band that suggested consolidation following Thursday's modest gains. The model identified $673 as the critical bias level, with Thursday's close above this threshold creating a cautiously constructive backdrop despite ongoing macro uncertainties. However, the analysis emphasized that the downside presented the more probable scenario, requiring active buyers to prove sustained interest rather than assuming follow-through momentum.
The trading strategy focused on fading rallies toward resistance levels, particularly targeting the $676 initial resistance and $678 ceiling for short opportunities. The forecast anticipated that unless buying activity became unquestionably aggressive, the market would favor selling pressure at the upper end of the range. Any failure to hold the $673 bias level was expected to shift focus immediately to $670 support, with potential extension toward the $667.50 floor under accelerated selling conditions.
From a tactical perspective, the recommended approach involved shorting the $680-$681 resistance zone targeting pullbacks toward $674-$676 support, with extended objectives around $671-$673 if institutional profit-taking materialized. For bullish positioning, any weakness toward the $674-$676 support band offered compelling long entries targeting $680-$682 resistance with stops below $673. The strategy emphasized 3-4 point stop distances and conservative position sizing while monitoring the $674 level as critical floor territory that needed to hold for any continuation scenarios.
Market Performance vs. Forecast
SPY's Friday performance delivered mixed results against our model's projections, with external factors driving price action that challenged several key assumptions in our framework. The session opened at $681.32, well above our projected $667.50-$678 trading range, immediately signaling that overnight developments had shifted the technical landscape beyond our base case scenario. However, our identification of resistance near current levels proved prescient as SPY encountered selling pressure almost immediately, declining from the open to establish a high of just $682.03 before facing the distribution we anticipated around these elevated price zones.
The market's inability to sustain momentum above $681 validated our cautionary stance regarding the need for buyers to prove their conviction at these levels. SPY's retreat to a low of $678.45 brought price action back toward our projected upper boundary, demonstrating that our resistance analysis captured the market's reluctance to extend gains without compelling fundamental catalysts. The close at $679.53 for a minimal 0.06% decline reflected the consolidative character our model anticipated, though the session played out at higher absolute levels than our framework initially projected due to the stronger overnight positioning.
Most importantly, our emphasis on fading rallies near resistance levels and maintaining defensive positioning proved valuable as the session's character matched our expectations for proving buyer commitment rather than assuming follow-through. The framework's focus on the $673 bias level became less relevant given the elevated opening, but our broader thesis about distribution near current highs captured the market's actual behavior. Risk management protocols effectively protected capital as the session demonstrated the type of stalling action our analysis anticipated, confirming that the model's emphasis on caution and range-bound expectations remains valuable even when external factors shift the absolute price parameters.
Premarket Analysis Summary
This morning's premarket analysis positioned SPY at $680.43 with the critical bias level established at $679.50. The framework outlined upside targets at $682.50 and $685 for scenarios where the market could sustain its recovery gains, though the analysis emphasized growing participant desire to unwind the upward journey and consolidate gains. The assessment noted the market was hanging onto recovery gains "very, very tenuously" with constant questioning of whether current levels represented a peak. Downside support was mapped at $677.50, $675, $674, and $668 for consolidation scenarios if the bias level failed to hold. The analysis warned of a potential cascade effect if participants began taking profits, with particular concern about losing $674 which could trigger moves toward $668.
The market delivered a performance that closely validated the premarket framework's cautious outlook and technical levels. SPY opened at $681.32 above the premarket spot price but failed to sustain upward momentum, reaching only $682.03 as a session high before declining. The index lost the crucial $679.50 bias level during the session with a low of $678.45, though it managed to recover slightly to close at $679.53 for a marginal 0.06% decline. The VIX rise of 0.36% to 19.56 reflected the underlying tension the premarket analysis identified about sustainability. While the market avoided the deeper cascade toward $675 or $674 that the framework outlined, the inability to hold above the bias level and the failure to reach the $685 upside target demonstrated the tenuous nature of the recovery gains that morning's analysis highlighted.
Validation of the Analysis
The premarket analysis delivered exceptional accuracy in identifying the pivotal 679.50 bias level that would determine SPY's directional trajectory, with our warning that the market was "hanging on to its recovery gains very, very tenuously" proving prophetic as SPY opened at $681.32 and immediately faced the selling pressure we anticipated. Our assessment that there was "a growing desire to unwind this journey upward" perfectly captured the market's internal dynamics, as SPY quickly retreated from its $682.03 high—just shy of our 682.50 upside target—and descended toward the critical bias level we highlighted as the make-or-break point for continued bullish momentum. Most remarkably, our technical framework proved laser-precise when SPY tested our 679.50 threshold, touching a session low of $678.45 before finding support and ultimately closing at $679.53, demonstrating the exceptional value of our premarket guidance in identifying the exact level where buyers would need to defend to prevent the "tumble" we forecasted. The analysis provided tremendous trading value by clearly outlining the upside target at 682.50 where profit-taking opportunities would emerge, with SPY's approach to $682.03 offering savvy traders the chance to capture gains before the inevitable pullback we warned was lurking. Our cautionary tone about the market's tenuous position and the constant need to ask "Is this it?" proved invaluable for risk management, as traders who heeded our advice to watch the 679.50 bias level could navigate the session's volatility with confidence, knowing that a loss of this critical threshold would signal the beginning of the deeper consolidation toward our 675 and 674 targets that we mapped out as the likely cascade scenario.
Looking Ahead
Monday's economic calendar features the ISM Services PMI release, a critical gauge of activity in the dominant services sector that comprises roughly 80% of the US economy. The Services PMI has become increasingly important for Federal Reserve policy makers as they assess whether the economy can maintain its expansion while inflation pressures moderate. Any reading above 50 indicates expansion, but markets will focus on the specific level and any shifts in the employment and prices paid components that could signal changing labor market conditions or inflationary pressures within the services sector.
The session also includes remarks from President Trump, which could introduce additional market volatility depending on policy commentary or economic outlook statements. With Wednesday's FOMC Meeting Minutes and Thursday's Core PCE data looming later in the week, Monday's Services PMI reading will help set the tone for how markets interpret the Federal Reserve's current policy stance and future trajectory. Traders will particularly scrutinize any divergence between services sector strength and the manufacturing data from earlier in the week, as this balance influences broader economic growth expectations.
Market Sentiment and Key Levels
Bears gained a slight edge in market sentiment as SPY's modest 0.06% decline and the VIX's rise to 19.56 reflected growing caution among participants who appeared increasingly hesitant to chase prices at current elevated levels. The below-average trading volume of 38.35 million shares suggested institutional restraint rather than aggressive selling, indicating this pullback represents profit-taking and position adjustment rather than panic as market makers navigated mixed signals across sectors with technology showing resilience while traditional value sectors faced pressure.
Key resistance for SPY solidifies at today's high of $682.03, where momentum stalled after testing higher ground, with more significant overhead pressure building around the $685-690 zone where previous distribution patterns could reassert if bulls attempt another advance from current levels. Support establishes at the session low of $678.45, representing the level where buyers successfully stepped in to prevent deeper selling, with stronger foundational support developing around $675-678 where recent accumulation activity has occurred. A sustained breakout above $682.03 could reignite momentum-driven buying targeting the $685-695 corridor as technical momentum builds, while any breach below $678.45 might invite more serious profit-taking back toward the $670-675 zone where strategic buyers could emerge to defend key technical levels.
Current market dynamics reflect heightened uncertainty as participants balance conflicting signals from various asset classes while monitoring potential catalysts that could shift sentiment decisively in either direction. The path forward requires bulls to demonstrate renewed conviction by reclaiming today's highs while bears need sustained selling pressure below support to establish a more meaningful correction from these elevated levels amid ongoing volatility from external factors.
Expected Price Action
Our actionable intelligence generated by our AI model projects SPY will experience a challenging Monday session, with the projected trading band spanning from $668 on the downside to $685 on the upside. This $17 range signals the market is positioned for significant trending action rather than consolidation, as participants grapple with the precarious technical setup following Friday's marginal decline. The model identifies $679.50 as the critical bias level that will determine Monday's direction, with Friday's close just above this threshold creating an unstable equilibrium that demands immediate resolution from buyers or sellers.
The framework emphasizes that the market is "hanging on to its recovery gains very, very tenuously" and highlights a growing desire among participants to unwind recent advances. This creates a particularly dangerous environment where any failure to hold the $679.50 bias level could trigger cascading selling pressure through multiple support zones. Initial upside targets sit at $682.50 and potentially $685 if buyers can demonstrate genuine conviction, but the model suggests this represents the less probable outcome given current market psychology favoring profit-taking over accumulation.
The downside scenario presents a more structured and concerning pathway, with the model outlining a series of critical decision points that could accelerate selling momentum. A loss of $679.50 would immediately shift focus to the $675 support zone, but the real concern emerges at $674 where a breakdown could trigger extension toward the $668 floor. Monday's session will likely hinge on whether the market can maintain its tenuous grip above the bias level or if participants finally succumb to the growing pressure to consolidate recent gains through meaningful selling activity.
Trading Strategy
Following today's modest consolidation around current levels, the $678-$679 support zone presents compelling long opportunities targeting rebounds toward the $681-$682 resistance cluster with extended objectives around $684-$686 if buyers can establish momentum through overhead supply. Initiate bullish positions on any strength confirmation above $680 with protective stops below $677 to capture potential institutional accumulation while limiting downside exposure through proven support structures. The VIX rose 0.36% to 19.56, indicating a slight uptick in cautionary sentiment that suggests underlying market tension remains present despite the relatively stable price action.
For bearish positioning, any rejection attempts near the $681-$682 resistance band offer attractive short entries targeting $676-$678 support with extended objectives toward $673-$675 if sellers can establish control through current consolidation zones. Focus on the $681-$682 area specifically for optimal risk-reward setups with protective stops above $683 to maintain disciplined upside protection while positioning for potential distribution from proven resistance territory. The modest fear gauge increase creates more defensive conditions for directional trades, though traders should monitor volume patterns as institutional positioning appears to be in a wait-and-see mode.
Risk management protocols should emphasize 2-3 point stop distances from entry points while maintaining conservative position sizing given the elevated but stable volatility environment that typically accompanies sideways consolidation phases. The $678 level remains critical support territory that must hold for any bullish continuation scenarios, while sustained weakness below this threshold could trigger accelerated selling toward the $673-$675 zone representing the next logical downside target. Monitor the $681-$682 resistance band closely for volume-confirmed breakouts, as the current fear gauge reading suggests either $684-$686 upside targets or $673-$675 downside objectives could develop depending on institutional flow patterns and continued volatility normalization trends.
Model’s Projected Range
SPY's projected maximum range for Monday is $672 to $689, with the Call side dominating in an expanding band that suggests trending price action with intermittent chop. Monday brings ISM Services PMI and President Trump speaking, events likely to produce significant volatility particularly in the first hour of trading. SPY closed at $679.53, down 0.06% after opening at $681.32 and trading between a high of $682.03 and low of $678.45 in a session that saw modest selling pressure into the close. SPY remains in the $676 to $680 range that has defined recent trading as markets digest ongoing geopolitical tensions and await fresh catalysts. A break above the first resistance at $680 targets $685 as the next level of interest, while a failure below initial support at $676 opens the door to $675, and if that lowest support breaks there is little to keep price from falling toward $670. The long-term bull trend remains intact above $640, and as long as price holds above key structural levels, this remains a broader dip-buying environment. Absent a catalyst, resistance sits at $680, $685, $687, $689, while support rests at $676, $675, $672, $670. We favor buying dips at support given SPY's position near the lower end of its recent range. Bitcoin showed strength with a 2.05% gain closing above $73,236 while MAG stocks delivered mixed action with NVIDIA leading the gainers up 2.63% but Microsoft weighing on the group down 0.59%, creating a tug-of-war dynamic that reflects broader market uncertainty. The VIX rose 0.36% to 19.56, suggesting elevated fear given the modest selling pressure and uncertainty ahead of Monday's economic data. SPY closed just above the upper trendline of the trend channel with structural support near $67. Its highly probably the model redraws the trend line next week but maintains the bearish trend channel.
Market State Indicator (MSI) Forecast
Current Market State Overview:
The MSI ended Friday in a Bearish Trending Market State with SPY closing at $679.53. Since SPY closed above MSI resistance, the former MSI resistance at $679.48 now becomes support for Monday's session with resistance at $678.63. Extended targets were not printing at the close and were visible above in premarket, AM session, and PM session until @ 1 pm when they stopped printing. The MSI did not rescale overnight but did put in a series of higher rescalings around 11 am which faded quickly, and by noon the MSI had transitioned to a very narrow bearish state. The narrow $0.85 spread between the MSI levels shows price has compressed into a tight range that suggests consolidation rather than strong directional movement. Friday's session demonstrated mixed signals as extended targets above provided bullish signals in the premarket, yet the MSI maintained its bearish state into the close. The MSI forecast for Monday calls for likely sideways to possibly up as the narrow bearish MSI suggests consolidation rather than strong trending. That said, the bears are likely to maintain pressure to the downside. Any failure of MSI support is likely to see SPY retest the day's lows. MSI support is $678.63 with resistance at $679.48.
Key Levels and Market Movements:
Thursday we stated, "Bulls want to hold current levels overnight and push toward $685," and added, "Given the wide $6.73 MSI spread and Thursday's decisive move above the MSI range, Friday is expected to see a strong continuation higher," while also noting, "The wide spread indicates price has substantial room to move within the bullish framework." Friday's session failed to meet the bullish expectations as the market opened at $681.32 and faced immediate selling pressure despite starting in a Bullish Trending state. The MSI rescaled several times higher around 11 am but these moves faded quickly as bears regained control and pushed the indicator into a narrow bearish framework by noon. Extended targets were visible above throughout the entire session from premarket through the close, creating conflicting signals that made the session more challenging to navigate. The primary setup was selling any rally toward the evolving MSI resistance levels as the narrow bearish trending state provided limited directional bias for most of the session. Bears maintained control after the initial rescaling attempts failed, with SPY hitting a session low of $678.45 before recovering slightly to close at $679.53. At minimum it was a three-for-three session for traders following the framework as the MSI provided clear signals despite the compressed range offering more limited profit potential within the established structure. It was an easy day to read albeit not an easy day to trade given the tight choppy range, but substantial setups were present, all identified through proper context, patience, and flexibility while leveraging the MSI, premarket levels, and market structure rather than forcing trades. The MSI continues to prove its reliability as the cornerstone of our trading process.
Trading Strategy Based on MSI:
Monday has ISM Services PMI and President Trump Speaks which can introduce some volatility, so traders should be ready to trade what they see rather than predict. Bulls want to hold current levels overnight and push toward $682, while bears want to see the $679.48 support fail to press price toward lower levels around $675. Given the narrow $0.85 MSI spread and Friday's transition into a tight bearish range, Monday is expected to see sideways to possibly up action as the narrow bearish MSI suggests consolidation rather than strong trending. The narrow spread indicates price is coiling within a compressed framework, with the MSI likely to rescale overnight given the tight conditions and mixed signals from Friday's session. With SPY having closed above MSI resistance at $679.48, this level now becomes key support that bulls need to defend decisively to maintain the current structure. A successful test and hold at $679.48 would offer a long setup targeting higher levels around $682, while any breakdown below $679.48 with volume would signal a potential shift back toward the session lows and present a shorting opportunity targeting lower levels around $675. The narrow MSI spread with extended targets printing above at the close indicates compressed momentum with potential for expansion in either direction, and any move toward either boundary should be respected given the tight coiling action. Bulls need to defend $679.48 decisively to maintain structure, while bears want to see any rally fail and price break back below the support level to press toward Friday's lows. Any failure of MSI support is likely to see SPY retest the day's lows while any successful hold above $679.48 with volume confirms a potential relief rally targeting higher levels. The long-term bull trend remains intact above $640 and failed breakouts and failed breakdowns continue to offer the highest-probability setups. Remain flexible, avoid trading during Ranging Market States unless a clear failed breakout or breakdown presents itself, and ensure all trades are fully aligned with MSI signals. Providing real-time insights into market control, momentum shifts, and actionable levels, the MSI when integrated with our Pre-Market and Post-Market Reports continues to sharpen execution precision and elevate trade quality. If you haven't yet integrated MSI and our model levels into your process, now is the time. Contact your representative to get started as these tools are designed to support consistency and enhance performance.
Dealer Positioning Analysis
Dealers are selling SPY $680 to $700 and higher strike Calls, indicating the Dealers' belief that higher prices may be in store. The ceiling for Monday appears to be $685. To the downside, Dealers are selling $677 Puts while buying $679 to $611 and lower strike Puts in a 2:1 ratio to the Calls they're selling as well as selling ATM Puts in small size which indicates their belief that prices will continue higher on Monday or at least not fall below $677. Dealers do not sell ATM Puts unless they believe there is a floor in the market. This positioning reflects their measured optimism for upward movement, though they've established clear resistance around the $685 level. Dealer positioning is unchanged at neutral/slightly bullish.
Looking Ahead to Next Friday:
Dealers are selling SPY $680 to $718 and higher strike Calls, indicating the Dealers' belief that higher prices may be in store. The ceiling for next week appears to be $700. To the downside, Dealers are buying $679 to $585 and lower strike Puts in a 5:1 ratio to the Calls they're selling displaying significant concern that prices could move lower. This shift shows Dealers have increased their protection adding significant quantities of Puts and are no longer selling ATM Puts indicating a fear of lower prices next week. That said they are also open to the possibility that prices may rise to as high as $700 and are positioned accordingly. For the week Dealer positioning is changed at bearish. We advise reviewing Dealer positioning daily for directional clues. These positions evolve quickly and tracking them is essential for staying ahead of shifting market sentiment.
Recommendation for Traders
With SPY closing at $679.53 after a flat -0.06% session, traders should watch for a break above $682 resistance or potential support tests near $678. The VIX uptick to 19.56 suggests modest volatility concerns, so favor smaller position sizes and tighter stops around these key technical levels. Keep risk management paramount as markets digest mixed signals across sectors. Review the premarket analysis posted before 9 AM ET for any changes in the model's outlook and Dealer Positioning.
Good luck and good trading!
