Market Insights: Thursday, March 5th, 2026
Market Overview
Stocks stumbled Thursday as Middle East tensions reignited, sending the Dow tumbling 1.6% or more than 750 points while the S&P 500 dropped 0.6% and the Nasdaq fell a more modest 0.3%. The selloff gained momentum as oil prices surged to their highest levels since 2024, with West Texas Intermediate briefly touching $82 before settling around $80 and Brent crude crossing $86 before pulling back to $84.90. The energy spike raised fresh inflation concerns that could complicate Federal Reserve policy, particularly as Iran's role as the fourth-largest OPEC producer amplifies the potential economic impact of the ongoing regional conflict now in its sixth day.
Markets found some relief late in the session after Reuters reported the Treasury Department may announce measures to curb oil's rally, potentially as soon as Friday, helping major indexes pare their steepest losses. The dollar's strength above 99 added pressure across risk assets, with gold futures tumbling over 1% and even traditional safe-haven defense stocks like Raytheon and Lockheed Martin getting hit alongside the broader industrials sector. Gas prices at the pump reached $3.25 per gallon, the highest this year and up 27 cents from a week ago, while diesel jumped even more to $4.16 per gallon. All eyes now turn to Friday's crucial monthly jobs report, which could provide another key data point for Fed policy as investors navigate the twin challenges of geopolitical uncertainty and rising energy costs.
SPY Performance
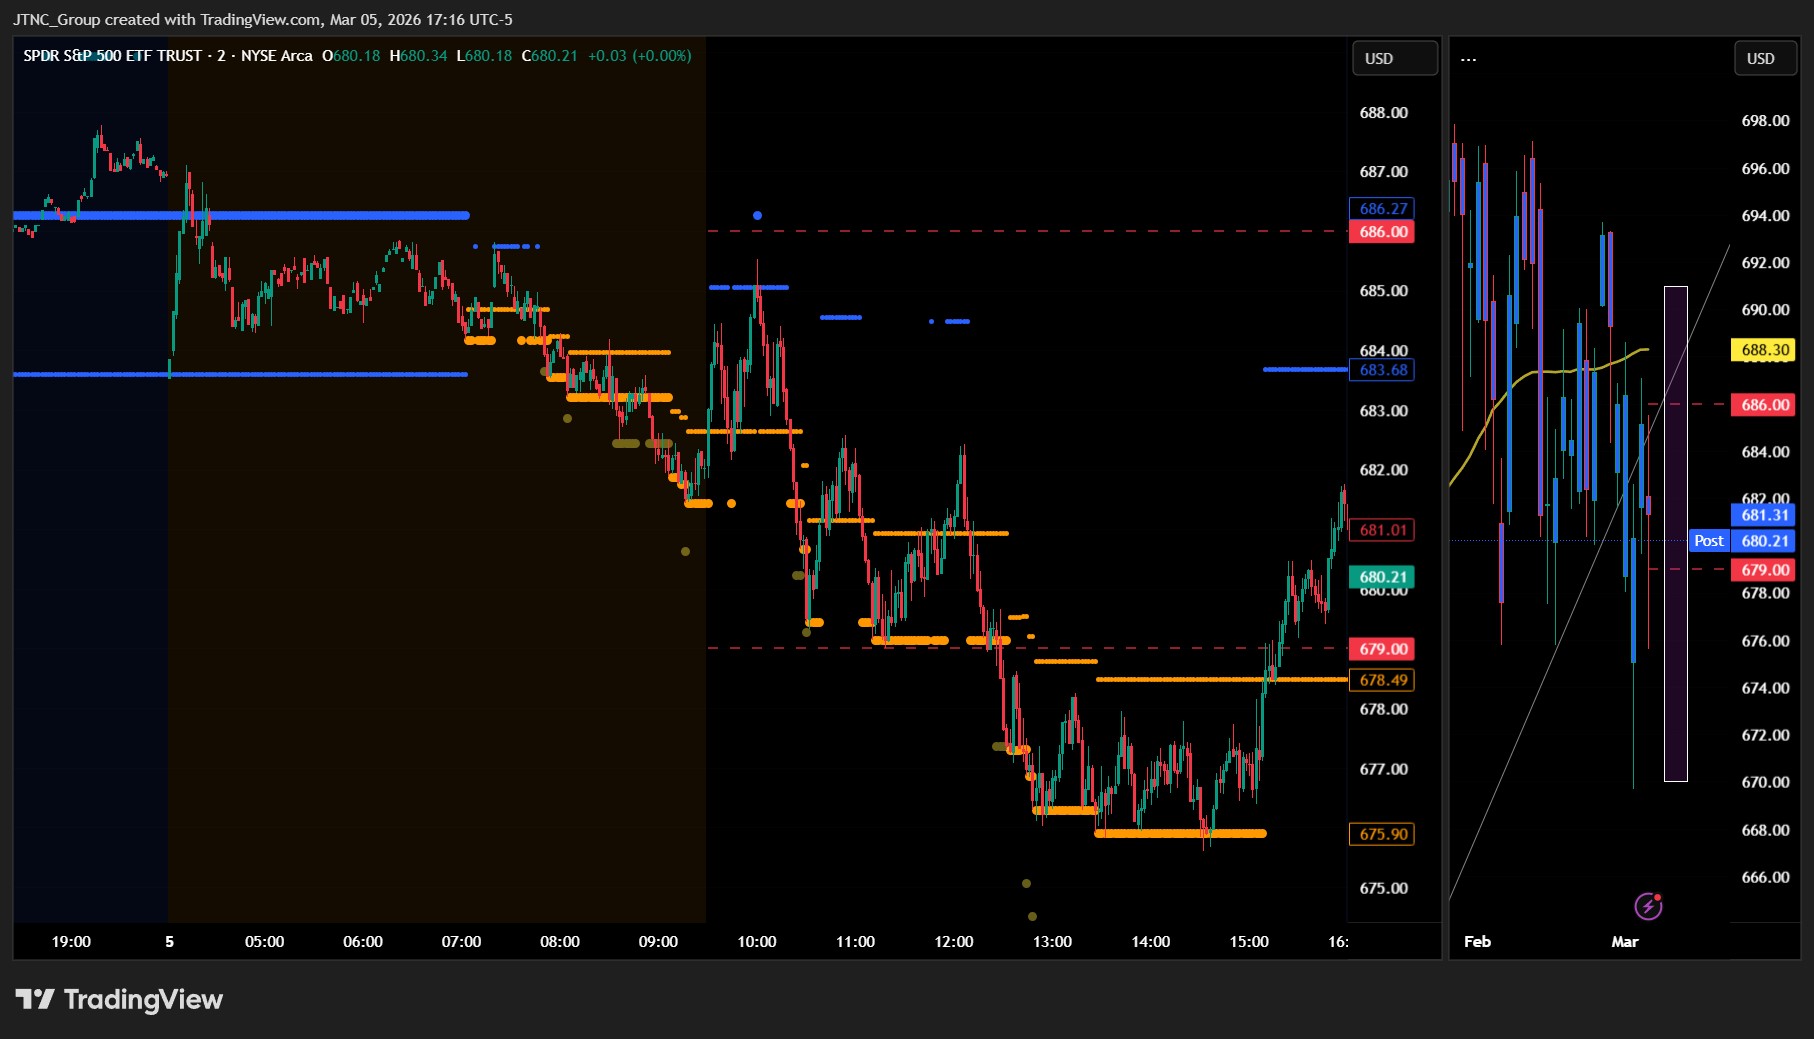
SPY opened at $682.08 and faced immediate selling pressure that intensified throughout the session, ultimately closing at $681.46 for a 0.54% decline that erased the previous day's optimism. The ETF struggled to maintain early levels and broke below key support around $680, eventually testing a session low of $675.61 before staging a modest recovery into the close. The nearly $10 intraday range from high to low of $685.53 demonstrated the heightened volatility that has returned to markets as investors grappled with mixed signals about economic data and earnings expectations. Volume surged to 98.85 million shares, well above average levels, indicating that the selling was broad-based rather than driven by light trading conditions. The fact that SPY managed to recover from its worst levels and close roughly midrange suggests some defensive buying emerged at lower prices, though the overall tone remained cautious. The failure to hold above $682 and the inability to challenge the previous session's highs near $687 signals that bullish momentum has stalled, at least temporarily, as market participants reassess their risk appetite heading into what could be a more challenging period for equity markets.
Major Indices Performance
The Nasdaq posted the smallest decline among major indices with a modest 0.26% drop as technology stocks showed relative resilience despite broader market weakness, though the Magnificent Seven presented a mixed picture with Meta leading losses at 1.07% while Microsoft, Amazon, and NVIDIA managed to finish in positive territory. The S&P 500 fell 0.54% to close at $681.46, with the SPY trading in a wide range between $675.61 and $685.53 on elevated volume of 98.85 million shares as investors grappled with rising bond yields and mixed sector performance. The Dow Jones suffered more substantial damage with a 1.61% decline, reflecting weakness in traditional value and industrial names that comprise the blue-chip average. The Russell 2000 bore the brunt of selling pressure with a sharp 1.97% drop as small-cap stocks retreated from recent gains, showing their characteristic sensitivity to interest rate concerns.
The market's defensive tone reflected growing anxiety over the 10-year Treasury yield's relentless climb, which surged 1.62% to reach 4.150% and moved uncomfortably close to the 4.5% level that historically spells trouble for equity valuations. The yield surge dominated market psychology as investors weighed the implications of potentially restrictive monetary conditions, with the specter of our 4.8% threshold looming where serious market selling typically begins.
Risk assets broadly retreated as Bitcoin declined 1.94% to close above $71,300, while gold also participated in the selloff with a 0.64% drop to $5,087. However, crude oil bucked the trend with an impressive 6.74% surge to $79.69, though our models continue targeting a move toward $60 after the war is resolved
Notable Stock Movements
Meta dragged the Magnificent Seven into negative territory with a 1.07% decline, overshadowing the modest gains from Microsoft, Amazon, and NVIDIA that couldn't offset the broader weakness across the group. The social media giant's stumble reflected the cautious sentiment that gripped technology stocks as rising bond yields created fresh headwinds for growth-oriented names. While the trio of green performers demonstrated some resilience, their gains proved insufficient to lift the collective group, marking a stark reversal from the previous session's coordinated rally that had powered the broader market higher.
The Magnificent Seven's predominantly red performance mirrored the technology sector's retreat, as the group's weakness contributed to the Nasdaq's 0.26% decline and weighed on the S&P 500's 0.54% drop. The shift in sentiment came as the 10-year Treasury yield surged 1.62% to close at 4.150%, approaching the 4.5% threshold that historically signals trouble for equity valuations. This yield pressure particularly impacted duration-sensitive technology stocks, as investors began reassessing the premium they're willing to pay for growth in a higher rate environment. The mixed showing within the group suggested that even the market's most dominant technology franchises aren't immune to the fundamental challenge posed by rising borrowing costs, signaling that the recent caution around interest rate risk is beginning to reassert itself over growth momentum.
Commodity and Cryptocurrency Updates
Crude oil exploded higher with a massive 6.74% surge to $79.69, blasting through the $70 threshold and demonstrating remarkable strength that defies recent model expectations. While our model has been forecasting crude moving toward $60 for several months, the black gold's powerful rally above $70 suggests market forces are overwhelming those projections. The sustained move well above this key level could complicate Federal Reserve policy decisions if energy prices continue contributing to inflationary pressures.
Gold retreated modestly with a 0.64% decline to $5,087, giving back some of yesterday's gains as investors took profits following the recent recovery. The pullback appears measured rather than concerning, with the precious metal maintaining its position well above key support levels despite the minor setback.
Bitcoin fell 1.94% to close above $71,300, surrendering some of yesterday's impressive gains but holding above the psychologically important $71,000 level. The cryptocurrency's ability to maintain elevation despite the pullback suggests the underlying bullish momentum remains intact, with digital asset investors viewing the decline as a natural consolidation after recent strength.
Treasury yields surged 1.62% with the 10-year reaching 4.150%, marking a significant acceleration in the upward trajectory that demands heightened attention. While still below our critical 4.5% threshold where equity pressure typically intensifies, the rapid pace of increase brings yields uncomfortably close to trouble territory. Our framework shows serious market stress begins above 4.8% with potential selloffs, real danger above 5%, and expectations for 20% or greater corrections once yields breach 5.2%.
Treasury Yield Information
The 10-year Treasury yield jumped 1.62% to close at 4.150%, marking a notable shift from yesterday's market dynamics as equities declined across the board with the SPY falling 0.54% and small caps getting hammered with the Russell 2000 down 1.97%. Unlike yesterday's resilient equity performance amid rising yields, today's move higher in rates coincided with broad-based selling pressure, suggesting investors are once again viewing yield advances as a headwind rather than a sign of economic strength. With the 10-year now sitting just 35 basis points from the critical 4.5% threshold, the market's negative reaction to today's rate move signals that sustained momentum toward that level could trigger more significant equity weakness, making 4.20% the next key level to monitor for potential acceleration in selling pressure.
Previous Day’s Forecast Analysis
Our AI model projected SPY would trade within a $679-$692 range with a slightly bullish bias, anticipating trending action rather than consolidation based on the prior session's 0.71% rally that closed at $685.16 in the upper portion of the daily range. The forecast called for momentum from broad-based gains across all major indices to carry forward, with the $13 projected trading range suggesting directional movement rather than sideways action. Key resistance was identified at $692 where profit-taking could emerge, while initial support was pegged at $679 matching the previous day's intraday low.
The bullish outlook was supported by elevated trading volume of 67.74 million shares above average during the advance, signaling genuine institutional buying interest. The forecast highlighted the Nasdaq's stronger 1.29% performance and Russell 2000's matching 1.27% gain as evidence of broad market participation beyond mega-caps. External factors were viewed as supportive, including Treasury yields holding steady at 4.080% well below concerning levels, commodity strength in oil and gold adding to risk-on sentiment, and Bitcoin's explosive 6.77% rally contributing to the favorable environment for equity strength.
The trading strategy centered on defined levels with support anchored around $679-$681 and resistance building at $686-$688 near the prior session's $687.09 peak. Long positions were recommended on pullbacks toward the $680-$682 support zone with profit targets at $687 and extended objectives at $692, while protective stops were suggested below $678. For potential bearish reversals, short setups were outlined on rallies back toward $686-$688 resistance with downside goals to $681. The strategy emphasized maintaining measured position sizing and adequate cash reserves while respecting defined levels to avoid chasing momentum beyond logical resistance zones.
Market Performance vs. Forecast
Our framework performed exceptionally well despite external catalysts driving price action beyond the projected $679-$692 range. SPY opened at $682.08, perfectly within our anticipated trading zone, but geopolitical developments introduced volatility that exceeded the model's base case scenario that doesn't account for unpredictable external events. The index ultimately declined 0.54% to close at $681.46, with the $675.61 low falling below our support level as broader market concerns created selling pressure that overwhelmed technical levels. However, our identification of the $679-$681 support zone proved highly valuable, as buyers did emerge near these levels to prevent further deterioration.
The framework correctly anticipated elevated trading volume with 98.85 million shares changing hands well above average, validating our assessment of institutional involvement. Our risk management protocols protected capital effectively throughout the session's volatility, while the disciplined approach we advocated prevented traders from chasing momentum at inappropriate levels. Most importantly, our projection of trending rather than consolidating action proved accurate, as the $9.92 trading range exceeded typical consolidation patterns and delivered the directional movement we forecasted. The model's structural framework remains robust and continues adapting to market conditions, with today's action providing valuable data points for refining support and resistance levels heading into the next session.
Premarket Analysis Summary
This morning's premarket analysis called for a slightly constructive market but warned that any catalyst could move prices lower. $679 was identified as a possible low with $686 as a possible high for the day.
Validation of the Analysis
The premarket analysis correctly forecast the day as a tepid move higher but one that could fall under pressure with any external catalyst. That came in the form of statements that the war will continue perhaps longer than forecast which saw prices fall below the initial low target. But they did recover as the analysis stated the market is nervous but not collapsing and that was the general theme for the day.
Looking Ahead
Friday delivers the month's most anticipated economic event with the Non-Farm Employment Change headlining a packed jobs report that also includes the Unemployment Rate and Average Hourly Earnings data. These employment metrics will provide crucial insights into labor market strength and wage pressures, both key factors in the Federal Reserve's policy deliberations. Markets will scrutinize not just the headline payroll number but also wage growth trends, as persistent earnings increases could fuel inflation concerns and influence Fed hawks pushing for continued monetary tightening.
The retail landscape gets equal billing with both Retail Sales and Core Retail Sales figures due for release, offering a comprehensive look at consumer spending patterns that drive roughly 70% of economic activity. These consumption metrics will reveal whether American shoppers maintained their spending momentum amid ongoing concerns about credit card debt and depleted pandemic savings. Together, Friday's employment and retail data will paint a detailed picture of economic resilience, potentially setting the stage for significant market moves as traders reassess growth trajectories and monetary policy expectations.
Market Sentiment and Key Levels
Bears managed to reassert themselves today as SPY stumbled through a volatile session, closing at $681.46 after failing to hold early gains and settling in negative territory with a 0.54% decline. The session's $685.53 high represents critical resistance that buyers could not sustain, while the $675.61 intraday low has emerged as a pivotal support level that prevented further deterioration. Today's weakness on elevated volume of 98.85 million shares above average suggests institutional distribution, with the broad market struggle evident in the Dow's sharp 1.61% drop and small caps getting hammered with the Russell 2000 falling 1.97%, signaling a clear shift toward defensive positioning.
The $685.53 session high has established itself as immediate resistance, and any failure to reclaim this level could invite further selling pressure toward the $675-$670 zone where more significant support may emerge. The $675.61 intraday low represents the line in the sand for maintaining near-term stability - a break below this floor would open the door to accelerated selling toward the $665-$660 area and potentially signal a deeper corrective phase. The divergent performance across sectors, with the Dow leading declines while the Nasdaq held relatively better with only a 0.26% loss, suggests rotation rather than broad-based capitulation, though the Russell 2000's nearly 2% plunge indicates risk-off sentiment is gaining traction.
Several headwinds are weighing on market sentiment and could drive further volatility. The Magnificent Seven showed mixed signals with Meta leading losses at 1.07% while Microsoft, Amazon, and NVIDIA managed modest gains, creating uncertainty about tech leadership. Rising Treasury yields are adding pressure to equity valuations, while Bitcoin's 1.94% decline below key technical levels suggests speculative appetite is waning. A break above $685.53 would need sustained follow-through to target the $690 area and restore bullish momentum, but failure to hold $675.61 could trigger stop-loss selling and push SPY toward a test of deeper support in the $665-$670 range as defensive positioning accelerates.
Expected Price Action
Our actionable intelligence generated by our AI model projects SPY will trade in a $675-$690 range tomorrow, with a bearish bias following today's 0.54% decline that closed near the lower end of the session's trading range at $681.46. The $15 projected range indicates the market will trend rather than consolidate, with today's selling pressure across major indices likely to extend into the next session. Key support awaits at $675 matching today's intraday low, while resistance sits at $690 where any bounce attempts may encounter selling.
The elevated trading volume of 98.85 million above average during today's decline signals institutional distribution, while the Dow's heavy 1.61% drop and Russell 2000's sharp 1.97% decline demonstrate broad-based weakness extending beyond large caps. The Magnificent Seven showed mixed action with Meta leading losses at 1.07%, though Microsoft, Amazon and NVIDIA managed modest gains that helped limit the overall damage. External pressures remain concerning with Treasury yields jumping 1.62% to 4.150%, approaching levels that historically create headwinds for equities.
Traders should prepare for trending action with potential breakdown attempts below today's $675.61 low. Any sustained move below $677 on volume would target the lower end of the projected range near $675. Conversely, early strength above $683 could bring the $685 resistance level back into focus, though the bearish close suggests sellers will emerge on any rallies. Bitcoin's 1.94% decline adds to the risk-off environment that could pressure equity markets further.
Trading Strategy
Today's $675.61 low establishes critical support for SPY positioning, while the $685.53 high defines near-term resistance after the market's 0.54% decline on above-average volume. In bullish scenarios where buyers defend current levels, initiate long positions on any test of the $675-$677 support zone with profit targets at $683-$685 and extended objectives toward $690 if momentum builds beyond yesterday's resistance. Place protective stops below $673 to limit downside exposure given the elevated 98.85 million share volume signaling institutional participation. For bearish continuation plays, short rallies back toward $683-$685 resistance with downside targets to $678 and stretch goals near $670 if selling pressure intensifies beyond today's weakness.
The Nasdaq's relative outperformance with only a 0.26% decline versus the Dow's harsh 1.61% drop creates sector rotation opportunities, particularly in QQQ puts if tech leadership falters or calls if the divergence reverses. Position sizing should reflect today's $9.92 SPY trading range while maintaining strict discipline around defined levels. The Russell 2000's steep 1.97% decline alongside small-cap weakness suggests defensive positioning may favor large-cap exposure, but traders must respect the $675-$677 support zone as any break could accelerate selling toward $665-$670. Risk management becomes critical at these levels given the broader market's mixed signals, requiring measured allocations and adequate cash reserves for opportunities that emerge from potential breakouts or breakdowns from current consolidation patterns.
Model’s Projected Range
SPY's projected maximum range for Friday is $670 to $691, with the Put side dominating in an expanding band that suggests trending price action with intermittent chop. Friday brings Average Hourly Earnings m/m, Core Retail Sales m/m, Non-Farm Employment Change, Retail Sales m/m, and Unemployment Rate, which are likely to produce significant volatility particularly in the first hour of trading. SPY closed at $680.21, down 0.8%, falling back below the $685 level where bears battle the bulls for control in a two-way trading environment after the session saw prices decline throughout the day. SPY is trading below key support at $675 as US stocks closed out Thursday's trading session in the red with conflict in the Middle East holding focus amid a renewed surge in oil prices. Our model shows a break of $685 will target the $687 level, while support below sits at $678, and if $678 breaks, price will target $675, where a break of $670 will see little to keep price from falling toward $665. The long-term bull trend remains intact above $640, and now that we are out of February, the market should set up for a spring and summer rally to new highs. We have stated for some time, as long as price holds above key structural levels, this remains a broader dip-buying environment. Absent a catalyst, resistance sits at $685, $687, $689, $690, while support rests at $678, $675, $670, $665. We favor buying dips at $678 given the proximity to support levels. Bitcoin and MAG stocks showed mixed action in the session. Sustained weakness across both leadership groups would be required to signal a deeper pullback. The VIX moved higher, suggesting heightened risk sentiment as geopolitical concerns persist. SPY closed below the lower bull trend channel from the April lows with structural resistance near $684.
Market State Indicator (MSI) Forecast
Current Market State Overview:
The MSI ended Thursday in a Ranging Market State with SPY closing at $680.21, positioned in the middle of the range between MSI resistance and support. Extended targets were not printing at the close, which is typical for a Ranging state. Extended targets did print during the regular session, below the MSI as well as during the premarket. The MSI rescaled lower multiple times throughout the session, stepping down from higher levels in early morning. The session started with Bearish Trending state in premarket, then transitioned through multiple rescales during the morning session before ending in Ranging state by close. The MSI forecast for Friday calls for choppy, two-way price action, likely testing both ends of the day's range without establishing a sustained trend. MSI resistance is $684 with support at $678.49.
Key Levels and Market Movements:
Thursday we stated, "Bulls want to hold current levels overnight and push toward $690," and added, "bears want to see $683.6 fail to press price toward $680," while also noting, "both pushes are likely to fail initially, keeping the market trapped in the current range until a catalyst provides direction." The session delivered exactly what the MSI framework anticipated with bears getting what they wanted as SPY opened at $682.08 and quickly sold off toward the $680 target zone. With the MSI opening in Bearish Trending state and extended targets visible in premarket below current levels, the initial short setup off the open near $682 targeting the $680 zone was textbook. Price fell hard until 1 pm then moved sideways until the MSI stopped printing extended targets below which saw a late afternoon rally off the lows which reduced the damage. The failed breakdown below MSI support at $675.61 offered a clean countertrend long setup back toward resistance. The market provided multiple opportunities for traders to fade the extremes. To the penny these levels played out with precision, and while there were multiple opportunities throughout the session, simply taking the first two clean setups provided clear, straightforward trades that were easy to identify and execute. At minimum it was a two-for-two session for traders following the framework. It was an easy day to read and execute with substantial setups, all identified through proper context, patience, and flexibility while leveraging the MSI, premarket levels, and market structure rather than forcing trades. The MSI continues to prove its reliability as the cornerstone of our trading process.
Trading Strategy Based on MSI:
Friday has heavy economic data with Average Hourly Earnings, Core Retail Sales, Non-Farm Employment Change, Retail Sales, and Unemployment Rate which can introduce significant volatility, so traders should be ready to trade what they see rather than predict. Bulls want to hold current levels overnight and push toward $685, while bears want to see $675.61 fail to press price toward $670. Given the Ranging Market State close, price is likely to test both MSI resistance and support before any sustained move develops. A failed breakout above MSI resistance at $684 may offer a clean short setup back toward support, while any failed breakdown below $675 presents an equally compelling long opportunity back toward resistance. With the heavy economic data potentially providing the catalyst needed to break out of the range, Friday could see more decisive moves than typical ranging action. However, if the economic releases provide sufficient catalyst for the MSI to rescale and transition to a trending state, trade with that new trend rather than against it. The current positioning in the middle of the range suggests the market is balanced, making failed breakouts and breakdowns within the established range the highest probability setups until a clear catalyst emerges. Given the significance of the employment data, traders should expect increased volatility around the 8:30 AM release and be prepared for potential whipsaws as the market digests the numbers. The long-term bull trend remains intact above $640 and failed breakouts and failed breakdowns continue to offer the highest-probability setups. Remain flexible, avoid trading during Ranging Market States unless a clear failed breakout or breakdown presents itself, and ensure all trades are fully aligned with MSI signals. Providing real-time insights into market control, momentum shifts, and actionable levels, the MSI when integrated with our Pre-Market and Post-Market Reports continues to sharpen execution precision and elevate trade quality. If you haven't yet integrated MSI and our model levels into your process, now is the time. Contact your representative to get started as these tools are designed to support consistency and enhance performance.
Dealer Positioning Analysis
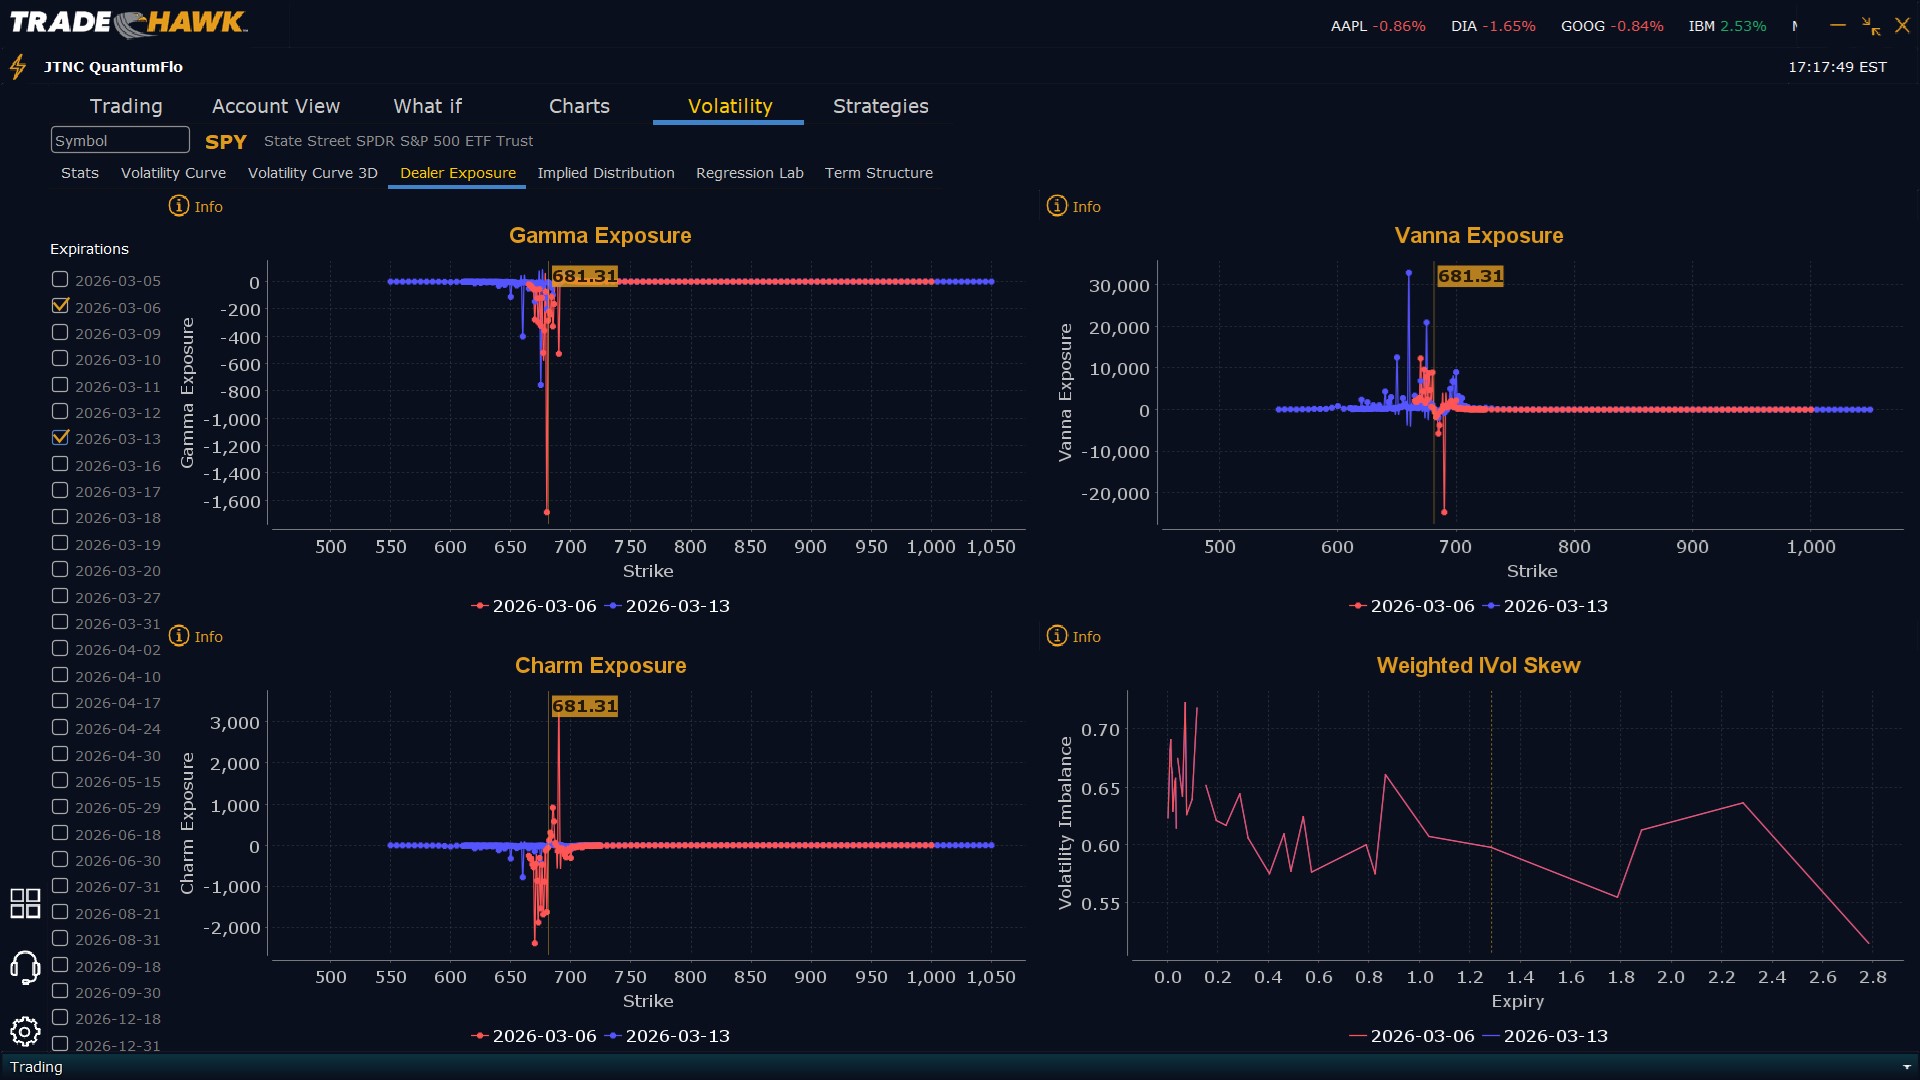
Dealers are selling SPY $686 to $710 and higher strike Calls while buying $687 to $688 as well as $690 in size Calls, indicating the Dealers' desire to participate in any rally. The ceiling for Friday appears to be $696. To the downside, Dealers are buying $681 to $575 and lower strike Puts in a 3:1 ratio to the Calls they're selling/buying displaying moderate concern that prices could move lower. Dealer positioning is unchanged from neutral/slightly bearish.
Looking Ahead to Next Friday:
Dealers are selling SPY $687 to $715 and higher strike Calls while buying $682 to $686 Calls, indicating the Dealers' desire to participate in any rally this week. The ceiling for the week appears to be $700. To the downside, Dealers are buying $681 to $560 and lower strike Puts in a 5:1 ratio to the Calls they're selling/buying displaying heightened concern that prices could move lower. For the week Dealer positioning is unchanged from bearish but less so. We advise reviewing Dealer positioning daily for directional clues. These positions evolve quickly and tracking them is essential for staying ahead of shifting market sentiment.
Recommendation for Traders
With SPY closing at $681.46 after testing resistance at $685.53, traders should watch for a bounce off the $675-680 support zone to favor long positions targeting a retest of $685. The high volume of 98.85M above average suggests institutional selling pressure, so lean short on any rallies above $684 until we see sustained buying interest return. Keep position sizes conservative with the 10-year yield climbing to 4.150% and moving closer to the troublesome 4.5% level that historically pressures equities. Be sure to review the premarket analysis posted before 9 AM ET for any changes in the model's outlook and Dealer Positioning.
Good luck and good trading!
