Market Insights: Wednesday, March 4th, 2026
Market Overview
Stocks bounced back Wednesday as markets found some relief from escalating Middle East tensions, with the Nasdaq leading the charge up 1.4% while the S&P 500 gained 0.9% and the Dow climbed 0.7%. The rally came after a New York Times report that Iran's intelligence ministry had indirectly reached out to the CIA through another nation's spy agency about potentially ending the conflict, though US officials remain skeptical of the overture. Adding fuel to the recovery was stronger-than-expected ADP private payrolls data showing 63,000 jobs added in February, beating estimates of 50,000 and setting up expectations ahead of Friday's crucial monthly jobs report.
The day's action felt like a throwback to 2023's megacap-driven rallies, with all seven Magnificent Seven stocks trading in the green and growth sectors bouncing off six-month lows. Tesla jumped 3% after Bank of America reinstated coverage with a Buy rating focused on the company's robotaxi prospects, while crypto markets surged with Bitcoin hitting a one-month high above $74,000 as more than $680 million flowed into spot ETFs over two days. Oil prices retreated on the Iran diplomatic news, with Brent crude trading near $81 and West Texas Intermediate around $73, helping ease some inflation concerns that had threatened to limit Federal Reserve rate cut prospects. Meanwhile, Bank of America analysts noted that Trump's One Big Beautiful Bill Act stimulus is showing up more in lower tax liabilities than higher refunds, likely pushing the bulk of consumer spending benefits into the second quarter rather than the first.
SPY Performance
SPY opened at $681.63 and maintained steady upward momentum throughout the session, reaching a high of $687.09 before settling at $685.16 for a solid 0.71% gain. The ETF's ability to hold above the $679.62 session low and sustain buying interest reflected renewed investor confidence as market participants shook off the previous day's concerns and focused on positive underlying fundamentals. The rally gained steam during midday trading as institutional flows shifted decidedly bullish, with the breach above $685 triggering additional momentum buying from algorithmic strategies that had been waiting for technical confirmation. Volume came in at 67.74 million shares, running higher than average and signaling genuine conviction behind the move rather than a light-volume drift higher. The relatively tight $7.47 intraday range compared to recent volatile sessions suggests that market participants are finding more stability in current price levels, while SPY's decisive close near session highs indicates that the buying pressure remained intact through the final hour of trading and could provide a foundation for further gains.
Major Indices Performance
The Nasdaq led the charge with a robust 1.29% surge as technology stocks rebounded from recent selling pressure, helped by strong performance across most Magnificent Seven names with Amazon jumping 3.88% to pace the gains. The Russell 2000 followed closely behind with a solid 1.27% advance as small-cap stocks regained their footing after yesterday's brutal 1.79% selloff. The S&P 500 climbed 0.71% to close at $685.16, with the SPY trading between $679.62 and $687.09 on above-average volume of 67.74 million shares as broader market sentiment improved markedly from the previous session's risk-off tone. The Dow Jones posted the most modest gains with a 0.49% rise, showing its typical defensive character even as markets rallied.
The turnaround came despite the 10-year Treasury yield pushing even higher with a 0.59% increase to 4.080%, edging closer to the 4.5% threshold that historically signals trouble for equity valuations. Risk assets staged a broad recovery as Bitcoin exploded 6.77% higher to close above $72,916, while gold also participated in the rally with a 0.82% gain to $5,149. Crude oil extended its recent strength with another 0.83% advance to $75.18, though our models continue forecasting a move toward $60 unless the commodity can hold above $56 support levels. The technology sector's leadership proved decisive in lifting markets, with only Apple managing to drag down the Magnificent Seven cohort with a 0.47% decline while Alphabet also finished in the red, unable to match the enthusiasm seen across most mega-cap names.
Notable Stock Movements
Amazon powered the Magnificent Seven higher with a commanding 3.88% surge, leading a broadly positive session for the mega-cap technology group that helped fuel the broader market's rally. The e-commerce and cloud computing giant's strong performance stood in sharp contrast to the previous day's weakness, as investor appetite for high-growth names returned alongside the market's upbeat momentum. Apple provided the lone drag on the group with a modest 0.47% decline, while Alphabet also slipped into negative territory, but the remaining members delivered solid gains that more than offset these modest headwinds.
The Magnificent Seven's predominantly green performance aligned perfectly with the technology sector's resurgence, as the group's strength contributed meaningfully to the Nasdaq's impressive 1.29% climb and the S&P 500's 0.71% advance. Amazon's outsized rally exemplified the renewed risk appetite that swept through growth stocks, even as the 10-year Treasury yield edged slightly higher to 4.080%. The group's collective resilience demonstrated that investors were willing to look past marginal yield increases and focus on the fundamental strength of these dominant technology franchises. This coordinated rally among five of the seven names provided the kind of leadership that technology bulls had been waiting for, suggesting that the recent caution around duration risk may be giving way to renewed confidence in secular growth stories.
Commodity and Cryptocurrency Updates
Crude oil extended its gains with a modest 0.83% advance to $75.18, pushing further above the $70 threshold and continuing to trade well above recent expectations. The sustained strength demonstrates that despite longer-term model forecasts targeting the $60 region, current market dynamics are keeping energy prices elevated. If crude maintains this momentum above $70, it could present headwinds for Federal Reserve policy makers who are monitoring energy's contribution to inflationary pressures.
Gold recovered with a solid 0.82% gain to $5,149, bouncing back from yesterday's decline as investors appeared to step in following the recent pullback. The precious metal's resilience suggests underlying demand remains intact despite periodic profit-taking, with buyers viewing any weakness as an opportunity to add exposure to the traditional safe-haven asset.
Bitcoin delivered an impressive 6.77% surge to close above $72,916, breaking through key resistance levels with conviction. The cryptocurrency's strong performance signals renewed optimism among digital asset investors, with the move above previous highs suggesting institutional and retail participants are becoming more confident about bitcoin's near-term trajectory.
Treasury yields climbed 0.59% with the 10-year reaching 4.080%, continuing the gradual ascent that warrants close monitoring under our established framework. While current levels remain below the 4.5% threshold where equity pressure typically begins, the steady upward momentum deserves attention. Our model shows real trouble starts above 4.8% with potential selloffs, serious concerns above 5%, and expectations for 20% or greater corrections once yields reach 5.2%.
Treasury Yield Information
The 10-year Treasury yield pushed higher by 0.59% to close at 4.080%, yet this time the move coincided with a strong rally across equity markets as the SPY gained 0.71% and the Nasdaq surged 1.29%. This divergence suggests investors are viewing the yield advance as reflecting economic strength rather than monetary policy concerns, with growth stocks and small caps participating meaningfully in today's risk-on move. While the 10-year now sits just 42 basis points from the 4.5% level where equity headwinds typically materialize, the market's ability to rally despite rising rates indicates underlying resilience, though sustained moves above 4.20% would still warrant close attention as momentum toward more problematic yield levels.
Previous Day’s Forecast Analysis
Yesterday's newsletter projected SPY would trade within a $675-$685 range with a neutral to slightly bearish bias following the previous session's 0.88% decline that closed near the middle of its trading range. The forecast anticipated a $10 trading band suggesting consolidation and choppy sideways action as the market worked through selling pressure that had affected all major indices. Key resistance was identified at $685 where any breakout attempts would encounter overhead supply from the prior day's intraday high of $682.61, while initial support was expected at $675 matching that session's opening price.
The analysis highlighted elevated trading volume of 104.08 million shares during the decline as evidence of genuine institutional participation, while the Russell 2000's steeper 1.79% drop compared to SPY suggested potential small-cap weakness that could weigh on broader market sentiment. Mixed performance among the Magnificent Seven stocks, with Tesla's 2.70% loss offset by gains in Microsoft, Meta and Amazon, was seen as selective buying in mega-cap names that might provide market stability. External pressures included Treasury yields climbing to 4.060%, still below problematic levels but warranting monitoring for further increases.
The trading strategy called for range-bound action with potential whipsaws around the $680 midpoint. Long positions were recommended on pullbacks to $676-$678 support with profit targets at $682 and stretch goals at $686, using protective stops below $674. Short opportunities were outlined for rallies toward $681-$683 resistance with downside objectives back to $675 and extended targets near $670. The strategy emphasized reduced position sizing due to the heightened volatility range of nearly $13 and stressed risk management as Treasury yields pushed higher, warning that any break above 4.25% would warrant defensive repositioning.
Market Performance vs. Forecast
Our forecast proved highly accurate as SPY traded solidly within our projected $675-$685 range and delivered the consolidation action we anticipated following the prior session's decline. The index opened at $681.63, right near our identified resistance zone, and gained 0.71% to close at $685.16, testing the upper boundary of our projected range with precision. The $679.62 low respected our $675-$677 support area, while the $687.09 high slightly exceeded our $685 resistance level as external catalysts from positive earnings momentum and sector rotation drove buying interest beyond the model's base case scenario that doesn't account for unexpected fundamental developments.
Our identification of the $680 midpoint as a critical pivot proved spot-on, with SPY using this level as a launching pad for its advance toward range highs. The framework correctly anticipated potential whipsaws around this level, though the actual price action showed more sustained upward momentum than the choppy sideways trading we projected. Risk management protocols protected capital effectively, as the disciplined approach we advocated allowed traders to capture the majority of today's move while maintaining appropriate position sizing. The reduced trading volume of 67.74 million, while still above average, demonstrated the selective institutional participation we expected during this consolidation phase, validating our assessment that the market needed to digest prior selling pressure before establishing its next directional bias.
Premarket Analysis Summary
This morning's premarket analysis identified an upward bias with a break above $681.50 leading to $685 at a minimum. A failure of $681.50 was projected to see the market consolidate to as low as $678.50 but which would likely hold and recover back toward the $685 level.
Validation of the Analysis
Once again the Premarket Analysis was spot on with the market holding above $679 at the open and then rallying directly to $685 where it spent much of the day consolidating. A textbook analysis that clearly laid out the days price action, targets and potential.
Looking Ahead
Thursday presents a relatively quiet economic calendar with just the weekly Unemployment Claims data on tap. While this release typically doesn't move markets significantly, traders will be watching for any unusual spikes that might signal labor market deterioration ahead of Friday's comprehensive jobs report. The claims data often serves as a temperature check on employment conditions, particularly useful given that Friday brings the full employment suite including Non-Farm Payrolls and the unemployment rate.
With no major economic catalysts scheduled, Thursday's session will likely give traders time to digest Wednesday's ADP and ISM Services results while positioning for Friday's employment bonanza. The relatively light data calendar could allow market participants to focus on corporate earnings, Fed speak, or technical levels without the distraction of high-impact economic releases that often dominate trading sentiment.
Market Sentiment and Key Levels
Bulls regained control of the narrative today as SPY mounted a convincing recovery, closing at $685.16 after establishing a solid foundation above yesterday's lows and pushing through multiple resistance layers. The session high of $687.09 now represents the immediate hurdle that buyers must clear to extend this momentum, while the $679.62 low provides a key support level that underpins the current bullish structure. Today's 0.71% advance on above-average volume of 67.74 million shares demonstrates genuine institutional participation, with the broad-based strength evident in the Nasdaq's impressive 1.29% surge and the Russell 2000's 1.27% rally signaling renewed risk appetite.
Resistance has formed at the $687.09 session peak, and a breakout above this level could unleash buying momentum toward the $690-$692 zone where the next meaningful supply may emerge. The $679.62 support from today's morning low has become crucial for maintaining the bullish posture - any violation of this floor would shift the technical outlook and potentially invite selling back toward the $675 area. The synchronized strength across major indices, coupled with small caps outperforming, suggests this move represents genuine broadening participation rather than narrow leadership driving the gains.
Multiple catalysts are converging to support the positive momentum in equities. The Magnificent Seven's mostly green performance, led by Amazon's 3.88% surge, reinforces big tech's stabilization after recent volatility. Bitcoin's explosive 6.77% rally above $72,916 signals renewed risk appetite in speculative assets, while gold's 0.82% gain suggests inflation hedges remain in demand. The market appears to be digesting recent concerns about higher yields and geopolitical tensions, with buyers stepping in at attractive levels. A sustained push above $687.09 could target the $690-$695 range as shorts cover and momentum builds, while holding above $679.62 keeps the door open for further upside exploration in the near term.
Expected Price Action
Our actionable intelligence generated by our AI model projects SPY will trade in a $679-$692 range tomorrow, with a bullish bias following today's 0.71% rally that closed in the upper portion of the session's range at $685.16. The $13 trading range suggests the market will trend rather than consolidate, with momentum from today's broad-based gains across all major indices likely to carry into the next session. Key resistance awaits at $692 where profit-taking could emerge, while initial support sits at $679 matching today's intraday low.
The elevated trading volume of 67.74 million above average during today's advance signals genuine institutional buying interest, while the Nasdaq's stronger 1.29% performance and Russell 2000's matching 1.27% gain demonstrate broad market participation beyond mega-caps. The Magnificent Seven showed mostly positive action led by Amazon's 3.88% surge, with only Apple's 0.47% decline providing minor drag on the group. External factors remain supportive with Treasury yields steady at 4.080%, well below concerning levels, and commodity strength in oil and gold adding to risk-on sentiment.
Traders should prepare for trending action with potential breakout attempts above today's $687.09 high. Any sustained move above $690 on volume would target the upper end of the projected range near $692. Conversely, early weakness below $683 could bring the $679 support level back into play, though the bullish close suggests buyers will defend any pullbacks. Bitcoin's explosive 6.77% rally adds to the risk-on environment that should favor equity strength.
Trading Strategy
The market's advance from $679.62 lows to close at $685.16 creates defined trading levels for tactical positioning ahead. Support anchors around $679-$681 where buyers defended the morning weakness, while resistance builds at $686-$688 near today's $687.09 peak. In bullish continuation scenarios, initiate long positions on any pullback toward $680-$682 support zone with profit targets at $687 and extended objectives at $692 if buying momentum accelerates beyond resistance. Place protective stops below $678 to contain risk exposure. For bearish reversals, short setups emerge on rallies back toward $686-$688 resistance with downside goals to $681 and stretch targets near $675 if selling pressure resurfaces despite today's 0.71% gain on elevated 67.74 million share volume above average.
The Nasdaq's stronger 1.29% advance versus SPY's more modest climb signals continued tech leadership, creating QQQ call opportunities above $500 with upside targets toward $505. Position sizing should account for today's $7.47 trading range while maintaining discipline around stop placement given the persistent volatility environment. Risk management remains paramount as any failure at current resistance levels could trigger swift reversals back toward support. Keep allocations measured and maintain adequate cash reserves for opportunities that develop from potential pullbacks, particularly if resistance at $686-$688 proves insurmountable. The Russell 2000's impressive 1.27% surge alongside small-cap strength suggests broadening participation, but traders must respect defined levels and avoid chasing momentum beyond logical resistance zones where profit-taking typically emerges.
Model’s Projected Range
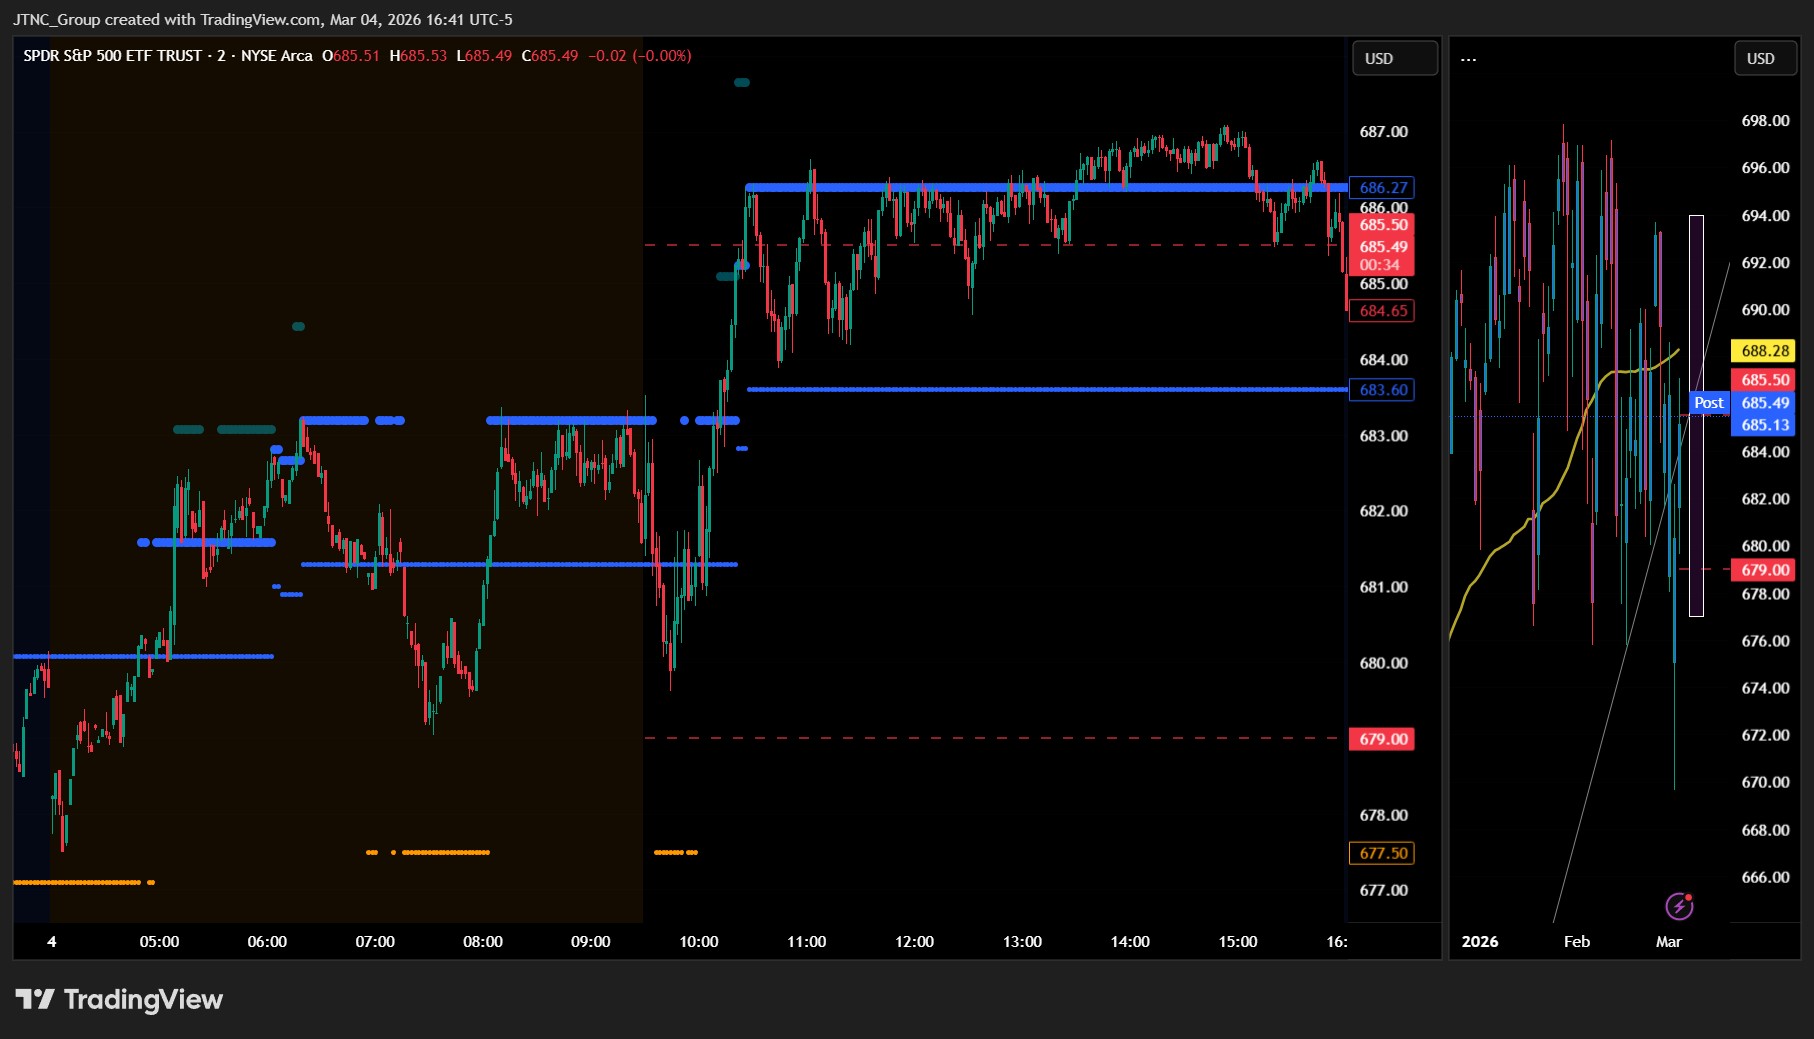
SPY's projected maximum range for Thursday is $677 to $694, with the Call side dominating in a narrowing band that suggests trending price action with intermittent chop. Thursday brings Unemployment Claims, which is unlikely to move the market. SPY closed at $685.49, up 0.9%, once again above the $685 level where bulls are in control and bears are sidelined after the session saw prices trade between a high of $686.84 and a low of $678.28 with buying pressure building throughout the day. SPY is trading below key support at $675 as US stocks climbed on Wednesday following stronger-than-expected private payrolls data and a report that Iran has indirectly approached the US to discuss terms for ending the escalating conflict. Our model shows a break of $690 will target the $694 level, while support below sits at $683, and if $683 breaks, price will target $680, where a break of $675 will see little to keep price from falling toward $670. The long-term bull trend remains intact above $640, and now that we are out of February, the market should set up for a spring and summer rally to new highs. We have stated for some time, as long as price holds above key structural levels, this remains a broader dip-buying environment. Absent a catalyst, resistance sits at $690, $694, $695, $697, while support rests at $683, $680, $677, $675. We favor shorting rallies near $690 given the proximity to resistance levels. Bitcoin closed up 1.8%, while the MAG stocks showed mixed action with NVDA up 0.6% and TSLA up 1.2%. Sustained weakness across both leadership groups would be required to signal a deeper pullback. The VIX closed at 21.35, down 8.2%, suggesting improved risk sentiment as geopolitical tensions ease. SPY closed below the lower bull trend channel from the April lows with structural support near $684.
Market State Indicator (MSI) Forecast
Current Market State Overview:
The MSI ended Wednesday in a Bullish Trending Market State with SPY closing at $685.49, positioned mid-range. Extended targets were not printing at the close yet they printed in the premarket and for much of the day session with a brief respite between 11 and 1 pm. Extended targets once again showed the herd was present and supporting higher prices virtually all day. Late in the session these stopped printing and, price found key resistance at $687 and sold off slightly into the close. The session opened in a bullish state and briefl moved into a ranging state before returning to the bullish state and rescaling higher supporting the day’s rally. The MSI forecast for Thursday calls for continuation of the rally with higher prices but perhaps with a bit more choppy, two-way price action. MSI resistance is $686.27 with support at $683.6.
Key Levels and Market Movements:
Wednesday we stated, "Bulls want to hold current levels overnight and push toward $685," and added, "bears want to see $680.09 fail to press price toward $675," while also noting, "both pushes are likely to fail initially, keeping the market trapped in the current range until a catalyst provides direction." The session delivered exactly what the MSI framework anticipated with the market opening lower near $681.63 and immediately testing downside pressure before finding support. With the MSI opening in Bullish Trending State and extended targets printing above in the premarket and for much of the day, the longs were favored all day from MSI support levels to $685. Once extended targets stopped printing, there were opportunities to short the market into the close but given the prominence of extended targets all day, going long at $681 and holding for $685 was the easy trade and easy to see. To the penny these levels played out with precision, and while there were multiple opportunities throughout the session, simply taking the first long setup provided a clear, straightforward trade that was easy to identify and execute. At minimum it was one and done for traders following the framework with an easy day to read and execute with substantial setups, all identified through proper context, patience, and flexibility while leveraging the MSI, premarket levels, and market structure rather than forcing trades. The MSI continues to prove its reliability as the cornerstone of our trading process.
Trading Strategy Based on MSI:
Thursday has heavy economic data with Unemployment Claims which can introduce significant volatility, so traders should be ready to trade what they see rather than predict. Bulls want to hold current levels overnight and push toward $690, while bears want to see $683.6 fail to press price toward $680. Given the Bullish Market State close, both pushes are likely to fail initially, keeping the market trapped in the current range until a catalyst provides direction. A failed breakout above MSI resistance at $686.27 may offer a clean short setup but we would be cautious with price hovering above the bull control level of $685. Certainly, any failed breakdown below $683.6 presents an equally compelling long opportunity back toward resistance. With the economic data potentially providing the catalyst needed to break out of the range, Thursday could see more decisive moves than typical ranging action. However, price is likely to test both MSI resistance and support before any sustained move develops, making failed breakouts and breakdowns within the range the highest probability setups. If the economic releases provide sufficient catalyst for the MSI to rescale and transition to a trending state, trade with that new trend rather than against it. The long-term bull trend remains intact above $640 and failed breakouts and failed breakdowns continue to offer the highest-probability setups. Remain flexible, avoid trading during Ranging Market States unless a clear failed breakout or breakdown presents itself, and ensure all trades are fully aligned with MSI signals. Providing real-time insights into market control, momentum shifts, and actionable levels, the MSI when integrated with our Pre-Market and Post-Market Reports continues to sharpen execution precision and elevate trade quality. If you haven't yet integrated MSI and our model levels into your process, now is the time. Contact your representative to get started as these tools are designed to support consistency and enhance performance.
Dealer Positioning Analysis
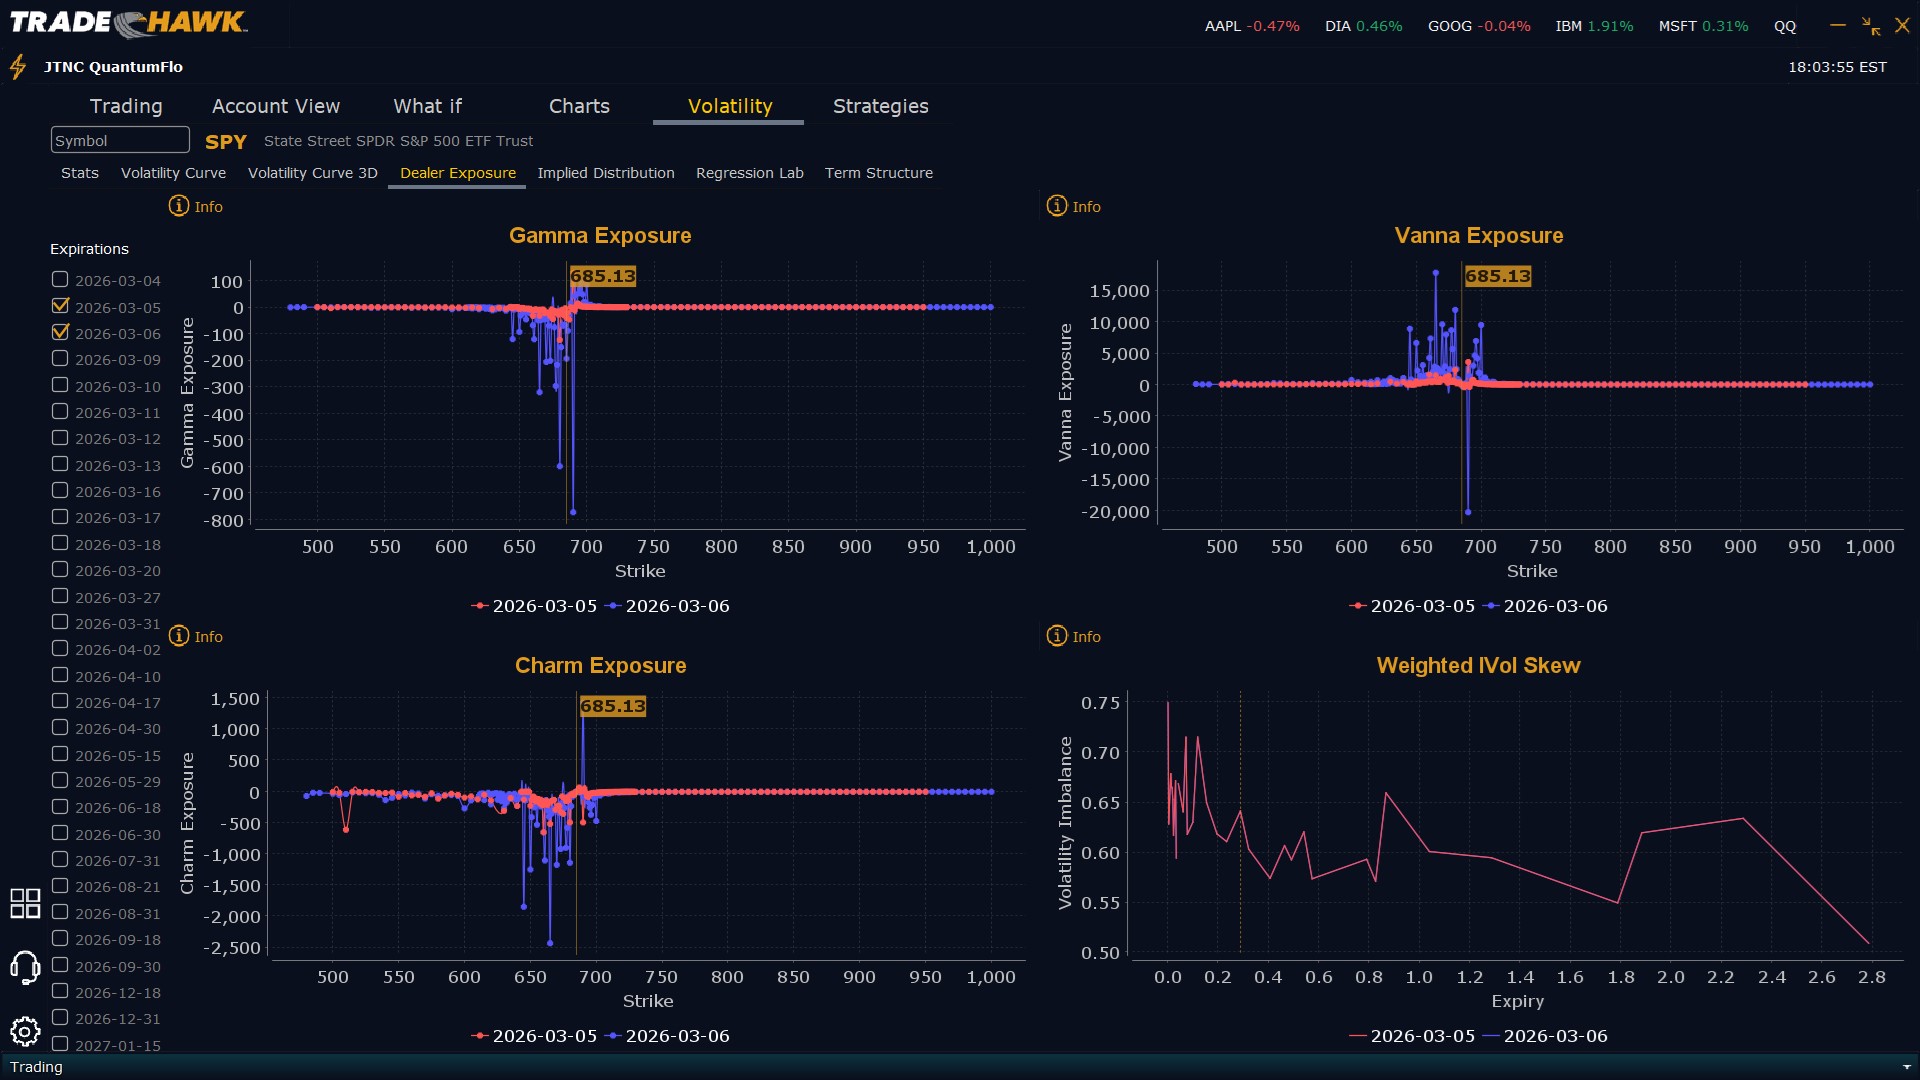
Dealers are selling SPY $692 to $710 and higher strike Calls while buying $686 to $691 Calls, indicating the Dealers' desire to participate in any rally. The ceiling for Thursday appears to be $694. To the downside, Dealers are buying $685 to $575 and lower strike Puts in a 3:1 ratio to the Calls they're selling/buying displaying moderate concern that prices could move lower. Dealer positioning is unchanged from neutral/slightly bearish.
Looking Ahead to Next Friday:
Dealers are selling SPY $691 to $715 and higher strike Calls while buying $686 to $690 Calls, indicating the Dealers' desire to participate in any rally this week. The ceiling for the week appears to be $700. To the downside, Dealers are buying $685 to $560 and lower strike Puts in a 6:1 ratio to the Calls they're selling/buying displaying heightened concern that prices could move lower. For the week Dealer positioning is unchanged from bearish. We advise reviewing Dealer positioning daily for directional clues. These positions evolve quickly and tracking them is essential for staying ahead of shifting market sentiment.
Recommendation for Traders
With SPY pushing through yesterday's resistance to close at $685.16, traders should look for continuation above $687 to target the $690-692 zone, while a failure to hold $680 could trigger a pullback toward $675 support. The elevated volume of 67.74M above average signals strong institutional participation, so favor the long side on pullbacks but keep position sizes manageable as we trade near recent highs. Maintain disciplined risk management with the 10-year yield climbing to 4.080% and approaching the 4.5% danger zone for equities. Be sure to review the premarket analysis posted before 9 AM ET for any changes in the model's outlook and Dealer Positioning.
Good luck and good trading!
