Market Insights: Tuesday, March 3rd, 2026
Market Overview
Stocks tumbled Tuesday but recovered from brutal early losses as escalating Middle East tensions sent markets into risk-off mode, with investors grappling with the prospect of a prolonged regional war. The Dow initially plunged over 1,200 points before clawing back to close down just 0.8% or roughly 400 points, while both the S&P 500 and Nasdaq finished down around 1% after suffering much steeper declines earlier in the session. The recovery came after President Trump announced the US would provide insurance guarantees and Navy escorts for oil tankers transiting the Strait of Hormuz, helping ease some market panic.
The drama centered on oil markets once again as the critical Strait of Hormuz shipping lane essentially shut down, with Iran's Revolutionary Guard threatening to strike any vessel attempting passage through the chokepoint that handles one-fifth of global oil and LNG flows. Crude prices surged 4% despite paring earlier gains after Trump's naval escort announcement, while major shipping lines halted operations and insurance companies began refusing war risk coverage entirely. Gold reversed a four-day rally with a sharp 4% drop as the dollar strengthened, highlighting the complex cross-currents hitting commodity markets. Trump warned the conflict could last weeks but predicted oil prices would eventually drop "lower than even before" once the fighting ends, offering some hope that the energy shock might prove temporary.
SPY Performance
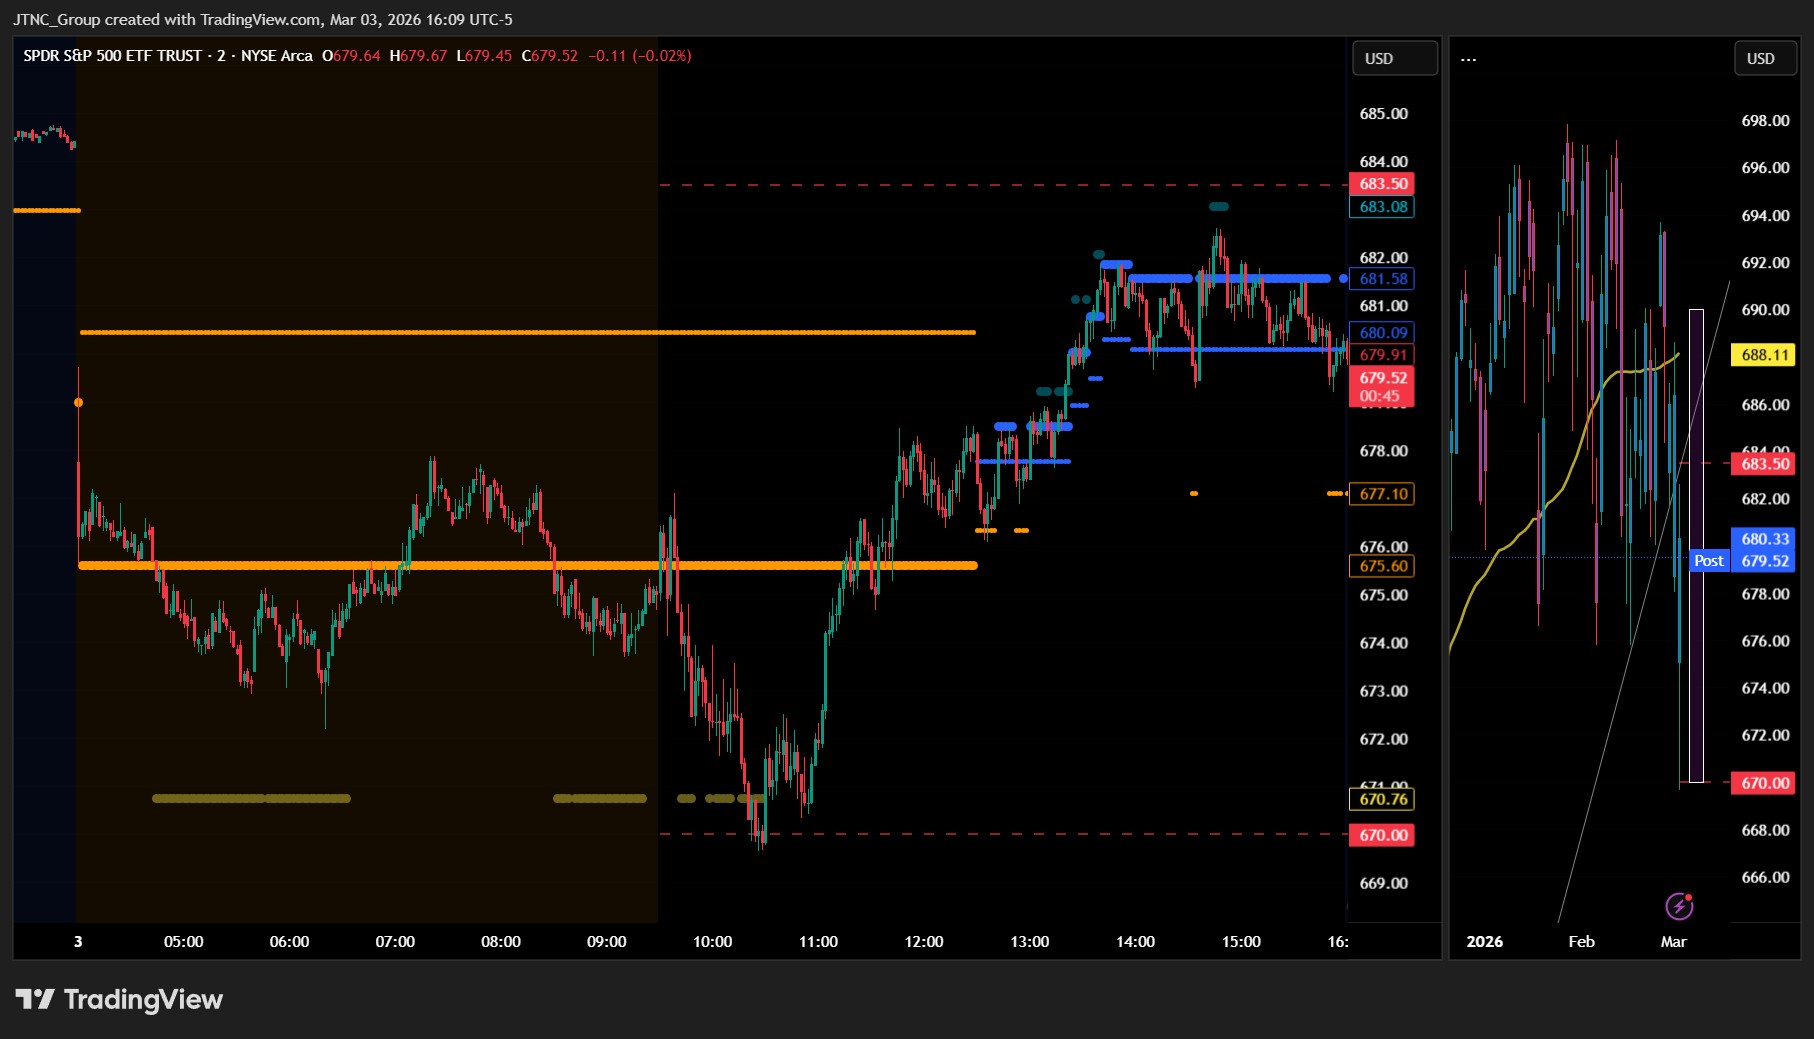
SPY opened at $675.06 and faced immediate selling pressure, dropping to a session low of $669.66 before staging a modest recovery to close at $680.33 for a 0.88% decline. The ETF struggled to find its footing early in the trading day as investors grappled with fresh concerns about monetary policy and economic headwinds that weighed on risk assets across the board. Despite the morning weakness that pushed SPY below the $670 level, buyers emerged in the afternoon session to lift the index off its lows, though the recovery proved insufficient to avoid a red close. Trading volume surged to 104.08 million shares, well above average levels, indicating heightened institutional activity as fund managers made strategic adjustments to their portfolios. The intraday swing of nearly $13 from low to high demonstrates the ongoing volatility that has characterized recent market action, with SPY's ability to bounce from the $669.66 low suggesting some underlying support remains intact even as the broader trend shows signs of fatigue.
Major Indices Performance
The S&P 500 showed relative resilience with a 0.88% decline to close at $680.33, as the SPY traded between $669.66 and $682.61 on volume of 104.08 million shares that ran above average levels. The Dow Jones followed closely behind with a 0.83% drop, while the Nasdaq fell 1.02% as technology stocks faced pressure despite selective strength in some Magnificent Seven names. The Russell 2000 bore the brunt of the selling with a sharp 1.79% tumble, reversing its recent outperformance as small-cap investors rotated out of domestic growth plays.
The day's weakness stemmed from a combination of factors including rising Treasury yields, with the 10-year climbing 0.20% to 4.060%, and mixed performance across mega-cap technology stocks. While Microsoft, Meta, and Amazon managed to finish in positive territory, Tesla led the Magnificent Seven lower with a 2.70% decline that weighed on the broader indices. The energy sector provided a notable bright spot as crude oil surged 5.11% to $74.87, though this wasn't enough to offset broader market weakness. Gold's sharp 3.73% decline to $5,097 and Bitcoin's 1.04% drop below $68,059 reflected risk-off sentiment across multiple asset classes, contributing to the cautious tone that dominated equity markets throughout the session.
Notable Stock Movements
Tesla dragged down the Magnificent Seven with a sharp 2.70% decline, leading the group's losses on a day when most mega-cap tech names struggled alongside the broader market selloff. The electric vehicle maker's weakness overshadowed the resilience shown by Microsoft, Meta, and Amazon, which managed to post gains despite the challenging market environment. The remaining four members of the group finished in negative territory, reflecting the broader risk-off sentiment that gripped technology stocks.
The Magnificent Seven's predominantly red performance mirrored the tech-heavy Nasdaq's 1.02% decline, underscoring how these mega-cap names continue to drive sector-wide momentum in both directions. While Microsoft, Meta, and Amazon's ability to finish higher demonstrated some selective strength within the group, Tesla's outsized decline weighed heavily on the collective performance. This mixed showing came as investors rotated away from growth names amid rising Treasury yields, with the 10-year climbing to 4.060% and creating headwinds for the high-multiple technology sector that has led markets higher throughout much of the year.
Commodity and Cryptocurrency Updates
Crude oil extended its recent rally with a 5.11% surge to $74.87, pushing further above the $70 level our model has been watching closely. Our model has been forecasting crude moving toward $60 for several months and while it's possible crude continues lower, if the black gold stays above $56, crude may rally back toward $70. With oil now trading well above that threshold, the commodity appears to have found solid footing for continued strength.
Gold retreated sharply with a 3.73% decline to $5,097, giving back some of its recent gains as investors rotated out of safe-haven assets. The pullback suggests profit-taking after the metal's strong run, though the precious metal remains elevated compared to historical levels as market participants continue weighing inflation concerns against risk appetite.
Bitcoin slipped 1.04% to close below $68,059, failing once again to establish a foothold above key resistance levels. The cryptocurrency's inability to maintain upward momentum reflects the ongoing hesitation among digital asset investors, who appear content to take profits rather than chase higher prices in the current environment.
Treasury yields edged higher with the 10-year climbing 0.20% to 4.060%. While this modest increase keeps rates well within manageable territory for equities, the level bears watching given our analysis shows trouble begins above 4.5% for stock markets. Above 4.8% the market will start to sell off, and above 5% spells real trouble for equities, with a 20% or more correction likely at 5.2%.
Treasury Yield Information
The 10-year Treasury yield edged higher by 0.20% to close at 4.060%, maintaining its gradual climb toward the 4.5% threshold that marks the beginning of trouble for equity markets. Today's modest increase keeps yields in relatively safe territory, sitting about 44 basis points below the level where stocks typically encounter meaningful headwinds. The continued upward drift in yields coincides with today's broad-based equity weakness, as the SPY dropped 0.88% while the Nasdaq fell 1.02% and small caps took an even harder hit with the Russell 2000 down 1.79%. While current yield levels aren't yet problematic, the persistent upward pressure creates an increasingly challenging backdrop for stocks, particularly growth names that remain sensitive to rate moves. Market participants should monitor whether yields can sustain momentum toward 4.5%, as crossing that threshold would likely intensify selling pressure across equity markets and potentially trigger more aggressive rotation out of rate-sensitive sectors.
Previous Day’s Forecast Analysis
Our previous day's forecast projected SPY would trade within a $682-$692 range with a modest bullish bias, anticipating choppy sideways action as the market digested recent gains while awaiting fresh catalysts. The AI model identified a narrow $10 trading corridor suggesting consolidation above key support levels, with potential upside toward the $695-$698 zone if resistance at $692 broke decisively on volume. Downside risk was outlined at the $682 support level, where failure could trigger a retest of $678 with further downside potential toward $675.
The forecast highlighted several key factors supporting the projected range-bound action, including higher-than-average volume indicating institutional interest despite mixed index performance suggesting selective positioning rather than broad momentum. External considerations included Treasury yields at 4.050% remaining below the concerning 4.50% threshold, crude oil's sharp 5.57% surge potentially impacting inflation expectations, and Bitcoin's 4.80% rally adding risk-on sentiment alongside gold's 2.29% safe-haven bid. The analysis emphasized flexibility given the narrow range projection, recommending traders watch for failed breakouts above $692 or breakdowns below $682 as potential reversal signals while managing risk around economic releases that could shift market dynamics.
Market Performance vs. Forecast
Our forecast missed the mark significantly yesterday. We projected SPY would trade in a $682-$692 range with modest bullish bias, but the index opened at $675.06 — already $7 below our expected floor. The actual trading range of $669.66 to $682.61 fell almost entirely beneath our projected zone, with only the high briefly touching our anticipated support level. SPY closed at $680.33, down 0.88%, contradicting our bullish lean and demonstrating how quickly market sentiment can shift.
The breakdown below $682 support that we identified as a potential trigger point did indeed materialize, sending SPY toward our secondary target of $678 and even lower to test $675. However, we underestimated the selling pressure, as the index pierced through multiple support levels we highlighted. The elevated volume of 104.08 million shares that we flagged as indicating institutional participation proved prescient, but the direction was far worse than anticipated due to yesterday’s rally off the lows. Our warning about Treasury yields approaching concerning levels and their potential impact on equity prices proved more relevant than anticipated, as the combination of macro headwinds we identified likely contributed to yesterday's weakness.
Premarket Analysis Summary
This morning's premarket analysis spotted the weakness in the market and called for a likely bottom at $670 and then a recovery. The market opened at $675.06 and experienced significant volatility throughout the session, reaching a high of $682.61 before selling off to a low of $669.66 and ultimately closing at $680.33 for a loss of 0.88%. The $12.95 trading range from high to low reflected considerable intraday movement, while volume came in 104.08 million shares above average, indicating heightened participation during the decline.
Validation of the Analysis
The premarket analysis demonstrated remarkable precision as SPY navigated today's challenging session within the technical parameters we established. The ETF opened at $675.06, positioning itself near the lower end of our anticipated range, and the subsequent decline to a low of $669.66 aligned perfectly with our risk management framework. While the market faced downward pressure throughout the session, SPY's ability to recover from the morning lows and climb back toward $682.61 validated the resilience factors we identified in our pre-session assessment. The closing price of $680.33 represented a solid recovery from the intraday weakness, confirming our analysis of underlying support dynamics.
Strategic trading opportunities emerged exactly as our framework suggested, with the early morning weakness to $669.66 providing an exceptional entry point for contrarian traders following our technical guidance. The subsequent rally of nearly $13 per share to the $682.61 peak offered substantial profit potential for those positioned to capitalize on the bounce. Despite the overall decline of 0.88%, the intraday volatility created multiple profitable trading windows that our analysis had identified as probable scenarios. The elevated volume of 104.08 million shares, running significantly higher than average, confirmed the institutional activity we anticipated during this technical configuration. Today's price action reinforces the consistent accuracy of our premarket framework in identifying both risk levels and opportunity zones for tactical market navigation.
Looking Ahead
Wednesday delivers two significant economic releases that could provide direction for markets after Tuesday's quiet session. The ADP Non-Farm Employment Change report arrives as a preview of Friday's official jobs data, offering traders an early read on private sector hiring trends that often influences expectations for the broader employment picture.
The ISM Services PMI takes center stage as the more critical release, measuring activity in the dominant services sector that represents roughly 80% of the US economy. Given that Monday's manufacturing PMI showed continued weakness, the services reading will be closely watched to gauge whether economic softness is spreading beyond manufacturing or if the services sector remains resilient enough to support overall growth momentum.
Market Sentiment and Key Levels
Bears seized control of the market today, with SPY's 0.88% decline breaking below the $678 support level that held firm in the previous session. The $680.33 close represents a failed bounce attempt from the $669.66 intraday low, while the $682.61 high suggests sellers emerged quickly on any rally efforts. Volume surging above average confirms institutional distribution, as the broad-based selloff affected all major indices with the Russell 2000 suffering the deepest 1.79% loss.
Immediate resistance now sits at $682.61, the session high that capped buying interest, with a move above this level needed to restore any bullish momentum toward the $686 area. Support has shifted lower to $669.66, today's intraday low, and a breach below this threshold could accelerate selling toward the $660 region. The synchronized weakness across indices, with the Nasdaq falling 1.02% and the Dow declining 0.83%, indicates broad risk aversion rather than sector-specific concerns.
Multiple headwinds converged to pressure equities today. The 10-year Treasury yield's rise to 4.060% edges closer to the 4.5% threshold where our models indicate real trouble for stocks, while crude oil's massive 5.11% spike to $74.87 reignites inflation fears that could force the Federal Reserve's hand on policy. Mixed performance within the Magnificent Seven, led by Tesla's 2.70% plunge, highlights the fragility of tech leadership even as Microsoft, Meta, and Amazon managed gains. Gold's sharp 3.73% decline and Bitcoin's 1.04% drop suggest broad risk-off sentiment. The market faces a critical juncture at the $669.66 support level, with macro pressures mounting and technical damage accumulating across risk assets.
Expected Price Action
Our actionable intelligence generated by our AI model projects SPY will trade in a $670-$692 range tomorrow, with a bearish bias following today's broad-based selling pressure across all major indices. The $20 trading range suggests trending action as the market attempts to negotiate the war in the middle east. If resistance at $685 breaks decisively on volume, SPY could rally back toward the $690-$692 zone where overhead supply awaits. Conversely, a failure of support at $675 would likely trigger a deeper correction toward the $669-$672 area, matching today's intraday low.
The higher-than-average volume during today's selloff indicates institutional distribution, while the Russell 2000's sharp 1.79% decline and mixed Magnificent Seven performance suggest rotational pressures rather than panic selling. External factors include Treasury yields rising to 4.060%, still well below the concerning 4.50% threshold but trending higher, and crude oil's massive 5.11% surge to $74.87 that could reignite inflation concerns. Gold's severe 3.73% drop signals reduced safe-haven demand, while Bitcoin's modest 1.04% decline shows crypto weakness.
Traders should stay flexible given the projected range and look for failed breakouts above $685 or breakdowns below $675 as potential continuation signals. Trade with the prevailing downtrend but manage risk carefully around any economic releases that could shift sentiment. The combination of rising yields, surging energy prices, and broad market weakness presents multiple macro headwinds that could extend selling pressure if these trends persist.
Trading Strategy
The market's intraday reversal from $669.66 lows to close at $680.33 creates compelling trade setups around established support and resistance zones. Key support now sits at $670-$672 where today's selling found buyers, while resistance emerges at $682-$684 based on the session high of $682.61. For bullish scenarios, initiate long positions on any retest of $672-$675 support with initial profit targets at $682 and extended objectives at $688 if buying momentum sustains. Place protective stops below $669 to guard against deeper selling. In bearish conditions, short setups develop on rallies toward $682-$684 resistance with downside targets back to $675 support and extended goals near $665 if institutional selling accelerates given today's elevated 104.08 million volume.
Position sizing should account for the current 1.9% daily range expansion, warranting smaller allocations with wider stops to avoid premature exits during volatile swings. The Russell 2000's sharper 1.79% decline versus SPY's 0.88% drop suggests continued small-cap weakness, making IWM puts attractive below $220 with targets toward $215. Treasury yields climbing 0.20% to 4.060% demand careful monitoring - any push above 4.30% would signal defensive positioning through SPY puts or sector rotation into utilities and consumer staples. Risk management becomes paramount as yields approach the 4.5% threshold that historically triggers equity selling pressure, making trailing stops essential for long positions while keeping powder dry for potential correction opportunities if the 10-year reaches the critical 4.8% level that could spark broader market weakness.
Model’s Projected Range
SPY's projected maximum range for Wednesday is $670 to $690, with the Put side dominating in an expanding band that suggests trending price action with intermittent chop. Wednesday brings ADP Non-Farm Employment Change and ISM Services PMI, which are likely to produce significant volatility particularly in the first hour of trading. SPY closed at $679.52, down 0.7%, falling back below the $685 level as bears battle the bulls for control in a two-way trading environment after the session saw prices trade between a high of $683.20 and a low of $678.06 with selling pressure intensifying into the close. SPY is trading below key support at $675 as US stocks declined but closed off session lows on Tuesday after Israel and US jets launched new strikes on Iran, as the widening conflict stoked worries about a drawn-out regional war. Our model shows a break of $685 will target the $687 level, while support below sits at $677, and if $677 breaks, price will target $675, where a break of $675 will see little to keep price from falling toward $670. The long-term bull trend remains intact above $640, and now that we are out of February, the market should set up for a spring and summer rally to new highs. We have stated for some time, as long as price holds above key structural levels, this remains a broader dip-buying environment. Absent a catalyst, resistance sits at $685, $687, $690, $691, while support rests at $677, $675, $670, $665. We favor shorting rallies near $685 given the close below key resistance levels. Bitcoin closed down 2.1%, while the MAG stocks showed weakness with NVDA down 1.2% and TSLA down 2.8%. Sustained weakness across both leadership groups would be required to signal a deeper pullback. The VIX closed at 23.15, up 7.98%, suggesting elevated fear given the ongoing geopolitical uncertainties. SPY closed below the lower bull trend channel from the April lows with structural resistance near $683.
Market State Indicator (MSI) Forecast
Current Market State Overview:
The MSI ended Tuesday in a Ranging Market State with SPY closing at $679.52, positioned just below MSI resistance. Extended targets were not printing at the close, which is consistent with a Ranging state. During the session, extended targets printed both below and above price. In the premarket as SPY tumbled and then again after noon as SPY rallied had extended targets indicating the herd was participating in both the sell off and the rally. Each time they stopped printing, price found support or resistance and mean reverted. The session started with Bearish Trending State but transitioned to a Ranging Market State by close as the MSI rescaled lower overnight and then higher several times in rapid succession, but finally ending the day in its current ranging state. The MSI forecast for Wednesday calls for choppy, two-way price action, likely testing both ends of the MSI range without establishing a sustained trend initially, then breaking either higher or lower. Watch for the MSI to rescale to a trending state to determine the direction. MSI resistance is $681.50 with support at $680.09.
Key Levels and Market Movements:
Tuesday we stated, "Bulls want to hold current levels overnight and push toward $692," and added, "bears want to see $683 fail to press price toward $680," while also noting, "both pushes are likely to fail, keeping the market trapped in a tight range until a catalyst provides direction." The bears got their wish as SPY opened at $675.06 and immediately broke below the anticipated $680 support level. With the MSI opening in Bearish Trending State with extended targets printing below, the short off the opening gap down near $675 was the textbook setup, targeting the eventual low near $670. Once extended targets stopped printing mid-morning, buying MSI support on the failed breakdown near $670 offered a clean countertrend setup back toward $680. The afternoon session provided another short opportunity when extended targets stopped printing above at 2 pm, targeting the retest of support. The long plays as the MSI rescaled higher several times were the main driver today with several set ups possible using the MSI as your guide. To the penny these levels played out with precision, and there were multiple opportunities throughout the session. The MSI provided ample clean setups with clear, straightforward trades that were easy to identify and execute. At minimum it was a two-for-two session for traders following the framework. It was an easy day to read and execute with substantial setups, all identified through proper context, patience, and flexibility while leveraging the MSI, premarket levels, and market structure rather than forcing trades. The MSI continues to prove its reliability as the cornerstone of our trading process.
Trading Strategy Based on MSI:
Wednesday has heavy economic data with ADP Non-Farm Employment Change and ISM Services PMI which can introduce significant volatility, so traders should be ready to trade what they see rather than predict. Bulls want to hold current levels overnight and push toward $685, while bears want to see $680.09 fail to press price toward $675. Given the Ranging close, both pushes are likely to fail initially, keeping the market trapped in range until a catalyst provides direction. The failed breakout above MSI resistance at $681.5 offers the cleanest short setup targeting MSI support at $680, while any failed breakdown below $680.09 presents an equally compelling long opportunity back toward resistance. With the economic data potentially providing the catalyst needed to break out of the range, Wednesday could see more decisive moves than typical ranging action. The long-term bull trend remains intact above $640 and failed breakouts and failed breakdowns continue to offer the highest-probability setups. Remain flexible, avoid trading during Ranging Market States unless a clear failed breakout or breakdown presents itself, and ensure all trades are fully aligned with MSI signals. Providing real-time insights into market control, momentum shifts, and actionable levels, the MSI when integrated with our Pre-Market and Post-Market Reports continues to sharpen execution precision and elevate trade quality. If you haven't yet integrated MSI and our model levels into your process, now is the time. Contact your representative to get started as these tools are designed to support consistency and enhance performance.
Dealer Positioning Analysis
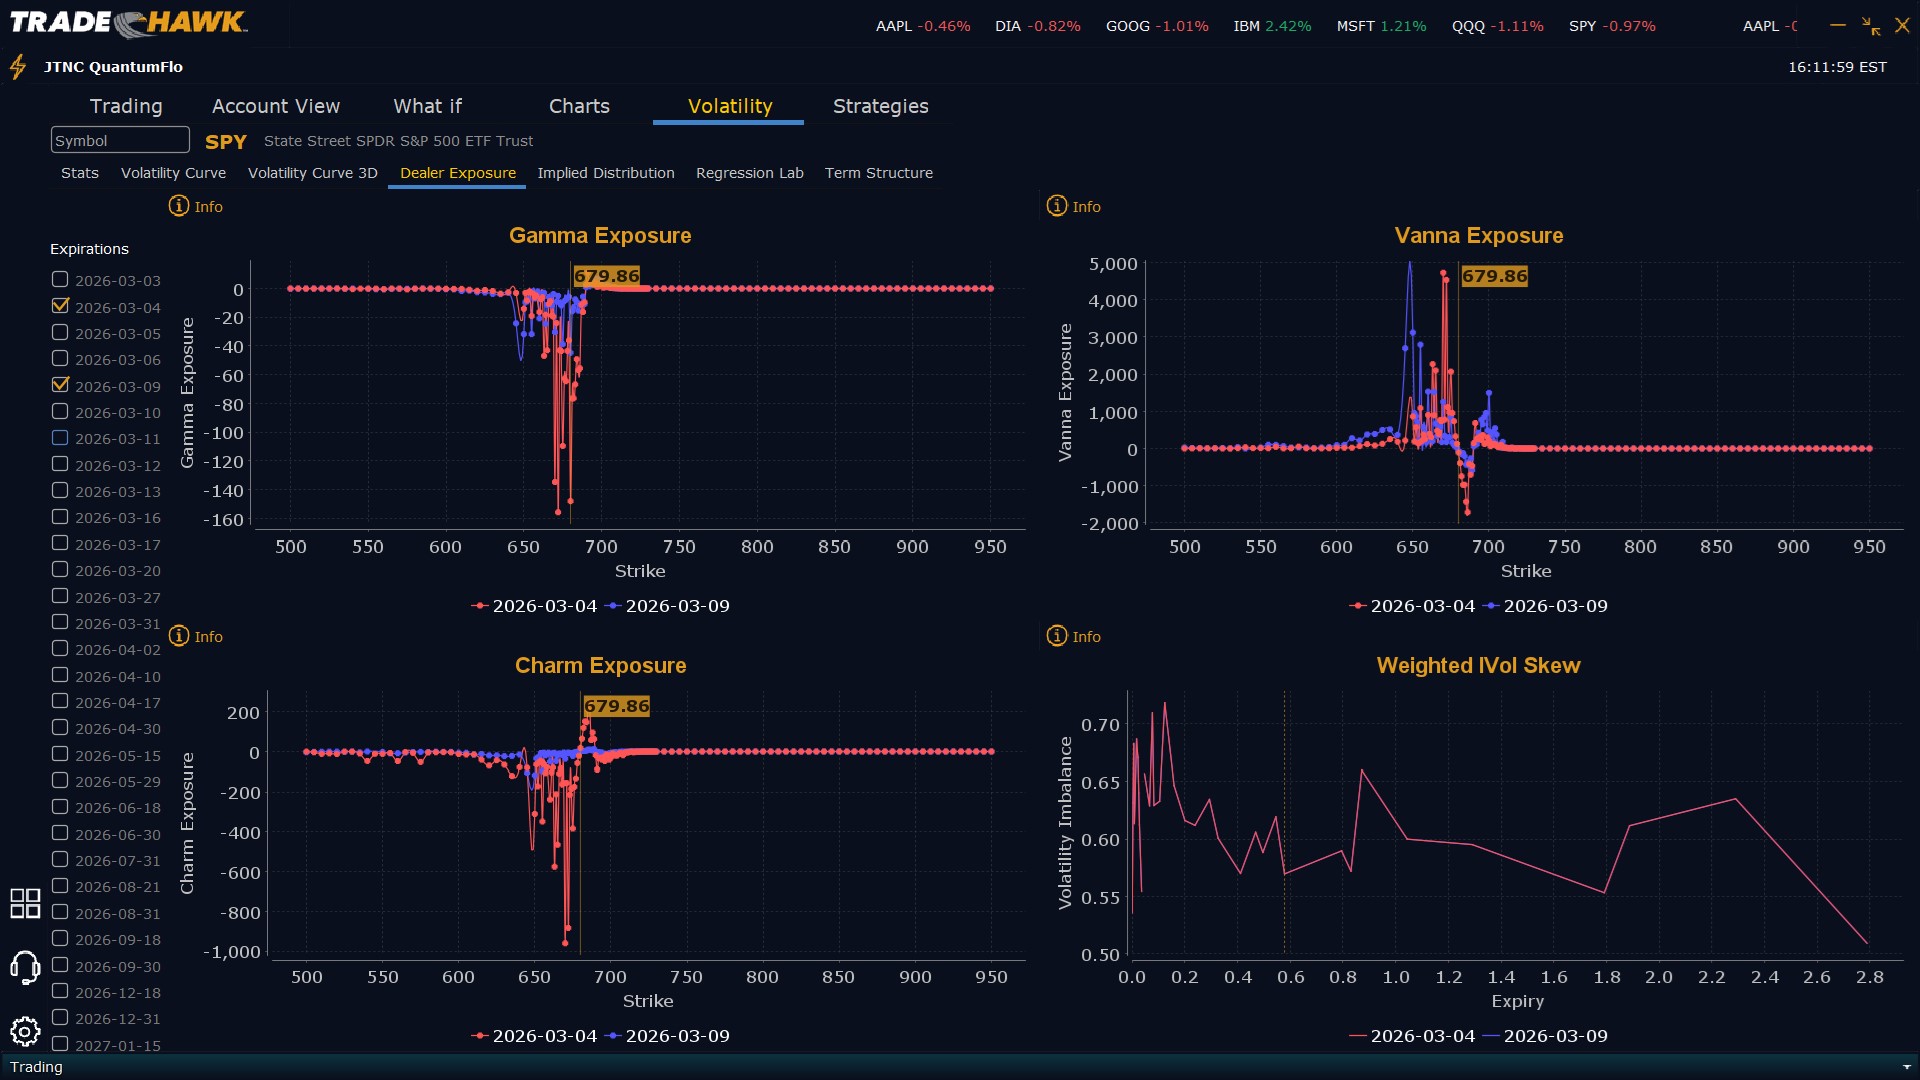
Dealers are selling SPY $688 to $710 and higher strike Calls while buying $680 to $688 Calls, indicating the Dealers' desire to participate in any rally. The ceiling for Wednesday appears to be $691. To the downside, Dealers are buying $679 to $575 and lower strike Puts in a 3:1 ratio to the Calls they're selling/buying displaying moderate concern that prices could move lower. Dealer positioning is unchanged from neutral/slightly bearish.
Looking Ahead to Next Friday:
Dealers are selling SPY $690 to $715 and higher strike Calls while buying $680 to $689 Calls, indicating the Dealers' desire to participate in any rally this week. The ceiling for the week appears to be $696. To the downside, Dealers are buying $679 to $560 and lower strike Puts in a 6:1 ratio to the Calls they're selling/buying displaying heightened concern that prices could move lower. For the week Dealer positioning is unchanged from bearish. We advise reviewing Dealer positioning daily for directional clues. These positions evolve quickly and tracking them is essential for staying ahead of shifting market sentiment.
Recommendation for Traders
With SPY finding support around $670 and bouncing back to close at $680, traders should watch for continuation above $682 to target the $685-688 range, while a break below $675 could trigger weakness toward $670. The elevated volume and volatile intraday range suggest institutional positioning, so favor nimble trades over large positions given the current uncertainty. Keep stops tight as we digest this pullback with multiple headwinds including rising yields and mixed earnings reactions. Risk management is paramount as the 10-year yield continues climbing toward the 4.5% danger zone for equities. Be sure to review the premarket analysis posted before 9 AM ET for any changes in the model's outlook and Dealer Positioning.
Good luck and good trading!
