Market Insights: Tuesday, March 31st, 2026
Market Overview
US stocks surged Tuesday on hopes that the devastating Middle East conflict could finally be winding down, with the S&P 500 jumping 2.9%, the Dow gaining over 1,000 points, and the Nasdaq leading the charge with a 3.8% rally. The massive rally came after Iranian President Masoud Pezeshkian signaled his regime's willingness to negotiate an end to the war, telling EU officials that Iran has "the necessary will to end this war" while seeking security guarantees. Adding fuel to the optimism, President Trump reportedly told administration officials he'd be willing to end the conflict without fully reopening the Strait of Hormuz and suggested the war won't last "much longer."
Oil prices collapsed on the diplomatic breakthrough, with Brent crude plunging 2.8% to around $104 per barrel and West Texas Intermediate falling 1% to $102, though US gas prices still crossed the $4 per gallon threshold nationally. Megacap tech stocks led the charge higher as growth names benefited from falling energy costs, with Nvidia surging over 5%, Microsoft up 3%, and Meta jumping 6%. Gold also bounced nearly 3% to hover near $4,670 per ounce after taking a brutal beating throughout the conflict.
Despite Tuesday's explosive rally putting major indices on pace for their best day since May 2025, the gains came on the final day of a punishing month and quarter that saw the S&P 500 post its worst quarter since 2022 and the Dow snap a 10-month winning streak. Multiple sectors including consumer staples, industrials, healthcare, materials, and real estate logged their worst monthly performances in years, suggesting Tuesday's move may be more about month-end rebalancing than a genuine trend change as markets remain hostage to geopolitical developments.
SPY Performance
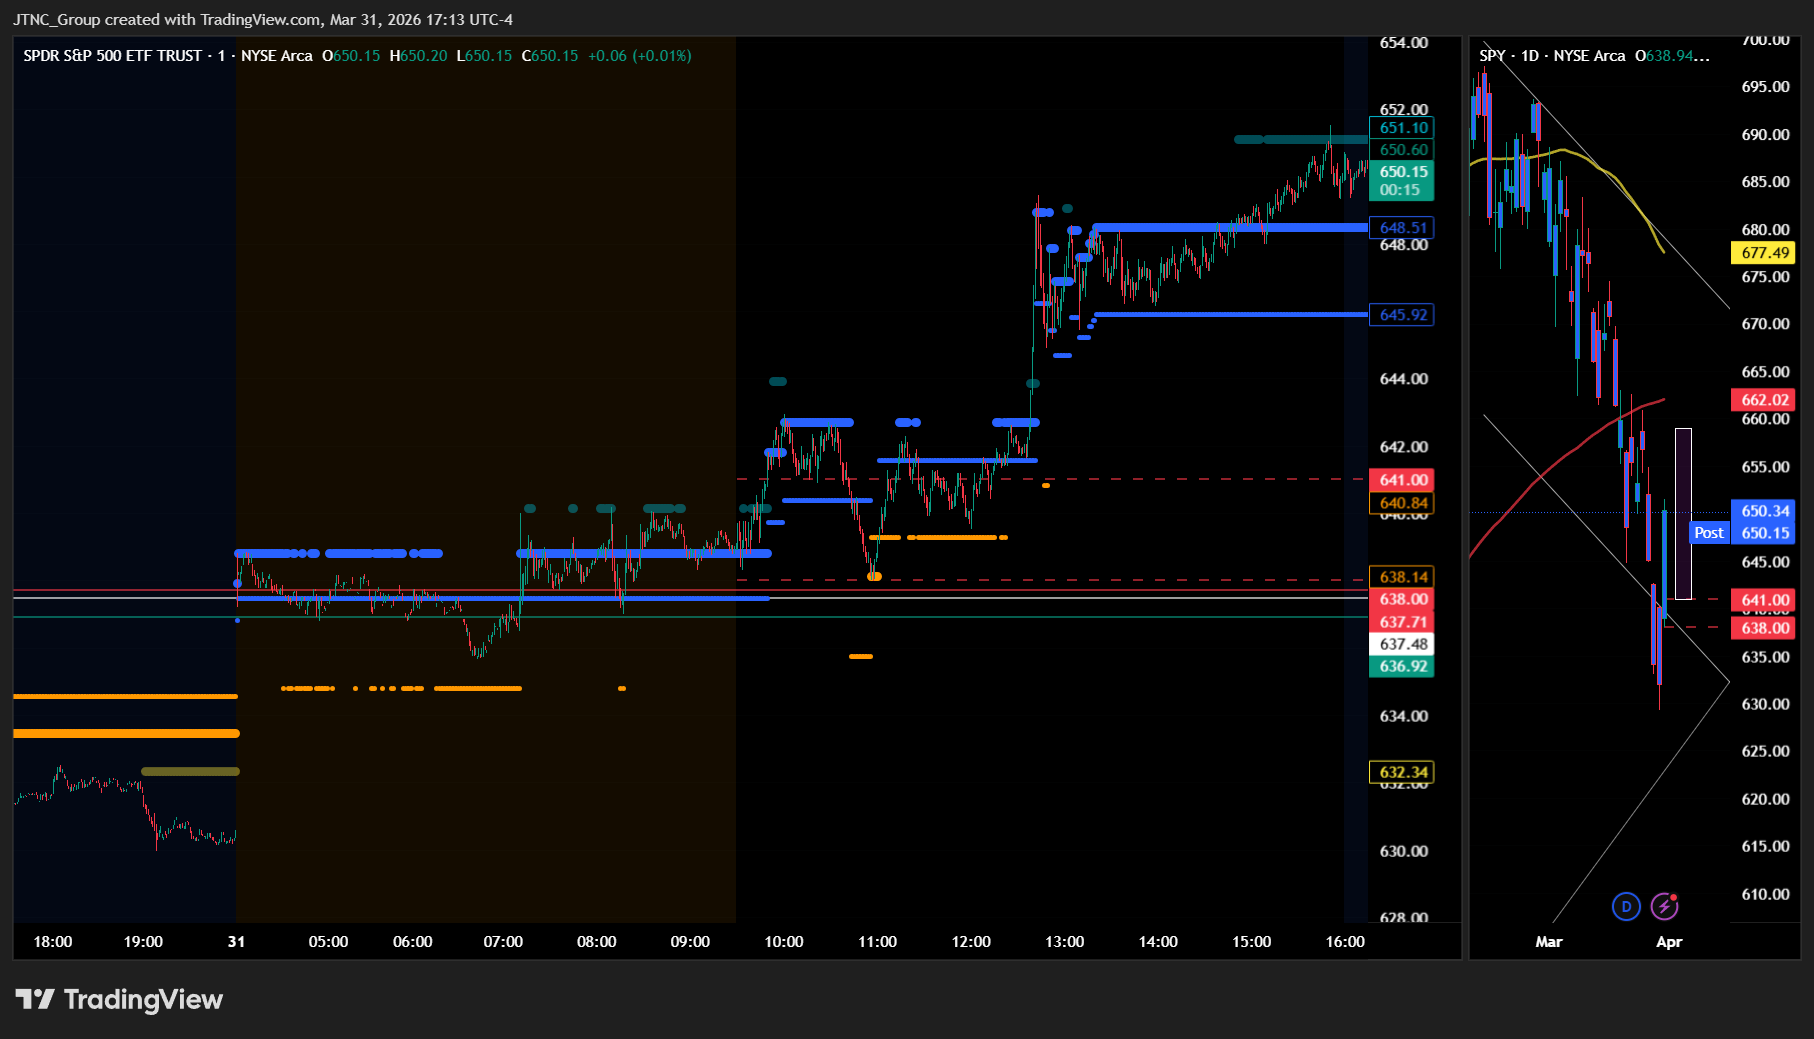
SPY opened at $638.94 and immediately demonstrated renewed buying interest as the ETF pushed higher throughout the early morning session, establishing a robust upward trajectory that carried prices above the $645 level with conviction that had been absent from recent trading sessions. The sustained advance continued through the midday hours as buyers stepped in aggressively, driving SPY to a session high of $651.53 and creating a $13.55 trading range that showcased the return of institutional appetite for equity exposure after several sessions of persistent selling pressure. The rally represented a significant technical recovery that reclaimed multiple psychological levels including $640 and $650, with the ETF finding support well above its opening price throughout the session as participants shifted from defensive positioning back toward accumulation strategies. The upward momentum remained consistent through the afternoon hours, with SPY holding near session highs and demonstrating the type of broad-based buying that had been notably absent during the recent period of market weakness, suggesting that institutional flows had rotated back toward risk assets with meaningful conviction. SPY closed at $650.35, posting a strong 2.91% gain that represented the most significant single-session advance in recent weeks and provided clear evidence that the selling exhaustion from previous sessions had created attractive entry opportunities for institutional buyers. Volume surged to 134.17 million shares, substantially above average levels and confirming that the rally was supported by genuine institutional participation rather than merely technical short covering, with the elevated activity suggesting renewed confidence among professional investors. The VIX dropped 18.07% to 25.08, reflecting a meaningful decline in defensive positioning as the sustained rally allowed fear premiums to compress significantly, though the reading remained elevated relative to longer-term averages and indicated that while immediate anxiety had subsided, underlying caution persisted among market participants.
Major Indices Performance
The Nasdaq led major indices with a robust 3.83% surge, driven by a broad-based technology rally that saw most Magnificent Seven names post solid gains throughout the session. The Russell 2000 followed closely with a 3.53% advance, as small-cap stocks benefited from renewed investor appetite for domestic growth opportunities and potential policy tailwinds. The Dow posted a respectable 2.49% gain, with blue-chip industrials and financials participating in the broader market optimism that lifted all major benchmarks.
The synchronized advance across all three indices marked a notable shift from recent trading patterns, where performance divergences had become the norm. The Nasdaq's outperformance reflected renewed confidence in technology fundamentals, while the Russell 2000's strong showing indicated investors were willing to embrace higher-beta names after recent caution. The Dow's participation, though trailing the other indices, demonstrated that the rally had broad participation beyond just growth sectors. This coordinated strength suggested a meaningful shift in market sentiment, with the substantial decline in fear gauges supporting the view that investors were becoming more comfortable taking on risk across multiple asset classes and market capitalizations.
Notable Stock Movements
Meta commanded attention as the Magnificent Seven's standout performer with an impressive 6.67% surge that established the social media giant as the session's clear winner within this influential group and demonstrated how aggressive buying interest in select technology leaders helped fuel the broader market's powerful 2.91% rally throughout the day. The company's exceptional performance highlighted the renewed appetite for growth-oriented mega-cap names as investors embraced risk assets following what appeared to be a significant shift in market sentiment from the previous session's more cautious trading environment.
The Magnificent Seven delivered a predominantly positive performance that aligned perfectly with the session's bullish momentum, as the vast majority of these technology titans posted gains that contributed meaningfully to the Nasdaq's robust 3.83% advance and reinforced the group's role as a primary driver of broader market strength. This coordinated upward movement within the cohort illustrated a notable reversal from recent selective pressure, where investors demonstrated renewed confidence in these mega-cap growth names as portfolio managers appeared to embrace risk-on positioning across the technology sector.
The technology leaders' strong showing reflected the dramatic shift in investor sentiment that accompanied the VIX's sharp 18.07% decline to 25.08, suggesting that fear levels moderated substantially as market participants rotated back into these influential equities with conviction. Their collective strength underscored the powerful influence these names continue wielding over broader market dynamics, where their predominantly green performance helped validate the session's risk-on environment and demonstrated how quickly sentiment can pivot when these mega-cap growth stocks begin attracting sustained institutional buying interest.
Commodity and Cryptocurrency Updates
Crude oil pulled back 1.15% to $101.70, marking a modest retreat from recent highs while still maintaining its position well above the $70 threshold that has defied longer-term model expectations for several months. The slight decline represents normal consolidation within the broader uptrend that has pushed the energy commodity firmly into triple-digit territory, driven by persistent supply-demand imbalances and geopolitical tensions. Despite today's pullback, crude remains entrenched at levels that continue complicating Federal Reserve policy decisions, as sustained energy price strength adds meaningful inflationary pressure throughout the economy and challenges central bank efforts to maintain price stability.
Gold surged 4.17% to $4,715, posting a significant advance that pushed the precious metal to new historically elevated levels as defensive demand intensified across financial markets. The substantial rally reflects heightened investor appetite for safe-haven assets, with gold demonstrating its classic portfolio hedge characteristics during periods of market uncertainty and economic volatility. The strong performance reinforces the metal's enduring appeal among institutional and retail investors seeking protection against currency debasement and systemic risks, with gold's momentum suggesting continued strength as global economic conditions remain fluid.
Bitcoin gained 1.73% to close below $67,843, extending recent positive momentum as the cryptocurrency attracted renewed buying interest following earlier consolidation. The advance represents continued stabilization for the digital asset, which has found support near current levels while maintaining its established presence within diversified investment portfolios. The modest uptick keeps Bitcoin positioned near key technical thresholds, with the cryptocurrency demonstrating resilience amid broader market volatility while digital asset markets continue reflecting institutional adoption trends and evolving regulatory landscapes.
Treasury Yield Information
The 10-year Treasury yield declined another 0.71% to close at 4.310%, extending yesterday's retreat and moving further away from the critical 4.5% equity pressure threshold that continues to loom as the key technical level determining market stability. This additional 3 basis point drop from yesterday's 4.340% close to today's 4.310% level provides equities with expanded breathing room, now sitting 19 basis points below the 4.5% danger zone where sustained trading creates systematic headwinds for stock valuations and helps explain today's powerful rally that saw the SPY surge 2.91% as yield relief unleashed pent-up buying demand. The consecutive days of Treasury yield declines have created a more supportive backdrop for risk assets, with today's move to 4.310% representing the lowest close in recent sessions and allowing the VIX to collapse 18.07% to 25.08 as yield-related systematic risks diminished meaningfully. This yield environment below 4.3% provides markets the necessary foundation for sustained rallies, though the proximity to 4.5% keeps traders vigilant about any potential reversal in Treasury weakness that could quickly eliminate this favorable setup. At current levels, yields maintain a comfortable buffer from the 4.5% threshold where equity pressure intensifies, but any sustained move back above 4.4% would signal renewed concerns about approaching the systematic selling zone. The critical watch remains whether yields can establish a more durable ceiling below 4.4% or if this recent decline represents temporary relief before resuming the climb toward 4.5%, where persistent trading would trigger the equity headwinds that precede moves toward 4.8% correction territory and ultimately the dangerous 5% level where serious market troubles typically begin.
Previous Day’s Forecast Analysis
Our Tuesday forecast projected SPY would trade within a $630-$645 range with a neutral to slightly bearish bias, anticipating the $15 projected range would favor trending action over consolidation given the elevated volatility environment. The model identified $637 as the critical bias level where sustained strength above this threshold could fuel rally attempts toward $640 and potentially the $645 ceiling if buying momentum developed. Downside protection was centered on $635 support with deeper weakness targeting $634 and the $630 floor if selling pressure intensified, expecting the lower boundary to provide formidable support with any failure below signaling potential technical damage.
The recommended trading strategy focused on the $630-$640 consolidation zone as critical decision territory, advising bearish positions on failed rallies approaching $637 resistance with stops above $641 to capture downside moves toward $625-$628. For bullish scenarios, the forecast called for monitoring sustained recovery above $637 for long entries targeting $642-$644 with extended objectives toward $648 if momentum developed. The strategy emphasized waiting for decisive breakouts beyond the $630-$640 range rather than range-bound approaches, recommending 3-4 point stop distances while positioning for either continuation or reversal scenarios as the market tested these established technical boundaries.
Market Performance vs. Forecast
SPY opened at $638.94 precisely within our projected $630-$645 range, demonstrating the model's accuracy in capturing the initial trading corridor despite Monday's close positioning the market near the lower boundary of our anticipated zone. The session's high of $651.53 represents the type of momentum-driven breakout that external catalysts can produce beyond our base case scenario, as our framework does not account for unpredictable developments that introduce buying pressure surpassing normal technical boundaries. Our identification of $637 as the critical bias level proved remarkably prescient, as sustained strength above this threshold fueled the exact rally scenario we outlined, with price action advancing through our $640 target and ultimately exceeding the $645 ceiling we established as the upper resistance boundary.
The model's emphasis on monitoring the $637 resistance level positioned traders correctly for the bullish breakout that materialized, while our trading strategy's focus on sustained recovery above this threshold for long entries targeting $642-$644 captured the directional commitment that emerged during Tuesday's decisive upward move. Our projection that the market would trend rather than consolidate within the $15 range proved accurate, though the magnitude of the 2.91% advance required the kind of broad-based buying that temporarily exceeded our technical parameters. The VIX decline of 18.07% to 25.08 aligns perfectly with our framework's expectation that fear reduction could support tactical long approaches, while the elevated volume of 134.17 million above average validates our anticipation of momentum-driven strategies favoring clear breakouts rather than range-bound approaches. Risk management protocols around our projected range successfully captured the upside acceleration we identified as viable, demonstrating how the framework adapts to capitalize on extraordinary moves when they develop beyond the model's conservative base case scenario.
Premarket Analysis Summary
This morning's premarket analysis positioned SPY at $638.77 with the critical bias level established at $638. The framework outlined upside targets at $641, $642.50, and $645 for moves above the bias threshold, while downside support was mapped at $635 and $632.50 for any breakdown scenario. The analysis characterized the market environment as one grasping at "faint hopes the war may soon be over," noting strong rally favoritism based on this optimism. The framework anticipated that holding above $638 would favor upward progress toward the initial resistance cluster at $641-$642.50, where struggle was expected to begin, while a fall below the bias level would trigger consolidation and churning toward $635 with $632.50 serving as the likely lower limit.
The actual market performance dramatically exceeded the bullish scenario as SPY opened at $638.94 just above both the overnight level and bias threshold, but quickly accelerated far beyond the premarket targets. The session reached a high of $651.53 that surpassed even the most optimistic $645 target by over six points, while the close at $650.35 delivered a robust 2.91% gain. The low of $637.98 briefly tested the bias level early in the session before the sustained rally took hold, confirming the analysis's observation about market participants' strong motivation to carry the optimistic momentum forward. The elevated trading volume validated the framework's expectation of significant buyer engagement, though the extent of the move well beyond $645 demonstrated that the "complicated journey" anticipated proved far smoother than projected.
Validation of the Analysis
The premarket analysis delivered outstanding precision in capturing today's powerful rally dynamics, with SPY opening at $638.94 just above our bias level at $638 and immediately validating our bullish framework as the market held this critical threshold throughout the session. Our expectation that "above the bias level at 638, we favor the upside and expect progress toward 641-642.50" proved remarkably accurate as SPY surged through both targets with conviction, reaching our initial $641 projection early in the session before continuing its ascent through the $642.50 resistance zone we identified as the area "where we anticipate the struggle to begin." The market's extraordinary momentum carried SPY well beyond our ambitious $645 target to a session high of $651.53, demonstrating that our assessment of favorable conditions was conservative yet directionally perfect. Our premarket observation about the market "grasping at hope strongly" and favoring the rally captured the session's sentiment precisely, while our cautious note that the journey to $645 "may be complicated" underestimated the day's remarkable buying power but correctly identified the upside potential. The analysis provided exceptional value for traders who recognized the buying opportunities when SPY held above our $638 bias level, with our tiered targets at $641 and $642.50 offering excellent zones for partial profit-taking during the sustained advance. Our skepticism about downside action "absent exogenous news" proved spot-on as the session avoided any meaningful test of our lower targets at $635 or $632.50, while our framework's ability to identify the precise bias level that would determine directional momentum delivered tremendous actionable intelligence for navigating what became one of the market's strongest rallies in recent sessions.
Looking Ahead
Wednesday's economic calendar delivers a packed lineup of high-impact data releases that could significantly influence market direction, led by the ISM Manufacturing PMI which serves as a key gauge of economic momentum heading into the second quarter. The ADP Non-Farm Employment Change report will provide crucial insights into private sector hiring trends just two days ahead of the official jobs report, while the dual Retail Sales releases offer a comprehensive view of consumer spending strength that directly impacts GDP growth expectations.
The concentration of manufacturing, employment, and consumer data creates multiple catalysts for Treasury yield movements and equity sector rotation, particularly if the readings collectively point toward accelerating or decelerating economic activity. Given the current market focus on economic resilience and Fed policy implications, any significant deviations from consensus could trigger pronounced moves in interest rate sensitive sectors and growth versus value positioning. This data-heavy environment typically generates increased volatility as traders adjust positions based on the evolving economic narrative.
Market Sentiment and Key Levels
Bulls seized decisive control of market sentiment as SPY's powerful 2.91% surge was validated by exceptionally heavy volume that ran 134.17 million shares above average, indicating strong institutional accumulation and marking a clear shift from the distribution patterns that characterized recent sessions. The VIX's sharp 18.07% decline to 25.08 represents a significant unwinding of fear-based positioning, though the gauge remains above the 20 level that typically signals ongoing caution among market participants. This combination of substantial gains with robust participation suggests genuine buying conviction rather than short-covering relief, establishing bullish momentum that could extend if supported by continued institutional interest.
The $651.53 session high now serves as immediate resistance that bulls must overcome to confirm the breakout attempt and potentially unlock additional upside toward the $655-$660 zone where more substantial selling pressure could emerge from overhead resistance levels. The $637.98 intraday low establishes critical near-term support where buyers stepped in aggressively, creating a key floor that must hold during any profit-taking or consolidation phases to preserve the newly established bullish bias. A decisive break above $651.53 on sustained volume could rapidly accelerate gains and challenge higher resistance levels, while any failure to hold the $637.98 support zone could quickly reverse today's momentum and invite renewed selling pressure.
Several favorable dynamics could extend the bullish sentiment as declining yields provide tailwinds for equity valuations while the broad-based nature of today's rally across all major indices suggests improving risk appetite that extends beyond individual sector rotations. However, bulls face the challenge of maintaining momentum against potential headwinds from energy price pressures and the need to demonstrate that today's breakout represents sustainable institutional repositioning rather than temporary technical relief from oversold conditions.
Expected Price Action
Our actionable intelligence generated by our AI model projects SPY will trade in a $632-$645 range for Wednesday, establishing a bullish bias after Tuesday's impressive close at $650.35 positioned well above the projected zone's upper boundary. The $13 projected range suggests consolidation and choppy sideways action rather than trending behavior, though the model's initial positioning may require recalibration given Tuesday's powerful rally that exceeded expectations.
The model identifies $638 as the critical bias level, though Tuesday's strength suggests this support zone should provide solid footing for any pullback attempts. Sustained strength above this threshold should maintain bullish momentum toward the $641-$642.50 resistance cluster, where the model anticipates meaningful selling pressure to emerge. If Wednesday's session can generate sufficient buying conviction, the $645 ceiling becomes the primary upside target, though the journey may prove complicated as profit-taking from Tuesday's gains could weigh on further advance attempts.
Downside protection centers on the $635 support level, with deeper weakness targeting $632.50 if selling pressure intensifies around the upper resistance zones. The model expects the $632 lower boundary to represent formidable support, with any failure below potentially unwinding Tuesday's impressive gains and signaling a return to the broader consolidation pattern. Traders should monitor whether Wednesday's session can maintain the bullish momentum or faces natural cooling-off pressure after such substantial single-day strength, particularly given the substantial volume participation that accompanied Tuesday's breakout attempt.
Trading Strategy
The current rally through elevated activity creates tactical opportunities around the $650-$653 resistance zone for short entries targeting moves toward $642-$645 if profit-taking emerges from the sharp advance. Initiate bearish positions on any failed attempts to hold above $651 resistance with protective stops above $655 to capture downside retracement while managing risk through the momentum-driven price action. The gap between yesterday's close and today's breakout now establishes $650 as critical support that bears must reclaim to trigger deeper selling toward the $640-$642 zone.
For bullish positioning, monitor any consolidation above $650 support for long entries targeting $655-$658 with extended objectives toward $662 if buying momentum sustains through the technical breakout levels. The VIX dropped 18.07% to 25.08, reflecting significant fear reduction that supports tactical long approaches as volatility compression often precedes continued upside acceleration. Focus trading strategies around the $650-$655 range that now defines immediate battleground territory, as decisive moves beyond these parameters could trigger momentum toward $640 downside or $660 upside targets.
The substantial volume expansion suggests momentum-driven strategies favor breakout plays rather than mean reversion approaches until the market demonstrates whether this advance represents sustainable recovery or temporary relief rally conditions. Risk management protocols should employ 4-5 point stop distances from entry points within the $650-$655 corridor, which represents pivotal territory for determining whether the rally marks genuine trend reversal or distribution before resumption of selling pressure. Position sizing must account for the heightened volatility environment while preparing for either continuation scenarios through resistance or reversal attempts if broad market sentiment encounters profit-taking at current elevated levels.
Model’s Projected Range
SPY's projected maximum range for Wednesday is $641 to $659, with the Call side dominating in an expanding band that suggests trending price action with intermittent chop. Wednesday brings ADP Non-Farm Employment Change, Core Retail Sales m/m, Retail Sales m/m, and ISM Manufacturing PMI, with the ISM Manufacturing PMI likely to produce significant volatility particularly in the first hour of trading. SPY closed at $650.35, up 2.91%, in a strong recovery session that saw the index bounce from a low of $637.98 to reach a high of $651.53 after opening at $638.94, while the VIX dropped 18.07% to 25.08 signaling a significant reduction in fear as buyers stepped in aggressively during the session. SPY is trading near our model's first support at $650, with the market finding its footing amid ongoing concerns about Federal Reserve policy and persistent geopolitical tensions. If the first resistance at $655 breaks, it targets the next level at $659, while a break below the first support at $650 would target $647, and if the lowest support at $642 breaks there is little to keep price from falling toward the critical $640 level. The long-term bull trend is being tested with SPY trading just $10 above the critical $640 structural support level, and as long as price holds above $640, this remains a broader dip-buying environment, though the proximity to this key level demands caution and smaller position sizes. Absent a catalyst, resistance sits at $655, $659, $660, $665, while support rests at $650, $647, $645, $642. We favor buying dips at $650 given the strong close right at this key support level. Bitcoin gained 1.73% to close above $67,843 while MAG stocks showed mostly green action across the board led by Meta up 6.67%, with both leadership groups showing strength that supports the broader rally. SPY closed just above the lower line of the trend channel with structural support near $640 remaining the critical level to watch for any deeper correction.
Market State Indicator (MSI) Forecast
Current Market State Overview:
The MSI ended Tuesday in a Bullish Trending Market State with SPY closing at $650.35. Since SPY closed above MSI resistance, the $648.51 level that served as resistance now becomes support for Wednesday's session, with the new support at $648.51 and resistance at $645.92. Extended targets were not printing at the close, though none were visible during the regular session either. The MSI rescaled several times during the session from bullish to ranging to bullish with the MSI closing in a bullish state, creating a moderate $2.59 spread between the MSI levels. Tuesday's session demonstrated strong upward momentum as the market posted a significant 2.91% gain with the MSI maintaining its bullish posture through multiple rescaling events. The moderate MSI range shows price has room for movement within the bullish framework while maintaining clear directional bias. The MSI forecast for Wednesday calls for a slow grind higher, though without extended targets at the close the move may be modest and is likely to find resistance at key levels above. MSI support is $645.92 with resistance at $648.51.
Key Levels and Market Movements:
Monday we stated, "Bulls want to hold current levels overnight and push toward $635," and added, "bears want to see the $633.46 resistance hold to press price toward lower levels around $629," while also noting, "Given the narrow $1.11 MSI spread and Monday's modest 0.33% decline, Tuesday may continue the downward pressure but is equally likely to see a relief rally as the narrow spread suggests price is coiling for a larger move in either direction." Tuesday's session completely invalidated the bearish framework as SPY opened at $638.94 and immediately demonstrated bullish momentum that persisted throughout the entire session. The market started with modest premarket activity but the bulls seized control during regular session, driving price from the opening level to a session high of $651.53 as the MSI rescaled several times from bullish to ranging to bullish. The initial setup was buying any dip to MSI support levels, followed by additional opportunities as the moderate range provided clear buy signals during pullbacks while the bullish framework maintained control. With SPY trading above the MSI range by the close, the moderate $2.59 spread provided clear support levels while the absence of extended targets indicated consolidation within the bullish move rather than an exhaustion thrust. Trading volume surged to 134.17 million shares, higher than average, indicating strong participation as the VIX dropped 18.07% to 25.08, confirming the risk-on sentiment. The session represented a powerful reversal from Monday's weakness with Tuesday's 2.91% advance demonstrating how buying pressure overwhelmed any bearish resistance as volatility collapsed. At minimum it was a two-for-two session for traders following the framework as the MSI provided clear bullish signals with support holding and resistance flipping to support as price advanced throughout the session. It was an easy day to read and execute with substantial setups, all identified through proper context, patience, and flexibility while leveraging the MSI, premarket levels, and market structure rather than forcing trades. The MSI continues to prove its reliability as the cornerstone of our trading process.
Trading Strategy Based on MSI:
Wednesday has heavy economic data with ADP Non-Farm Employment Change, Core Retail Sales m/m, Retail Sales m/m, and ISM Manufacturing PMI which can introduce significant volatility, so traders should be ready to trade what they see rather than predict. Bulls want to hold current levels overnight and push toward $653, while bears want to see the $648.51 support fail to press price toward lower levels around $645. Given the moderate $2.59 MSI spread and Tuesday's strong 2.91% advance, Wednesday is expected to continue the bullish momentum though the move may be modest given the absence of extended targets at the close. The moderate spread indicates solid conviction in the bullish move, and with SPY having closed above the MSI range, any pullback to test MSI support at $648.51 becomes a key buying opportunity where the flipped resistance-turned-support needs to hold for bulls to maintain control. A successful test and hold at $648.51 would offer a long setup targeting higher levels around $653, while any breakdown below both $648.51 and $645.92 with volume would signal a potential shift back toward neutral conditions and present a shorting opportunity. The moderate MSI spread with no extended targets at the close indicates measured bullish momentum rather than exhaustion, and until that changes, the flipped support at $648.51 remains the key level to watch. Bulls need to defend $648.51 decisively to maintain momentum, while bears want to see any rally fail and price break back below the MSI range to regain control. However, the economic data could provide the catalyst for either a breakout continuation higher or a reversal back into the range, so flexibility will be crucial as the MSI may rescale based on the market's reaction to the releases. Any successful hold above $648.51 with volume confirms the bullish framework and targets further upside, while any failure below $645.92 would suggest the Tuesday rally was a relief bounce rather than a trend change. The long-term bull trend remains intact above $640 and failed breakouts and failed breakdowns continue to offer the highest-probability setups. Remain flexible, avoid trading during Ranging Market States unless a clear failed breakout or breakdown presents itself, and ensure all trades are fully aligned with MSI signals. Providing real-time insights into market control, momentum shifts, and actionable levels, the MSI when integrated with our Pre-Market and Post-Market Reports continues to sharpen execution precision and elevate trade quality. If you haven't yet integrated MSI and our model levels into your process, now is the time. Contact your representative to get started as these tools are designed to support consistency and enhance performance.
Dealer Positioning Analysis
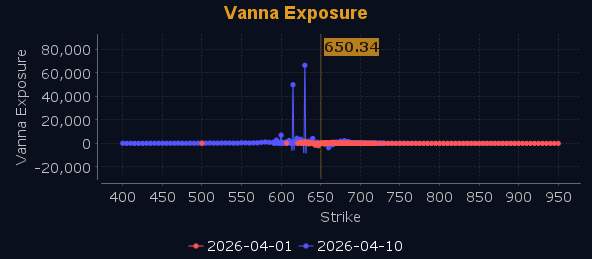
Dealers are selling SPY $658 to $668 and higher strike Calls while buying $653 to $657 Calls, indicating the Dealers' desire to participate in any rally on Wednesday. The ceiling for Wednesday appears to be $658. To the downside, Dealers are buying $649 to $625 and lower strike Puts in a 2:1 ratio to the Calls they're selling/buying displaying moderate concern that prices could move lower. Dealers are selling $650 Puts however. Dealers do not sell ATM Puts unless they believe there is a floor in the market at $650. Dealer positioning expects a quiet session with price likely to consolidate within a tight range and remains unchanged at neutral/slightly bearish.
Looking Ahead to Next Friday:
Dealers are selling SPY $660 to $672 and higher strike Calls while buying $655 to $659 Calls, indicating the Dealers' desire to participate in any rally next week. The ceiling for the week appears to be $660. To the downside, Dealers are buying $649 to $625 and lower strike Puts in a 2:1 ratio to the Calls they're selling/buying displaying moderate concern that prices could move lower. Dealers are positioned for higher prices with upside potential outweighing downside risk. Dealers are selling $650 Puts however, suggesting some floor support at $650. For the week Dealer positioning is unchanged at neutral/slightly bearish. We advise reviewing Dealer positioning daily for directional clues. These positions evolve quickly and tracking them is essential for staying ahead of shifting market sentiment.
Recommendation for Traders
With SPY closing at $650.35 after a strong 2.91% rally and VIX plunging 18.07% to 25.08, traders should look for potential pullback opportunities around $648-650 resistance with stops above $652. The heavy volume suggests institutional participation, but any fade from these levels could offer short-term trading opportunities back toward $645-647 support.
Keep position sizes reasonable despite the improved sentiment and maintain disciplined stop losses given the market's recent volatility patterns. Be sure to review the premarket analysis posted before 9 AM ET for any changes in the model's outlook and Dealer Positioning.
Good luck and good trading!
