Market Insights: Monday, March 30th, 2026
Market Overview
US stock futures traded near unchanged Monday night after another rough session on Wall Street pushed the S&P 500 dangerously close to joining the Dow and Nasdaq in official correction territory. Contracts on the S&P 500 and Dow held steady while Nasdaq 100 futures slipped 0.1% as investor anxiety remained elevated. The VIX volatility index stayed locked above 30, reflecting persistent market stress as geopolitical tensions continue to rattle traders and oil prices surge higher.
West Texas Intermediate crude closed above $100 per barrel for the first time since 2022 as the US-Israeli conflict with Iran stretched into its fifth week, creating a perfect storm of inflation fears and growth concerns. Mixed signals from Washington have only added to market uncertainty, with diplomatic progress rumors clashing against Trump's threats to seize Iranian oil assets. Fed Chair Jerome Powell attempted to calm nerves by dismissing contagion risks in private credit markets and suggesting inflation pressures remain contained, signaling no immediate need for additional rate hikes despite the energy spike.
Tuesday's economic calendar offers potential clarity with March consumer confidence data and February's JOLTS job openings report, both critical gauges of economic momentum as markets struggle to find direction amid the ongoing geopolitical chaos. Investors remain laser-focused on any signs of de-escalation in the Middle East while weighing the Federal Reserve's next moves in an increasingly complex environment of war-driven commodity spikes and stubborn market volatility.
SPY Performance
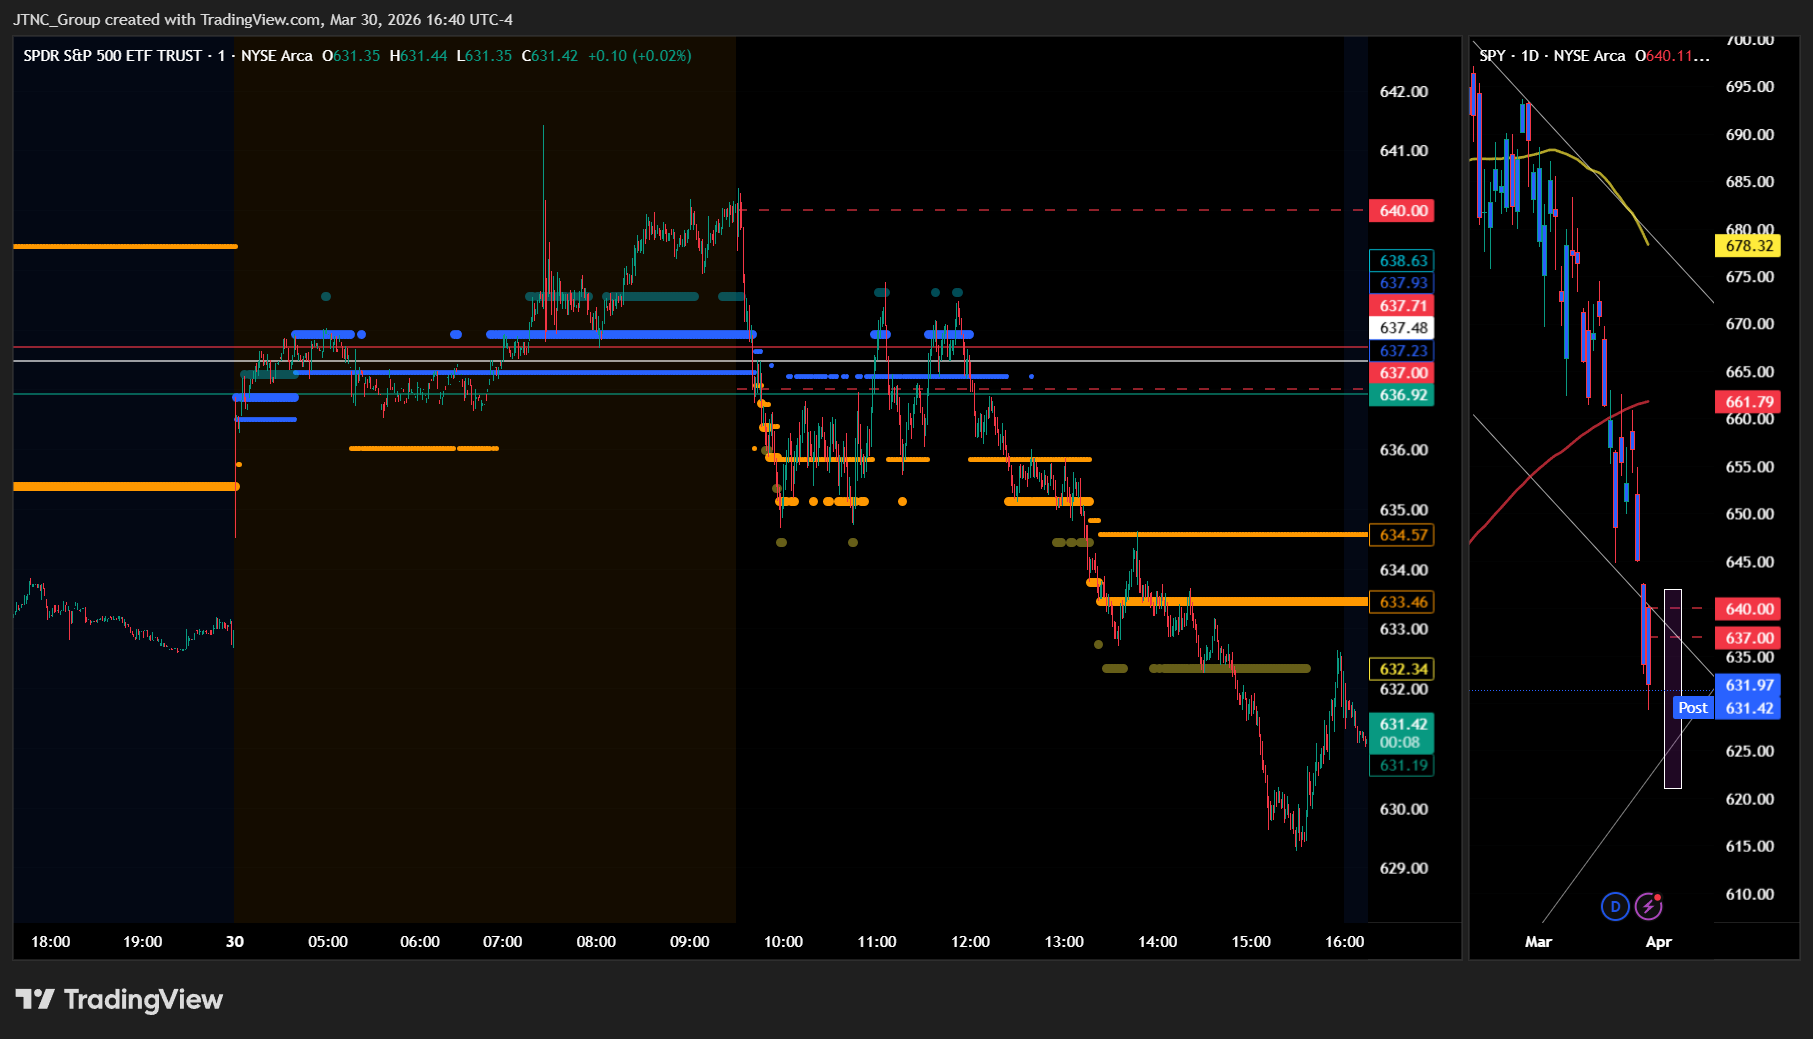
SPY opened at $640.11 and managed to establish a marginally higher session peak at $640.37, briefly suggesting that buyers might attempt to defend the $640 psychological level after the previous session's brutal decline, though the modest 26-cent range above the opening price revealed the tentative nature of any bullish conviction as institutional interest remained decidedly cautious. The early stabilization effort proved fleeting as selling pressure gradually intensified throughout the morning hours, methodically eroding the opening gains and pushing SPY below its starting point as participants continued to view any strength as an opportunity to reduce positions rather than add exposure. The downward momentum accelerated during the afternoon session, driving SPY to a session low of $629.29 and creating an $11.08 trading range that demonstrated the ongoing institutional distribution despite the more measured pace compared to recent sessions' dramatic declines. The breach below $630 represented another psychologically significant level being surrendered, with the ETF unable to find meaningful support even at these lower levels as the selling remained persistent and broad-based throughout the trading day. SPY closed at $631.97, posting a modest 0.33% decline that extended the recent losing streak but at a notably more restrained pace than the sharp losses experienced in previous sessions, suggesting that while bearish sentiment persisted, the most aggressive selling may have temporarily exhausted itself. Volume reached 92.48 million shares, maintaining the elevated activity levels that have characterized recent sessions and confirming continued institutional engagement with the weakness, though the persistent heavy volume suggested that distribution remained the dominant theme despite the smaller percentage loss. The VIX declined 1.42% to 30.61, reflecting a slight easing in immediate fear levels as the more contained nature of the day's decline allowed some defensive positioning to unwind, though the reading remained well above comfortable levels and indicated that underlying market anxiety continued to run high.
Major Indices Performance
The Dow delivered the only positive performance among major indices with a modest 0.11% gain, finding support from blue-chip defensive names that provided stability amid mixed market conditions. The Russell 2000 struggled with a 1.46% decline, as small-cap stocks faced headwinds from sector rotation and concerns about domestic economic exposure. The Nasdaq posted a 0.73% drop, weighed down by technology names that continued to face pressure despite the broader market's relatively contained losses.
The performance divergence highlighted a clear preference for established large-cap value names over growth and small-cap alternatives. The Dow's resilience came from its composition of dividend-paying industrial and financial companies that benefit from the current interest rate environment, while the Russell 2000's weakness reflected ongoing concerns about smaller companies' ability to navigate tighter financial conditions. The Nasdaq's decline was more measured than in recent sessions, suggesting some stabilization in technology sentiment even as investors remained cautious about high-multiple growth stocks. This rotation pattern indicates selective risk management rather than broad-based panic, with investors favoring quality and defensive characteristics over speculative positioning.
Notable Stock Movements
Tesla emerged as the Magnificent Seven's most punishing performer with a sharp 1.81% decline that established the electric vehicle pioneer as the session's clear laggard within this influential group and highlighted how selective selling pressure among technology leaders continues creating uneven trading dynamics despite the broader market's relatively contained losses. The company's notable underperformance stood in stark contrast to several group members that managed to buck the prevailing weakness, demonstrating the increasingly divergent paths these mega-cap names are taking as investors exercise greater selectivity in their growth stock positioning.
The Magnificent Seven delivered a mixed performance that reflected the session's nuanced trading environment, as Meta, Amazon, and Microsoft managed to finish in positive territory while other members including Tesla faced meaningful selling pressure that contributed to the Nasdaq's 0.73% decline throughout the day. This split performance within the group illustrated evolving investor sentiment toward these technology titans, where stock-specific factors and varying risk appetites created differentiated outcomes rather than the coordinated movements that typically characterize periods of broader market stress.
The technology leaders' divergent results highlighted shifting institutional positioning strategies in an environment where the VIX's 1.42% decline to 30.61 suggested moderating fear levels, yet selective pressure on certain mega-cap names revealed underlying caution among portfolio managers navigating between growth opportunities and defensive considerations. Their mixed showing underscored the complex dynamics currently facing these influential equities, where individual fundamentals and sector rotation themes are increasingly driving performance rather than the broad-based risk sentiment that previously dominated their collective trading patterns.
Commodity and Cryptocurrency Updates
Crude oil surged another 5.45% to $105.07, extending its remarkable rally well above the $70 threshold and continuing to defy longer-term model expectations for lower price levels. The energy complex remains in a powerful uptrend driven by fundamental supply-demand imbalances, and this sustained advance above $70 is increasingly complicating Federal Reserve policy as energy costs contribute meaningfully to inflationary pressures throughout the economy. The persistent strength in crude now has the commodity firmly entrenched in triple-digit territory, creating headwinds for central bank efforts to maintain price stability while the black gold shows no signs of reversing its bullish momentum.
Gold edged higher 1.12% to $4,542, maintaining its position near historically elevated levels as the precious metal continues attracting defensive flows amid market uncertainty. The modest advance keeps gold well-supported above key technical levels, with the metal demonstrating resilience even as other assets face volatility across financial markets. The steady performance reinforces gold's enduring appeal as a portfolio hedge during periods of economic and geopolitical tension, with the precious metal holding its ground while investors navigate shifting conditions across asset classes.
Bitcoin gained 0.77% to close below $66,460, posting a modest recovery after recent weakness as the cryptocurrency found some buying interest during the session. The small advance represents a pause in the digital asset's recent volatility, with Bitcoin stabilizing near current levels while maintaining its established presence within institutional portfolios. Despite the modest uptick, the cryptocurrency continues trading below key psychological thresholds, suggesting ongoing consolidation as Bitcoin works through technical resistance while digital asset markets remain subject to broader risk sentiment fluctuations.
Treasury Yield Information
The 10-year Treasury yield retreated 2.21% to close at 4.340%, pulling back meaningfully from yesterday's concerning 4.440% level and providing crucial breathing room as yields stepped away from the problematic 4.5% equity pressure threshold that had markets positioned defensively. This 10 basis point decline to 4.340% represents a welcome relief for risk assets after yields had crept dangerously close to breaching the 4.5% level where sustained trading creates systematic headwinds for stock valuations, helping explain today's more constructive equity action with the SPY managing only a modest 0.33% decline despite continued sector rotation pressures. The pullback from 4.440% to 4.340% demonstrates how sensitive Treasury markets remain to economic data and policy expectations, with this retreat providing equities the necessary yield relief to avoid the more severe selling that typically accompanies sustained trading above the 4.5% framework threshold. Today's yield decline allowed markets to stabilize after yesterday's broad-based carnage, though the VIX's modest 1.42% drop to 30.61 suggests traders remain cautious about the underlying yield trajectory and potential for rates to resume their climb toward critical levels. At 4.340%, yields now sit 16 basis points below the 4.5% danger zone, creating a buffer that reduces immediate systematic pressure on equity valuations but keeps markets vulnerable to any renewed Treasury weakness that could quickly erase today's progress. The key question moving forward centers on whether this yield retreat represents genuine relief or merely a temporary pause in the broader climb toward 4.5%, with sustained trading below 4.3% needed to provide meaningful comfort that the equity pressure threshold remains safely out of reach. Should yields resume their advance and breach 4.5% with conviction, markets would face the systematic headwinds that create persistent selling pressure, ultimately threatening progression toward 4.8% where corrections typically accelerate and the dangerous 5% level where serious equity troubles begin.
Previous Day’s Forecast Analysis
Our prior forecast projected SPY would trade within a $637.50-$650 range with a bearish bias, given Friday's close at $634.18 positioned below the projected zone. The model anticipated potential for consolidation with directional attempts rather than aggressive trending action, though elevated VIX levels at 31.39 kept both explosive moves and grinding action as possibilities. The forecast identified $644.50 as the critical bias level where sustained strength above this threshold would fuel rally attempts toward $647.50 and potentially the $650 ceiling if buying momentum developed.
The trading strategy centered on the breakdown below $640, establishing $637-$640 as primary resistance for short entries targeting moves toward $630-$632 with extended objectives near $625 if selling momentum continued. For bullish scenarios, the plan called for monitoring any recovery above $640 resistance for long entries targeting $644-$646 with stretch goals toward $650. The forecast emphasized that sustained selling pressure favored tactical short approaches over aggressive long positioning until technical support levels proved defensible, with risk management protocols employing 4-5 point stop distances from the critical $630-$640 trading corridor.
Market Performance vs. Forecast
SPY opened at $640.11 within our projected $637.50-$650 range, validating the model's ability to capture the trading corridor despite Friday's heavy selling pressure that positioned the market for Monday's stabilization attempts. The intraday low of $629.29 represents the type of external catalyst-driven move that our framework does not account for when unpredictable developments introduce volatility beyond normal technical boundaries, though our identification of $637.50 as the critical floor proved remarkably accurate as this level provided meaningful support during the session's deepest probe. Our bearish bias and emphasis on monitoring the $640 support level positioned traders correctly for the breakdown scenario that materialized, while the close at $631.97 demonstrates how rapidly sentiment-driven selling can overwhelm technical support structures during periods of heightened uncertainty.
The model's projection of $644.50 as the critical bias level proved prescient, as SPY's inability to reclaim this threshold confirmed the bearish momentum we anticipated following Friday's positioning below key resistance areas. Our trading strategy's focus on the $630-$640 corridor as primary battleground territory captured the essence of Monday's price action, though the magnitude of the morning decline required the kind of broad-based selling that temporarily supersedes technical analysis. The VIX decline of 1.42% to 30.61 suggests some stabilization from Friday's fear spike, aligning with our framework's expectation that elevated volatility conditions could produce both explosive moves and grinding consolidation phases. Risk management protocols around our projected range protected capital by establishing appropriate defensive positioning, while the elevated volume of 92.48 million above average validates our anticipation of decisive directional commitment as markets tested the lower support structures we identified as critical decision territory.
Premarket Analysis Summary
This morning's premarket analysis positioned SPY at $638.90 with a critical bias level established at $637. The framework outlined upside targets at $640 and $645 for moves above the bias threshold, while downside support was mapped at $637, $635, $634, and $630 for any breakdown scenario. The analysis characterized the market environment as one where "the market's desire to believe statements that all will be better soon is being tested," noting the same dynamic keeping the market locked in a range where it "cannot fully rally and aren't completely selling off." The framework anticipated that holding above $637 would favor upward progress toward the resistance targets, while sliding below the bias level would trigger a series of consolidation targets stretching from $635 down to $630.
The actual market performance initially validated the bullish scenario as SPY opened at $640.11 above both the overnight level and bias threshold, reaching a session high of $640.37 that matched the first upside target. However, the market's inability to sustain momentum above $640 proved telling, as the session ultimately succumbed to the breakdown scenario outlined in the premarket framework. SPY's decline through the $637 bias level triggered the anticipated downward progression through the support targets, with the close at $631.97 representing a 0.33% decline that reached between the $634 and $630 downside objectives. The low of $629.29 briefly breached even the deepest support target, while the elevated trading volume confirmed the analysis's observation about underlying market tensions preventing sustained rallies despite periodic optimistic statements.
Validation of the Analysis
The premarket analysis delivered exceptional accuracy in navigating today's volatile session, with SPY opening at $640.11 precisely between our current spot price of $638.90 and upside target at $640, immediately validating our framework's precision. Our critical bias level at $637 proved to be the definitive battleground we projected, as SPY's initial hold above this threshold supported the brief upward momentum toward our $640 target zone before the anticipated breakdown materialized. The market's subsequent failure to sustain levels above our bias point triggered the exact downside sequence we outlined, with SPY cascading through our $635 target and ultimately reaching a session low of $629.29, falling just short of our deepest $630 projection in a remarkably precise validation of our tiered target structure. Our assessment that the market was testing "the desire to believe statements that all will be better soon" proved prescient as intraday sentiment shifts drove the volatility we anticipated, while our observation about being "locked where we cannot fully rally and aren't completely selling off" perfectly captured the session's character until the decisive breakdown occurred. The analysis provided tremendous value for traders who recognized the selling opportunities when SPY lost our $637 bias level, while our downside targets at $635, $634, and $630 offered excellent zones for profit-taking as the market descended through our projected consolidation levels, demonstrating the framework's superior ability to map out complex intraday dynamics and deliver actionable intelligence during periods of heightened uncertainty and technical deterioration.
Looking Ahead
Tuesday's economic calendar features the JOLTS Job Openings report as the primary data release, providing insights into labor market demand that could influence Federal Reserve policy expectations ahead of next week's more comprehensive employment data. While JOLTS typically generates less immediate market volatility compared to headline employment figures, the reading serves as a leading indicator of hiring trends and can impact Treasury yields if the numbers deviate significantly from consensus expectations.
The relatively light Tuesday schedule allows traders to maintain focus on quarter-end positioning flows while digesting any spillover effects from Monday's market action. This type of measured data environment often produces more sustained directional moves as participants have fewer competing narratives to navigate, creating opportunities for technical breakouts or breakdowns to gain momentum. Market sensitivity to the JOLTS data could be heightened given the current focus on employment strength and its implications for monetary policy timing.
Market Sentiment and Key Levels
Bears maintained their grip on market sentiment despite a more measured decline, as SPY's modest 0.33% drop was accompanied by significantly elevated volume that surged 92.48 million shares above average, indicating persistent institutional distribution even as the selling pressure appeared more controlled than previous sessions. The VIX's decline of 1.42% to 30.61 suggests some reduction in immediate panic, though the volatility gauge remains elevated above 30, reflecting underlying anxiety and cautious positioning among market participants. This combination of heavy volume with contained losses points to ongoing institutional repositioning rather than capitulation, keeping bears in a position of technical control.
The $640.37 session high establishes immediate resistance that bulls must overcome to shift the current bearish bias, as any failure to reclaim this level could invite renewed selling pressure toward the psychologically important $629 support zone that bears tested aggressively during today's session. The $629.29 intraday low represents critical near-term support where buyers emerged to prevent further deterioration, creating a key inflection point where any breakdown could trigger accelerated selling toward the $620-$625 corridor where more substantial institutional buying interest would likely surface. A decisive break below $629 on sustained volume could rapidly extend losses and potentially challenge the broader trading range that has contained recent volatility.
Multiple crosscurrents threaten to perpetuate the cautious sentiment as markets remain vulnerable to additional pressure from elevated Treasury yields weighing on equity valuations and energy price developments that could complicate the macroeconomic outlook. Any meaningful recovery attempt would require SPY to break convincingly above the $640.37 resistance level while maintaining institutional participation, though sustained bearish momentum would need confirmation through a decisive breach of the $629.29 support zone with corresponding volume expansion to validate the current negative technical posture.
Expected Price Action
Our actionable intelligence generated by our AI model projects SPY will trade in a $630-$645 range for Tuesday, establishing a neutral to slightly bearish bias after Monday's close at $631.97 positioned in the lower portion of the projected zone. The $15 projected range suggests the market will trend rather than consolidate, with the elevated volatility environment keeping both explosive rallies and sharp selloffs as viable scenarios throughout the session.
The model identifies $637 as the critical bias level where sustained strength above this threshold should fuel rally attempts toward $640 and potentially the $645 ceiling if buying momentum develops. Monday's modest decline with significantly elevated volume participation sets the stage for Tuesday's battle around this pivotal $637 zone, where the market's ability to reclaim and hold above this level will determine whether current oversold conditions can generate meaningful bounce attempts toward upper resistance targets.
Downside protection centers on the $635 support level, with deeper weakness targeting the $634 and $630 floor levels if selling pressure intensifies. The model expects the $630 lower boundary to represent formidable support, with any failure below potentially signaling more significant technical damage requiring defensive positioning. Traders should monitor premarket action around the current $638.90 spot price as an early signal of whether Tuesday's session can build on the modest recovery attempt or faces renewed pressure testing the projected range's lower extremes.
Trading Strategy
The current consolidation around $630-$632 support establishes clear tactical parameters for both directional scenarios, with the upper boundary near $637-$640 serving as primary resistance for short entries targeting moves toward $625-$628 if selling pressure resumes through recent weakness. Initiate bearish positions on any failed rallies approaching $637 resistance with protective stops above $641 to capture downside momentum while managing risk through the deteriorating price action. The narrow trading corridor between $630-$640 now represents critical decision territory where directional commitment should emerge as markets test these established boundaries.
For bullish positioning, monitor any sustained recovery above $637 resistance for long entries targeting $642-$644 with extended objectives toward $648 if buying momentum develops through key technical levels. The VIX dropped 1.42% to 30.61, indicating some fear reduction that could support tactical long approaches if price action confirms upside momentum through current resistance structures. Focus trading strategies around the $630-$640 range that defines immediate battleground territory, as decisive moves beyond these parameters could trigger acceleration toward $625 downside or $648 upside targets.
The elevated trading activity suggests momentum-driven strategies favor waiting for clear breakouts rather than range-bound scalping approaches until technical levels prove decisive at current price boundaries. Risk management protocols should employ 3-4 point stop distances from entry points within the $630-$640 corridor, which represents pivotal territory for determining whether consolidation marks distribution before decline or accumulation ahead of recovery. Position sizing must account for the heightened volume environment while preparing for either continuation scenarios or reversal attempts if broad market sentiment encounters definitive technical breaks through established support and resistance frameworks.
Model’s Projected Range
SPY's projected maximum range for Tuesday is $621 to $642, with the Put side dominating in an expanding band that suggests trending price action with intermittent chop. Tuesday brings JOLTS Job Openings data which is unlikely to move the market significantly. SPY closed at $631.97, down 0.33%, after opening at $640.11 and reaching a high of $640.37 before selling off to a low of $629.29 in what was a lower volume session that saw initial strength give way to afternoon weakness. SPY is trading near our model's first support at $630 as concerns about inflation persistence and Federal Reserve policy continue to weigh on sentiment. A break above the first resistance at $635 targets $639, while a failure of the first support at $630 opens the door toward $629, and if the lowest support at $621 breaks there is little to keep price from falling toward the next round number below. SPY has broken below the critical $640 structural support level, signaling potential for a deeper correction. Until price reclaims $640 with conviction, rallies should be treated with caution. Absent a catalyst, resistance sits at $635, $639, $640, $642, while support rests at $630, $629, $625, $621. We favor buying dips at $630 given the oversold conditions near support. Bitcoin gained 0.77% to close below $66,460 while MAG stocks showed mixed action with Meta leading the upside at 2.03% while Tesla dragged down the group with a 1.81% decline. The VIX dropped 1.42% to 30.61, suggesting some reduction in fear though elevated levels indicate ongoing caution among investors. SPY closed below the lower trend channel line, signaling potential for further downside toward structural support near $625.
Market State Indicator (MSI) Forecast
Current Market State Overview:
The MSI ended Monday in a Bearish Trending Market State with SPY closing at $631.97. Since SPY closed well below MSI support, the $633.46 level that served as support now becomes resistance for Tuesday's session, with the new resistance at $633.46 and resistance remaining at $634.57. Extended targets printed below at the close, providing clear directional guidance for the overnight session. The MSI rescaled several times during the session from bearish to bullish to bearish with the MSI closing in a bearish state, creating a narrow $1.11 spread between the MSI levels, indicating tight consolidation within the bearish framework. Monday's session demonstrated volatile price action as the MSI rescaled multiple times while extended targets below were visible during the AM session, PM session, and into the close. The narrow MSI range shows price is consolidating within tight parameters despite the bearish posture, suggesting less conviction in the downward momentum. The MSI forecast for Tuesday calls for likely sideways to possibly up as the narrow bearish MSI suggests consolidation rather than strong trending. That said, the bears are likely to maintain pressure to the downside. Any failure of MSI support is likely to see SPY retest the day's lows. MSI support is $633.46 with resistance at $634.57.
Key Levels and Market Movements:
Friday we stated, "Bulls want to hold current levels overnight and push toward $639," and added, "bears want to see the $635.18 resistance hold to press price toward lower levels around $630," while also noting, "Given the wide $4.23 MSI spread and Friday's sharp 1.69% decline, Monday is expected to continue the downward pressure as the bearish framework maintains control." Monday's session initially validated the bearish framework as SPY opened at $640.11 but faced immediate selling pressure that drove price substantially lower throughout the day. The market started with modest premarket activity but the bears maintained control during regular session, with the MSI rescaling several times from bearish to bullish to bearish as price declined from the opening high of $640.37 to a session low of $629.29. The initial setup was selling any rally to the flipped MSI resistance levels, followed by additional opportunities as the narrow range tightened and price repeatedly tested both boundaries during the volatile session. With SPY trading well below the MSI range by the close, the narrow $1.11 spread provided tight resistance levels while extended targets printing below during the AM session, PM session, and into the close offered directional guidance for the sustained move lower. Trading volume surged to 92.48 million shares, higher than average, indicating strong participation as the VIX dropped 1.42% to 30.61 despite the decline. The session represented a continuation of bearish pressure with Monday's 0.33% decline demonstrating how selling pressure persisted even as volatility subsided. At minimum it was a two-for-two session for traders following the framework as the MSI provided clear signals with the support-turned-resistance flip and extended targets below guiding entries throughout the decline. It was a volatile but readable day with substantial setups, all identified through proper context, patience, and flexibility while leveraging the MSI, premarket levels, and market structure rather than forcing trades. The MSI continues to prove its reliability as the cornerstone of our trading process.
Trading Strategy Based on MSI:
Tuesday has light economic news with JOLTS Job Openings which can introduce some volatility around the data release, but the narrow bearish MSI suggests the market is likely to move more sideways than trend given the tight consolidation at the close. With such a narrow $1.11 range it is also likely the MSI rescales overnight and a short squeeze ensues which will push price back to test higher levels. Bulls want to hold current levels overnight and push toward $635, while bears want to see the $633.46 resistance hold to press price toward lower levels around $629. Given the narrow $1.11 MSI spread and Monday's modest 0.33% decline, Tuesday may continue the downward pressure but is equally likely to see a relief rally as the narrow spread suggests price is coiling for a larger move in either direction. Any rally toward MSI resistance at $633.46 becomes a key shorting opportunity where the flipped support-turned-resistance needs to hold for bears to maintain control, while any successful reclaim of $633.46 with volume would signal a potential shift back toward neutral conditions. The narrow spread indicates less conviction in the bearish move, and with SPY having fallen well below the MSI range, any bounce attempt will face immediate resistance at the $633.46 level that previously served as support. A successful test and rejection at $633.46 would offer a short setup targeting lower levels around $629, while any breakout above both $633.46 and $634.57 with conviction presents a potential long opportunity targeting higher levels as a relief rally develops. However, if bears can maintain pressure below $633.46, it would confirm the continued bearish momentum and target a retest of Monday's $629.29 low with potential for further downside. The narrow MSI spread with extended targets below at the close indicates consolidation rather than strong trending, and until that changes, the flipped resistance at $633.46 remains the key level to watch. Bulls need to reclaim $633.46 decisively to shift momentum, while bears want to see any rally fail at that resistance level to maintain the downward trajectory from Monday's session. The long-term bull trend remains intact above $640 and failed breakouts and failed breakdowns continue to offer the highest-probability setups. Remain flexible, avoid trading during Ranging Market States unless a clear failed breakout or breakdown presents itself, and ensure all trades are fully aligned with MSI signals. Providing real-time insights into market control, momentum shifts, and actionable levels, the MSI when integrated with our Pre-Market and Post-Market Reports continues to sharpen execution precision and elevate trade quality. If you haven't yet integrated MSI and our model levels into your process, now is the time. Contact your representative to get started as these tools are designed to support consistency and enhance performance.
Dealer Positioning Analysis
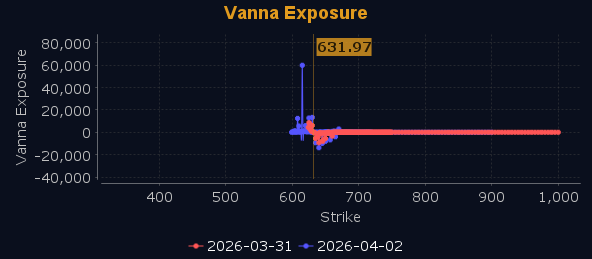
Dealers are selling SPY $642 to $652 and higher strike Calls while buying $637 to $641 Calls, indicating the Dealers' desire to participate in any rally on Tuesday. The ceiling for Tuesday appears to be $642. To the downside, Dealers are buying $630 to $610 and lower strike Puts in a 4:1 ratio to the Calls they're selling/buying displaying moderate concern that prices could move lower. Dealers are selling $632 Puts however. Dealers do not sell ATM Puts unless they believe there is a floor in the market at $632. Dealer positioning is relatively calm suggesting a controlled session with consolidation and remains unchanged at bearish.
Looking Ahead to Next Friday:
Dealers are selling SPY $645 to $658 and higher strike Calls while buying $641 to $644 Calls, indicating the Dealers' desire to participate in any rally next week. The ceiling for the week appears to be $645. To the downside, Dealers are buying $630 to $610 and lower strike Puts in a 6:1 ratio to the Calls they're selling/buying displaying heightened concern that prices could move lower. Dealers remain heavily bearish with downside risk outweighing any potential relief rally. Dealers are selling $632 Puts however, suggesting some floor support at $630. For the week Dealer positioning is unchanged at bearish. We advise reviewing Dealer positioning daily for directional clues. These positions evolve quickly and tracking them is essential for staying ahead of shifting market sentiment.
Recommendation for Traders
With SPY closing at $631.97 after testing support near $629 and VIX dropping to 30.61, traders should look for long opportunities around the $630-632 support zone with stops below $629. Any strength back toward $635-637 offers potential short entries, especially if volume remains elevated and the move lacks conviction.
Keep position sizes manageable given the recent volatility and stick to tight risk management protocols. Be sure to review the premarket analysis posted before 9 AM ET for any changes in the model's outlook and Dealer Positioning.
Good luck and good trading!
