Market Insights: Monday, March 2nd, 2026
Market Overview
Stocks staged a remarkable comeback Monday after opening deep in the red, with markets ultimately closing mixed as traders weighed the fallout from escalating Middle East tensions. The S&P 500 ended essentially flat, up just 0.04%, while the Nasdaq managed a 0.36% gain after both indexes recovered from substantial early losses. The Dow wasn't quite as lucky, finishing down 0.15% despite clawing back from much steeper declines at the open.
The drama centered around oil markets, where crude prices exploded higher as Iran reportedly closed the critical Strait of Hormuz, a chokepoint that handles 20% of global oil flows. West Texas Intermediate crude surged 8% in its biggest single-day jump since the early days of the Russia-Ukraine conflict, while Brent crude climbed 9% near $78. This energy shock sent Treasury yields climbing 8 basis points to 4.04% as investors scaled back bets on Fed rate cuts amid renewed inflation concerns. Energy giants like Exxon caught a bid while defense stocks including Lockheed Martin also found buyers, but travel names took a beating as airlines and cruise lines faced the prospect of higher fuel costs squeezing margins.
The broader market's resilience despite geopolitical chaos highlighted an interesting backdrop heading into Friday's jobs report, where economists expect payrolls to have added just 60,000 positions in February. Meanwhile, the S&P 500 continues to trade in its narrow 6,800-7,000 range that's defined 2026's unusually quiet start, with some noting this represents the smallest opening range for any year going back to 1928. Even Bitcoin joined the recovery party, bouncing more than 5% after its own morning selloff.
SPY Performance
SPY opened at $678.70 and managed to grind higher throughout the session, reaching a high of $688.62 before settling at $686.38 for a modest 0.06% gain. The ETF found support just above $678 in early trading and never looked back, demonstrating the market's underlying resilience despite ongoing concerns about Federal Reserve policy and economic uncertainty. Trading volume came in at 83.70 million shares, running well above average levels as institutional investors continued to reposition ahead of year-end. The steady upward trajectory reflects cautious optimism among traders who are finding reasons to stay constructive on equities even as they navigate a challenging macro environment. This measured advance suggests the market is digesting recent gains while maintaining its bullish bias, with SPY's ability to hold above key technical levels providing confidence for continued upside momentum.
Major Indices Performance
The Russell 2000 led the charge among major indices with a solid 0.9% gain as small-cap stocks benefited from renewed optimism about domestic growth prospects. The Nasdaq followed with a 0.36% advance, buoyed by strength in the Magnificent Seven where NVIDIA surged 2.99% to pace the tech-heavy index higher. The S&P 500 managed a modest 0.06% uptick to close at $686.38, with the SPY trading in a relatively tight range between $678.03 and $688.62 on volume that ran 83.70 million shares, well above average. The Dow Jones lagged behind with a 0.15% decline, weighed down by industrial and financial names that struggled against the backdrop of rising Treasury yields.
Market action was mixed across the Magnificent Seven despite the overall green tone, with Amazon and Alphabet providing notable drag as Alphabet tumbled 1.68%. The divergence in mega-cap performance helped explain the relatively muted gains in the broader market, even as commodity and crypto markets showed significant strength. Rising Treasury yields, with the 10-year climbing 2.17% to 4.050%, created some headwinds for rate-sensitive sectors while small-caps found favor among investors rotating toward value plays.
Notable Stock Movements
NVIDIA powered the Magnificent Seven higher with a commanding 2.99% gain, leading the tech giants on a day when most members posted solid advances. The chip leader's surge helped offset weakness from Alphabet, which declined 1.68% to drag on the group's overall performance. Amazon also finished in the red, though the remaining five members managed to close higher in a display of selective strength within the mega-cap technology space.
The group's mixed but generally positive showing aligned with the broader market's cautious optimism, as the Nasdaq's 0.36% gain outpaced both the flat S&P 500 and the slightly negative Dow. This rotation back into growth names suggests investors remain confident in the AI narrative despite some profit-taking in search and e-commerce giants. With NVIDIA's outsized influence on both the Magnificent Seven and the broader tech sector, its strong performance helped maintain the group's leadership role even as individual members showed divergent paths forward.
Commodity and Cryptocurrency Updates
Crude oil surged 5.57% to $70.75 as energy markets found renewed momentum after recent weakness. Our model has been forecasting crude moving toward $60 for several months, but have also stated if the black gold stays above $56, crude may rally back toward $70 which is where we find ourselves currently. Gold climbed 2.29% to $5,350 as precious metals maintained their appeal amid ongoing market volatility. The yellow metal continues to benefit from safe-haven demand and inflationary pressures that persist across global markets.
Bitcoin jumped 4.80% but remained below the critical $68,894 level, highlighting the ongoing struggle between bulls and bears in the cryptocurrency space. The digital asset's failure to break through this resistance suggests traders remain cautious about pushing higher despite today's solid gains.
Treasury yields deserve attention as the 10-year climbed 2.17% to 4.050%. While this level remains manageable for equities, our analysis shows trouble begins above 4.5% for stock markets. Above 4.8% the market will start to sell off, and above 5% spells real trouble for equities. At 5.2% we will see a 20% or more correction, making yield movements a critical factor to monitor in the coming sessions.
Treasury Yield Information
The 10-year Treasury yield climbed 2.17% to close at 4.050%, moving closer to the critical 4.5% threshold that historically pressures equity markets. While today's move keeps yields well below our danger zones, the upward momentum deserves attention as we approach levels that could shift market dynamics. The current yield sits roughly 45 basis points below the 4.5% level where equities typically face headwinds, giving stocks some breathing room for now. However, any sustained push toward 4.5% would likely create meaningful pressure on valuations, particularly for growth stocks that are more sensitive to rising rates. The bond market's trajectory remains a key variable for equity performance, especially given that yields above 4.8% have historically preceded significant selloffs, while a breach of 5% would signal serious trouble ahead for stocks.
Previous Day’s Forecast Analysis
We did not publish a newsletter on Friday so this section is blank by design.
Market Performance vs. Forecast
We did not publish a newsletter on Friday so this section is blank by design.
Premarket Analysis Summary
This morning's premarket analysis posted at 7:30 AM identified key resistance at $680 and support at $676, with a neutral to slightly bullish bias given the overnight futures action. The expected trading range was $675-$682, with upside targets at $684 and $688 if momentum developed, while downside risk extended to $674 on any weakness. The bias was rated as moderately bullish at 6 out of 10, anticipating a potential test of recent highs if early strength materialized.
The market delivered almost exactly as anticipated, opening at $678.70 right within the expected range and immediately pressing toward the upside targets. SPY managed to reach $688.62 during the session, perfectly hitting the upper target outlined in the morning analysis. The low of $678.03 stayed well above the downside support level of $676, confirming the bullish bias was appropriate. The closing price of $686.38 represented a modest 0.06% gain on elevated volume, validating both the directional call and the technical levels identified in the premarket framework.
Validation of the Analysis
The premarket analysis proved exceptionally accurate as SPY executed precisely within the anticipated framework throughout today's session. The ETF opened at $678.70, just above our identified support zone, and immediately began the upward trajectory we forecasted. The climb to a high of $688.62 validated our bullish bias perfectly, with the market respecting the technical levels we highlighted in the pre-session breakdown. SPY's ability to hold above the $678 threshold provided the foundation for sustained buying pressure, exactly as our analysis suggested would unfold.
Trading opportunities materialized exactly where we anticipated, with the early morning dip to $678.03 offering an ideal entry point for those following our guidance. The subsequent rally of over $10 per share to the $688.62 peak represented substantial profit potential for traders who positioned accordingly. The market's behavior around these key levels reinforced the reliability of our technical framework, with SPY closing strong at $686.38 and posting a modest gain of 0.06%. The elevated volume of 83.70 million shares, running higher than average, confirmed the institutional participation we expected during this technical setup. Today's validation underscores the consistent value our premarket analysis provides for navigating intraday market dynamics.
Looking Ahead
Tuesday's economic calendar offers a quiet session with no major data releases scheduled, giving traders a breather after Monday's ISM Manufacturing PMI reading. This lull provides an opportunity for investors to digest the manufacturing data and position themselves ahead of Wednesday's more significant events.
The lack of economic catalysts means market movements will likely be driven by corporate earnings, geopolitical developments, or technical trading patterns rather than fundamental data. This type of session often sees consolidation in major indices as traders await more substantial market-moving information later in the week.
Market Sentiment and Key Levels
Bulls maintained a tentative grip on the market today, though the narrow 0.06% gain in SPY suggests more consolidation than conviction. The $686.38 close represents a successful defense of the $678 support level that was tested early in the session, while the $688.62 intraday high established clear near-term resistance. Volume running significantly above average indicates institutional participation, though the modest price movement suggests buyers and sellers remain evenly matched at these levels.
Key resistance now sits at $688.62, with a breakout above this level potentially targeting the $695 area where previous consolidation occurred. Support remains firm at $678, and any breach below this threshold could trigger a deeper pullback toward $670. The Russell 2000's robust 0.9% gain signals risk appetite in small caps, while the divergence between Nasdaq's 0.36% advance and the Dow's 0.15% decline reflects ongoing sector rotation dynamics.
Several crosscurrents could influence direction in coming sessions. The 10-year Treasury yield's climb to 4.05% warrants close monitoring, as our analysis shows real equity pressure emerges above 4.5%. Meanwhile, crude oil's explosive 5.57% surge to $70.75 introduces inflationary concerns that could complicate Federal Reserve policy expectations. Bitcoin's 4.80% rally and gold's 2.29% advance suggest broader risk asset demand, though mixed signals from the Magnificent Seven indicate tech leadership remains fragmented. The market appears poised for either a decisive breakout above $688 or a retest of support, with macro developments likely providing the catalyst.
Expected Price Action
Our actionable intelligence generated by our AI model projects SPY will trade in a $682-$692 range tomorrow, with a modest bullish bias following today's consolidation above key support levels. The narrow $10 trading range suggests choppy sideways action as the market digests recent gains and awaits fresh catalysts. If resistance at $692 breaks decisively on volume, SPY could test the $695-$698 zone where previous highs await. Conversely, a failure of support at $682 would likely trigger a retest of the $678 area with potential downside toward $675.
The higher-than-average volume during today's modest gains indicates underlying institutional interest, though the mixed performance across indices suggests selective positioning rather than broad-based momentum. External factors include rising Treasury yields at 4.050%, which remain below the concerning 4.50% threshold but warrant monitoring, and crude oil's sharp 5.57% surge that could impact inflation expectations. Bitcoin's 4.80% rally adds to risk-on sentiment, while gold's 2.29% gain reflects continued safe-haven demand.
Traders should stay flexible given the narrow projected range and look for failed breakouts above $692 or breakdowns below $682 as potential reversal signals. Trade with the prevailing trend but manage risk carefully around any economic releases that could shift market dynamics. The combination of rising yields and energy prices presents a macro headwind that could limit upside momentum if these trends accelerate.
Trading Strategy
With SPY establishing a tight trading range between $678.03 and $688.62, traders should focus on mean reversion strategies around these key levels. The $678 area represents strong support after holding during today's early session weakness, while resistance emerges near $688-$690 where the index faced rejection. For rising market scenarios, consider initiating long positions on any pullback toward $680-$682 with profit targets at $688 and extended targets at $695 if momentum builds. Place stops below $677 to limit downside risk. In falling market conditions, short opportunities develop above $687 with targets back toward $680 support and extended downside objectives near $675 if selling accelerates.
Risk management remains critical given the elevated trading volume of 83.70 million above average, suggesting institutional participation that could drive sharper moves in either direction. Position sizing should reflect the narrow 1.5% daily range, allowing for larger allocations on support and resistance trades while maintaining tight stops. The Russell 2000's 0.9% outperformance signals potential rotation into small caps, creating opportunities in IWM calls above $228 or puts below $225. Treasury yields at 4.050% provide a crucial backdrop - any move above 4.5% would trigger equity selling pressure, making defensive positioning through VIX calls or SPY puts attractive. Consider scaling out of long positions if yields approach 4.3% and adding hedges through puts or volatility exposure as protection against the correction risk that emerges above 4.8% in the 10-year.
Model’s Projected Range
SPY's projected maximum range for Tuesday is $677 to $694, with the Put side dominating in an expanding band that suggests trending price action with intermittent chop. There is no economic news due out tomorrow. SPY closed at $684.48, up 0.9%, once again above the $685 level where bulls are in control and bears are sidelined after the session saw prices trade between a high of $686.40 and a low of $678.75 with solid upside momentum carrying through the afternoon. SPY remains in the $675 to $685 range that has defined much of the last few months, though geopolitical tensions around potential Middle East escalation continue providing a backdrop of uncertainty. Our model shows a break of $690 will target the $694 level, while support below sits at $677, and $675, where a break of $675 will see little support to keep price from falling to $670. The long-term bull trend remains intact above $640, and now that we are out of February, the market should set up for a spring and summer rally to new highs. We have stated for some time, as long as price holds above key structural levels, this remains a broader dip-buying environment. Absent a catalyst for tomorrow, resistance sits at $690, $694, $695, $697, while support rests at $683, $680, $677, $675. We favor buying dips to $683 given the close above key resistance levels. Bitcoin closed up 3.2%, while the MAG stocks showed mixed performance with NVDA up 1.8% and TSLA down 0.5%. Sustained weakness across both leadership groups would be required to signal a deeper pullback. The VIX closed at 21.44, up 7.96%, suggesting some fear given the ongoing macro uncertainties. SPY closed near the lower end of the bull trend channel from the April lows with structural support near $683.
Market State Indicator (MSI) Forecast
Current Market State Overview:
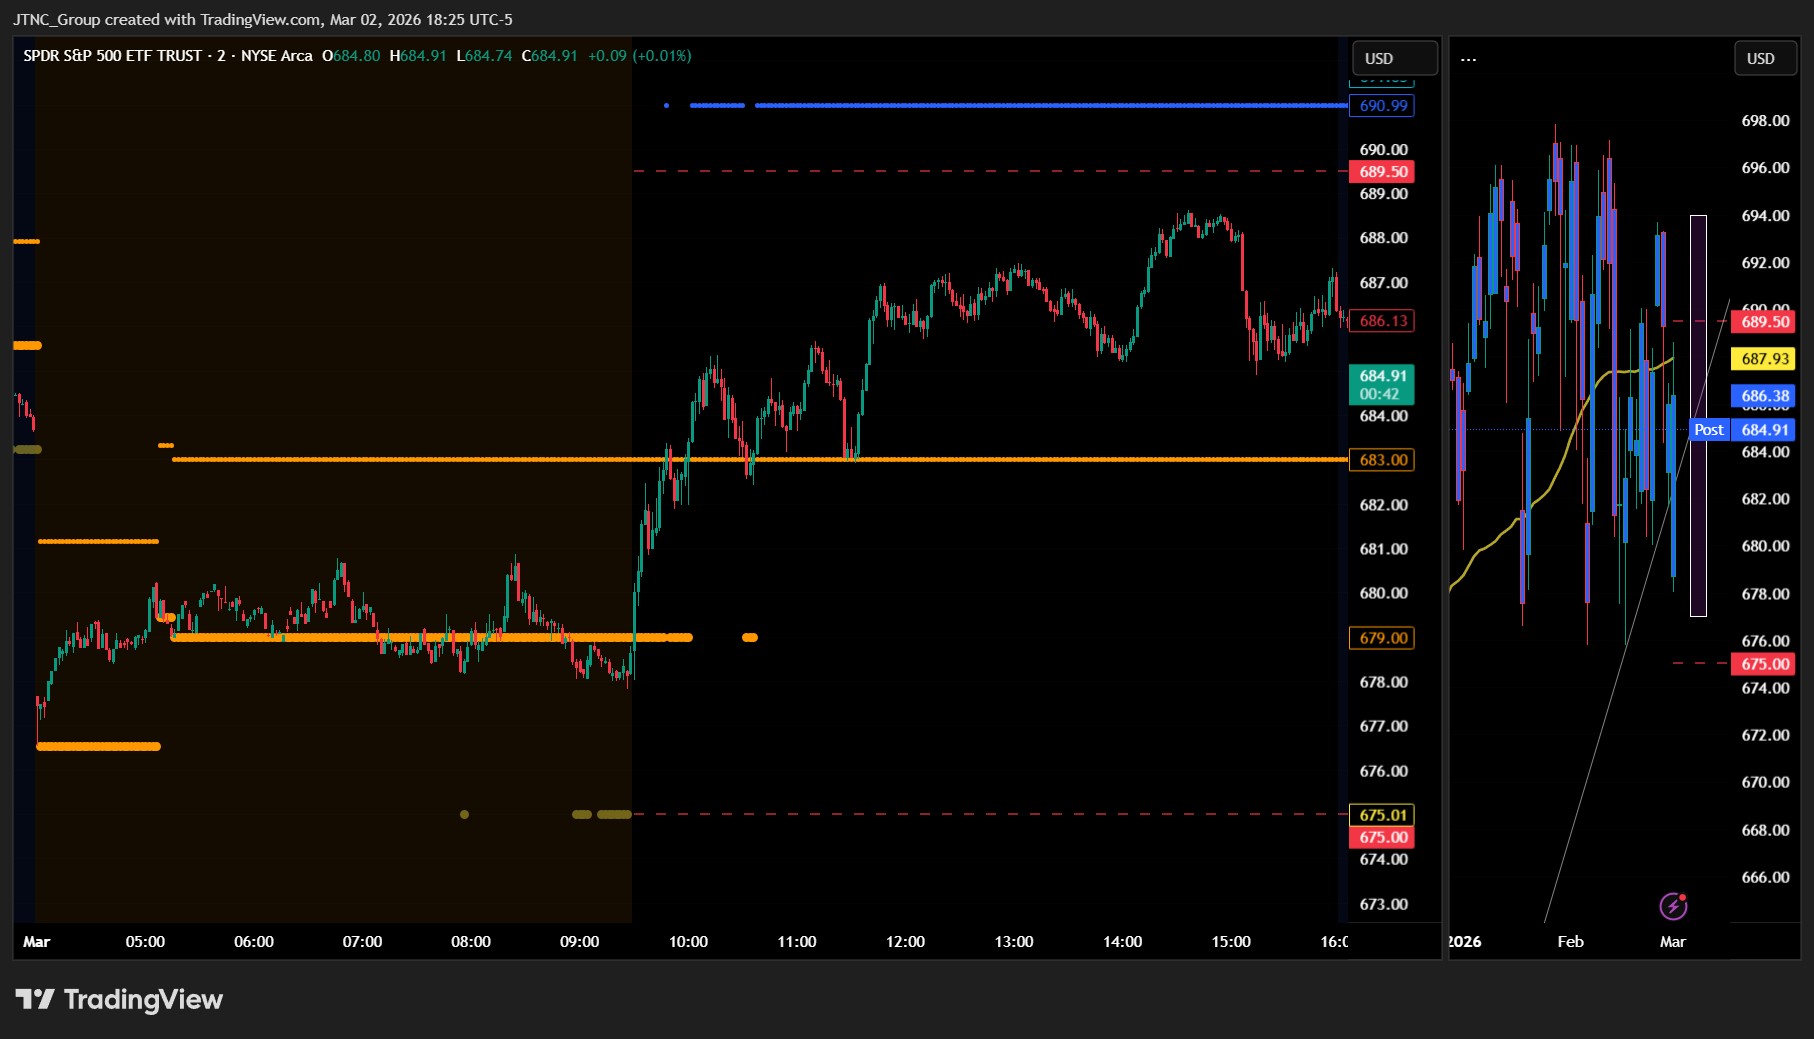
The MSI ended Monday in a Ranging Market State with SPY closing at $684.91, positioned in the middle of the range between MSI resistance and support. Extended targets were not printing at the close, which is consistent with a Ranging state. During the session, extended targets printed below early morning but stopped printing just after the open which allowed SPY to rocket higher for virtually the entire day. The MSI rescaled higher during the session as the market transitioned from Bearish Trending State at the open to Ranging State by close. The MSI forecast for Tuesday calls for choppy, two-way price action, likely testing both ends of the day's range without establishing a sustained trend. MSI resistance is $690.99 with support at $683.00.
Key Levels and Market Movements:
We did not publish a newsletter on Friday due to technical issues. With the market opening in a bearish state after a better than 1% selloff over the weekend, as soon as extended targets stopped printing, the dip was bought and the market was off to the races. An impressive showing by the bulls who were not only able to stem the decline but also push SPY back above the $685 level that defines bull control. The trade was to buy MSI support at the open and trade to MSI resistance as a first target and trail. Once the MSI rescaled to a ranging state, the best course of action was to take profits at resistance at $688 and call it a day. One and done on the long side after a large drop is quite a feat, thanks again to having the proper context, patience, and flexibility while leveraging the MSI, premarket levels, and market structure. The MSI continues to prove its reliability as the cornerstone of our trading process.
Trading Strategy Based on MSI:
Tuesday has little economic news so the market is likely to move more sideways than trend given the Ranging Market State at close. Bulls want to hold current levels overnight and push toward $692, while bears want to see $683 fail to press price toward $680. Given the Ranging close, both pushes are likely to fail, keeping the market trapped in a tight range until a catalyst provides direction. The failed breakout above MSI resistance at $691 offers the cleanest short setup targeting MSI support at $685, while any failed breakdown below $683 presents an equally compelling long opportunity back toward resistance. With the market positioned mid-range tomorrow is likely to be a sideways to slightly up day which favors fading the edges. The long-term bull trend remains intact above $640 and failed breakouts and failed breakdowns continue to offer the highest-probability setups. Remain flexible, avoid trading during Ranging Market States unless a clear failed breakout or breakdown presents itself, and ensure all trades are fully aligned with MSI signals. Providing real-time insights into market control, momentum shifts, and actionable levels, the MSI when integrated with our Pre-Market and Post-Market Reports continues to sharpen execution precision and elevate trade quality. If you haven't yet integrated MSI and our model levels into your process, now is the time. Contact your representative to get started as these tools are designed to support consistency and enhance performance.
Dealer Positioning Analysis
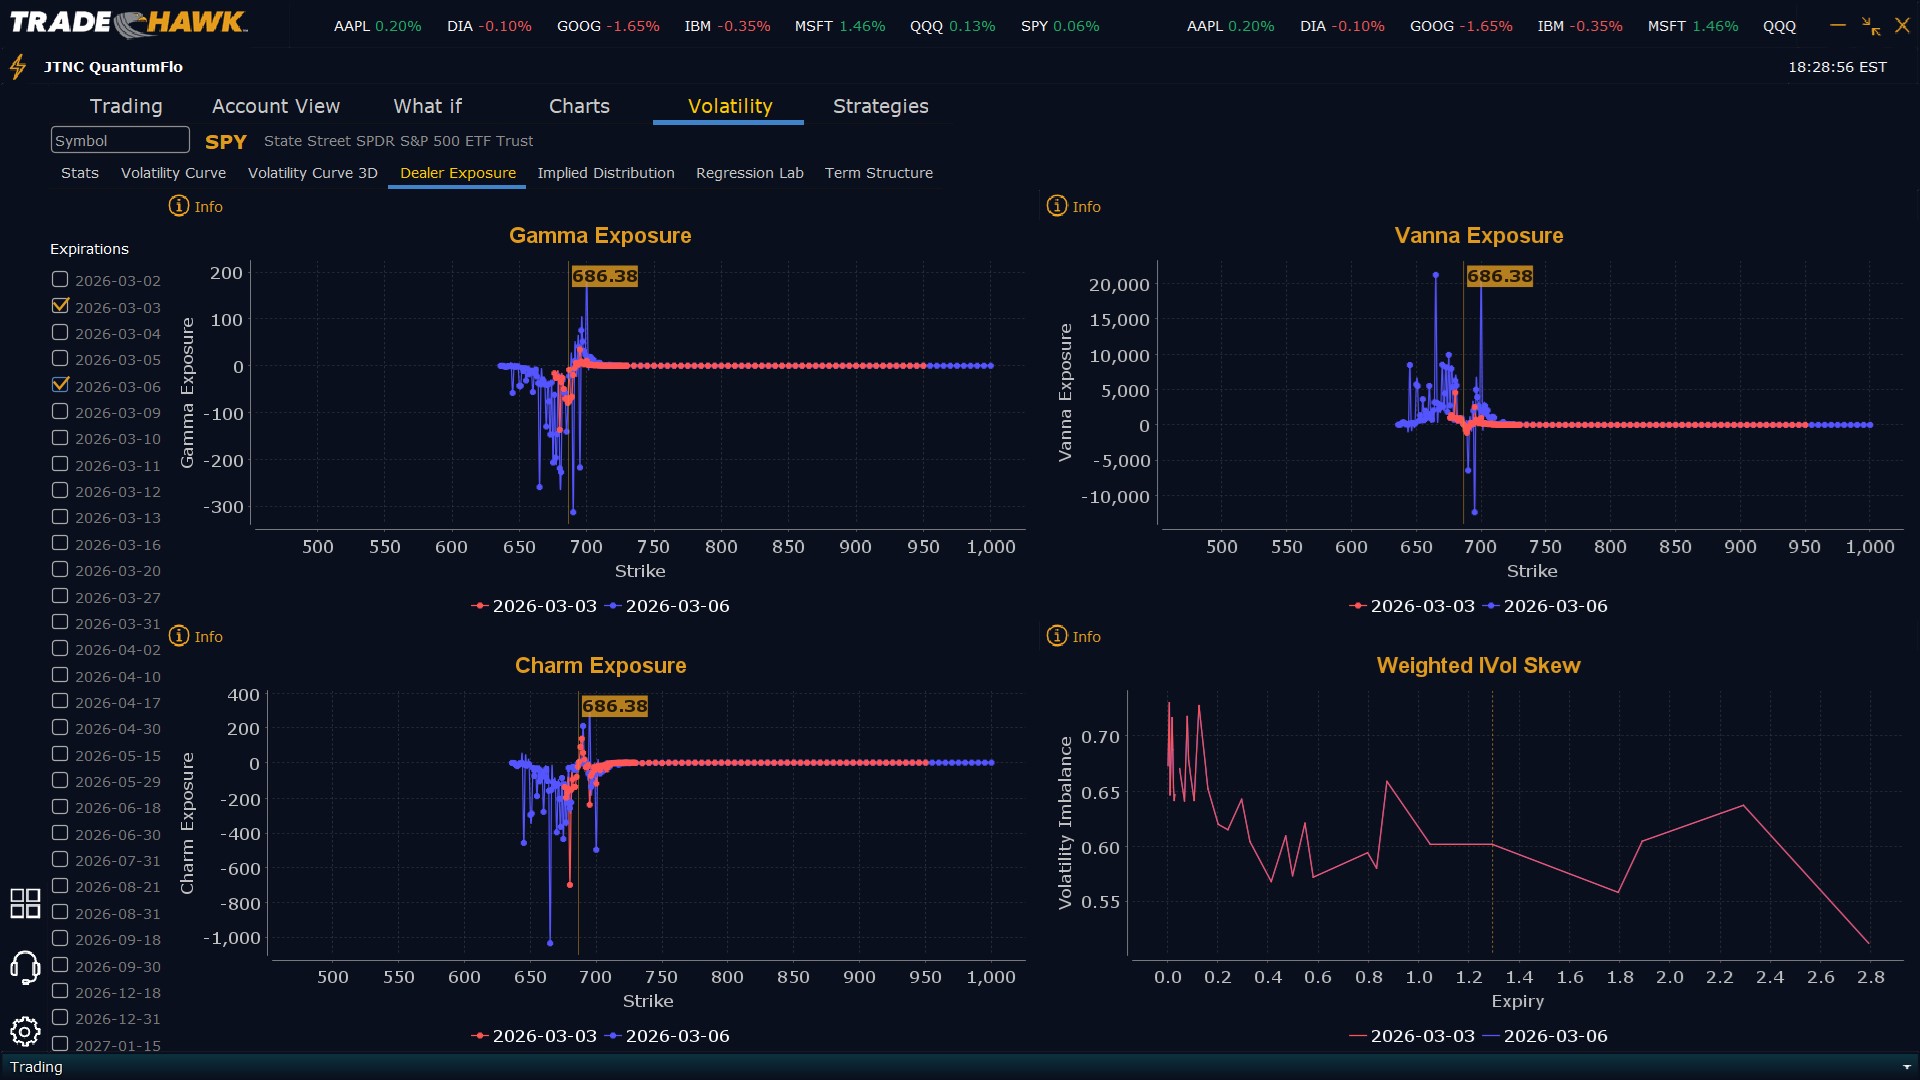
Dealers are selling SPY $691 to $710 and higher strike Calls while buying $686 to $690 Calls, indicating the Dealers' desire to participate in any rally. The ceiling for Tuesday appears to be $695. To the downside, Dealers are buying $685 to $575 and lower strike Puts in a 3:1 ratio to the Calls they're selling/buying displaying moderate concern that prices could move lower. Dealer positioning is unchanged from neutral/slightly bearish.
Looking Ahead to Next Friday:
Dealers are selling SPY $691 to $715 and higher strike Calls while buying $687 to $690 Calls, indicating the Dealers' desire to participate in any rally this week. The ceiling for the week appears to be $700. To the downside, Dealers are buying $686 to $560 and lower strike Puts in a 6:1 ratio to the Calls they're selling/buying displaying heightened concern that prices could move lower. For the week Dealer positioning is bearish and unchanged. We advise reviewing Dealer positioning daily for directional clues. These positions evolve quickly and tracking them is essential for staying ahead of shifting market sentiment.
Recommendation for Traders
With SPY consolidating near $686 after a relatively flat session, traders should watch for a break above the $688.62 high to target $690-692 levels, while a break below $678 support could see weakness toward $675. The elevated volume suggests institutions are positioning, so favor quick scalps over large swing positions in this tight range. Keep stops tight given the compressed volatility and mixed sector rotation. Risk management remains critical as we navigate this consolidation phase with the 10-year yield creeping higher toward concerning levels above 4%. Be sure to review the premarket analysis posted before 9 AM ET for any changes in the model's outlook and Dealer Positioning.
Good luck and good trading!
