Market Insights: Friday, March 27th, 2026
Market Overview
US stocks tumbled Friday as the Dow joined the Nasdaq in correction territory, with all major indices extending their brutal losing streaks despite President Trump's decision to postpone strikes on Iran's power infrastructure. The S&P 500 dropped 1.7% for its fifth consecutive week of declines — the longest streak since 2022 — while the Nasdaq plunged 2.1% deeper into correction territory and the Dow fell 1.7% to officially enter correction status. The Magnificent Seven collectively shed over $330 billion in market cap as Big Tech bore the brunt of selling, with Nvidia, Amazon, and Tesla all declining while Meta continued to face pressure from Thursday's landmark social media addiction ruling.
Oil prices remained the dominant market driver, with Brent crude holding above $105 per barrel and WTI approaching $100 despite Trump's diplomatic overture extending Iran's compliance deadline by 10 days until April 6. The sustained energy surge has investors worried about persistent inflation and a more hawkish Federal Reserve, sending bond yields higher and crushing growth stocks. Bitcoin joined the risk-off mood, dropping 4% to around $66,650 and erasing nearly all its war-related gains as traders faced $14 billion in options expirations and ETF outflows, while gold futures rebounded 3% though still headed for their fourth straight weekly decline.
SPY Performance
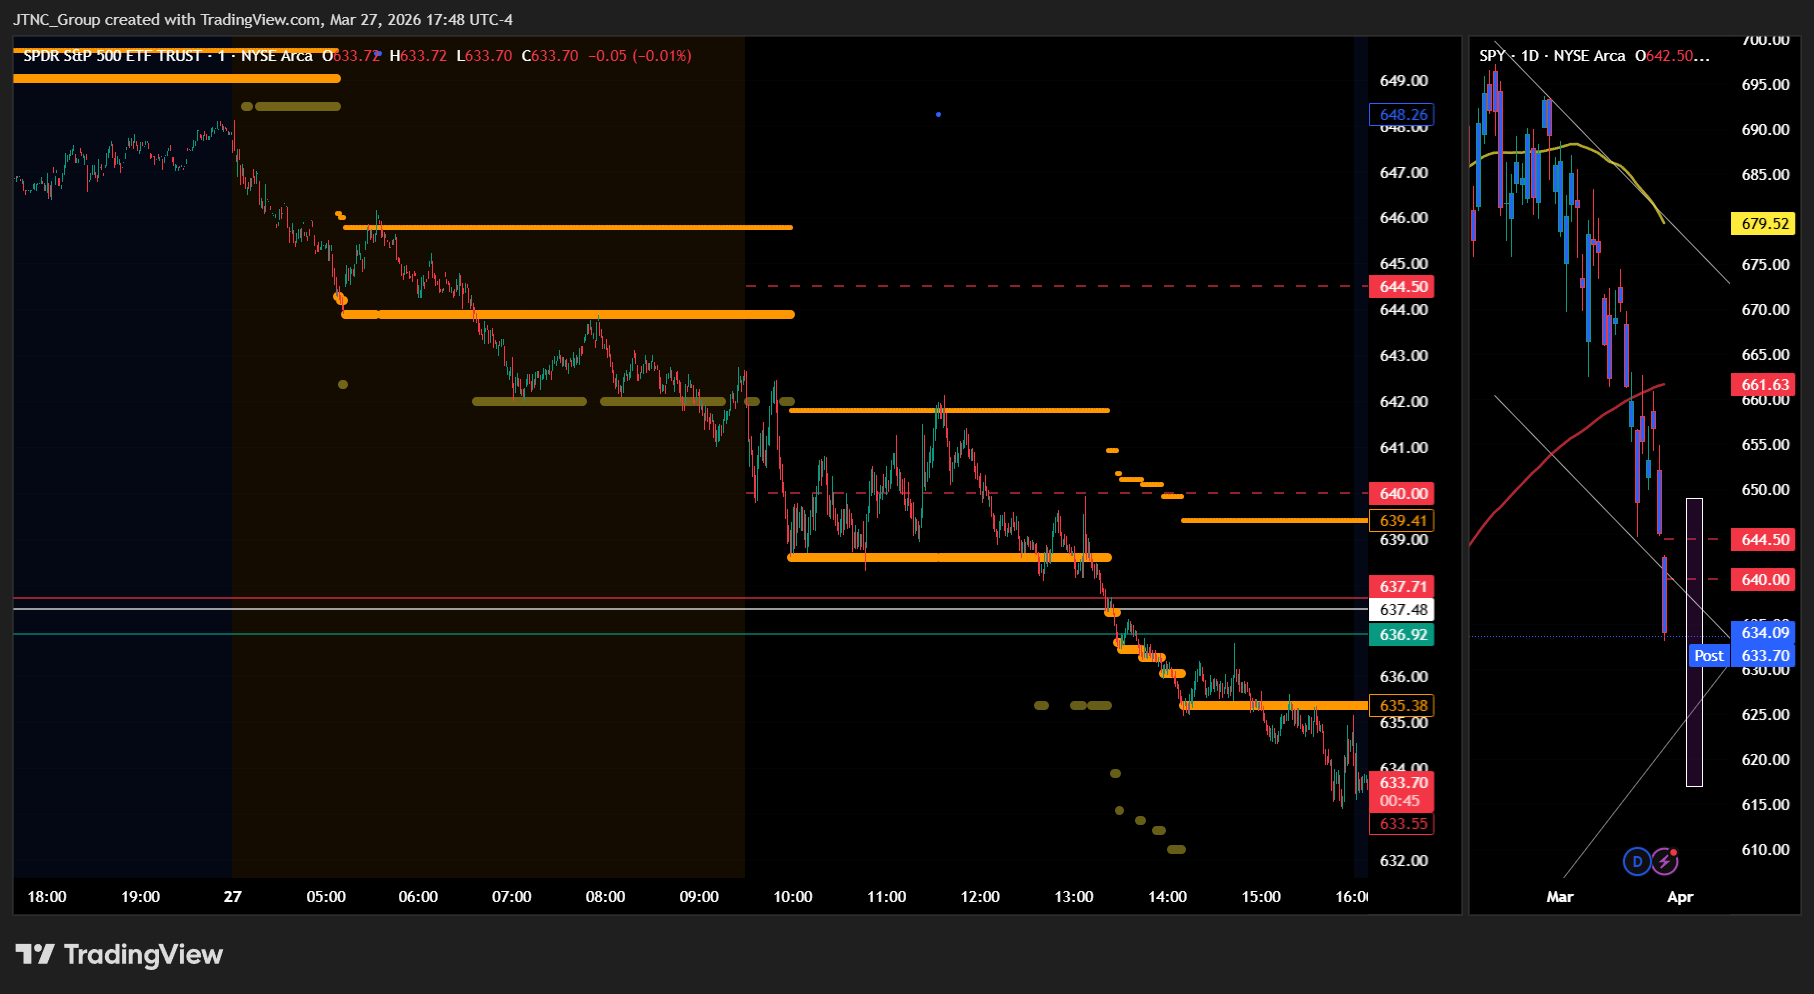
SPY opened at $642.50 and immediately encountered aggressive selling that overwhelmed any attempts at stabilization, with the benchmark ETF failing to hold even modest gains above its opening price as bearish momentum carried over from the previous session's weakness. The selling pressure intensified from the opening minutes, preventing SPY from establishing any meaningful support near the $642 level and creating a tone of persistent negativity that would define the entire trading session as participants continued to reduce equity exposure. The downward spiral accelerated throughout the day, ultimately driving SPY to a session low of $633.10 and establishing a $9.56 trading range that underscored the severity of the institutional selling as the ETF broke through multiple technical support levels without finding buyers willing to step in. The decline pushed SPY decisively below the $640 threshold, marking another significant breach of what had been viewed as an important psychological level and suggesting that the recent downtrend was gaining dangerous momentum with little in the way of meaningful support visible on the charts. SPY closed at $634.18, recording a substantial 1.69% loss that extended the recent string of negative sessions and left the ETF at its lowest levels in weeks, with the persistent selling raising serious concerns about whether any sustainable bounce could develop in the near term. Volume climbed to 92.76 million shares, well above average levels and confirming that the day's decline was driven by genuine institutional distribution rather than technical or liquidity-related factors, though the elevated activity also indicated that some market participants were actively engaging with the weakness. The VIX surged 14.40% to 31.39, reflecting a sharp escalation in fear levels as defensive positioning intensified and investors sought protection against continued downside risk, with the elevated reading signaling that market anxiety had reached concerning levels not seen in recent months.
Major Indices Performance
The Nasdaq led the decline with a 2.15% drop, as technology-heavy names bore the brunt of selling pressure amid rising yields and profit-taking in growth stocks. The Russell 2000 fell 1.86%, with small-cap stocks showing vulnerability to the deteriorating risk sentiment and concerns about their sensitivity to higher borrowing costs. The Dow posted a 1.73% decline, demonstrating slightly better resilience as blue-chip names provided some defensive characteristics during the broad-based selloff.
The performance hierarchy reflected classic risk-off dynamics, with growth-oriented technology stocks in the Nasdaq facing the heaviest punishment while established dividend-paying companies in the Dow showed relatively modest weakness. The Russell 2000's position between the other indices highlighted the mixed pressures facing small-cap names, which struggled with both growth concerns and their domestic focus amid uncertain economic conditions. The widespread nature of the declines across all major indices underscored the broad-based selling pressure that dominated the session, with no sector providing meaningful refuge for investors seeking stability.
Notable Stock Movements
Meta dominated the Magnificent Seven's decline with a punishing 3.99% drop that established the social media giant as the session's most devastating performer within this influential group and demonstrated how concentrated selling pressure among technology leaders can amplify broader market stress during periods of heightened volatility and deteriorating investor sentiment. The company's brutal performance exemplified the group's vulnerability to risk-off conditions, as institutional money managers appeared to target these mega-cap names with aggressive selling that contributed meaningfully to the session's challenging trading environment and reinforced negative momentum across growth-oriented equities.
The Magnificent Seven delivered another predominantly red performance that perfectly mirrored the broader market's significant weakness, as most members posted losses that intensified technology sector pressure while their collective struggle weighed heavily on the Nasdaq's painful 2.15% decline throughout the session. The group's coordinated weakness reinforced their role as sentiment barometers during periods of market stress, with their substantial index weightings amplifying the day's destructive atmosphere as investors fled growth names in favor of safer positioning amid escalating uncertainty.
The technology titans' broad-based decline highlighted diminishing institutional appetite for these mega-cap leaders in an environment where rising bond yields and elevated volatility continue pressuring high-multiple growth stocks, as the VIX's substantial 14.40% surge to 31.39 reflected escalating fear levels that permeated trading across all major indices. Their performance underscored the challenging dynamics facing growth-oriented equities, where these influential names continue serving as reliable indicators of risk sentiment while their weakness magnifies broader market stress during sessions characterized by defensive positioning and widespread selling pressure.
Commodity and Cryptocurrency Updates
Crude oil surged 5.18% to $99.37, pushing even further above the $70 threshold and continuing to rally well beyond longer-term model expectations for lower price levels. The energy complex remains significantly elevated with fundamental factors providing robust support, and this sustained move above $70 is beginning to complicate Federal Reserve policy as energy prices contribute meaningfully to inflationary pressures across the broader economy. The sharp daily advance reinforces how geopolitical tensions and supply disruption concerns continue propelling crude to levels that challenge central bank efforts to maintain price stability, with the commodity now approaching triple-digit territory.
Gold rallied 3.93% to $4,548, bouncing back from recent weakness as the precious metal found renewed buying interest amid shifting market dynamics. The solid advance represents a recovery from earlier selling pressure, with gold moving back toward historically elevated levels that reflect its enduring appeal as a defensive allocation during periods of uncertainty. The metal's rebound comes as investors reassess portfolio positioning across asset classes, with gold recapturing momentum while maintaining its fundamental role as a hedge against market volatility and inflation concerns.
Bitcoin declined 3.97% to close below $66,058, extending its retreat from recent highs as the cryptocurrency faced continued selling pressure across digital asset markets. The notable pullback reflects broader risk-off sentiment affecting growth-oriented assets, with Bitcoin experiencing weakness alongside traditional equity markets during the session. Despite the decline pushing the digital asset further below key psychological levels, Bitcoin continues demonstrating its established presence within institutional portfolios, though the persistent weakness suggests ongoing volatility as the cryptocurrency navigates challenging conditions across financial markets.
Treasury Yield Information
The 10-year Treasury yield climbed 0.54% to close at 4.440%, inching closer to the critical 4.5% equity pressure threshold and maintaining the dangerous trajectory that has kept markets on edge throughout this volatile period. At 4.440%, yields now sit just 6 basis points below the problematic 4.5% level where sustained trading creates systematic headwinds for stock valuations, a proximity that helps explain today's broad-based equity selloff with the SPY declining 1.69% and the VIX surging 14.40% to 31.39 as Treasury competition intensified. This modest but concerning advance keeps yields firmly entrenched in the danger zone approaching our framework's first critical threshold, where even minor additional strength could breach 4.5% and trigger the systematic equity pressure that historically accompanies sustained trading above this level. Today's market carnage, from the Nasdaq's 2.15% plunge to the Russell 2000's 1.86% decline, demonstrates how sensitive risk assets remain to yield movements at these elevated levels and validates the framework's predictive value as Treasury rates hover near inflection points. The current positioning at 4.440% represents a precarious balance where markets are pricing in the imminent threat of crossing 4.5%, with any sustained breach activating the equity headwinds that create persistent selling pressure across growth and value stocks alike. The immediate focus remains on whether yields can stabilize below the 4.5% threshold or continue their relentless climb toward 4.8% where selling pressure typically accelerates and broader corrections begin to unfold. Should yields push through 4.5% and gain momentum toward 4.8%, markets would enter the selling phase that historically precedes more serious corrections, ultimately threatening the 5% danger zone where real trouble begins and the catastrophic 5.2% level where corrections exceeding 20% become the baseline expectation for equity markets.
Previous Day’s Forecast Analysis
Our prior day's forecast established a cautiously bearish bias with SPY projected to trade in a $645-$657 range, positioning the market near critical decision territory after Thursday's close at $645.17 placed prices at the bottom of the expected zone. The model identified $652.50 as the pivotal bias level where sustained strength above this threshold would fuel rally attempts toward $655 and potentially the $657 ceiling if buying momentum developed. Downside protection centered on $648 support with deeper weakness targeting the $645 floor, while the forecast expected rally attempts to form as prices approached these lower targets.
The trading strategy emphasized the breakdown through key support levels, establishing $645-$647 as critical resistance for short entries targeting moves toward $640-$642 with extended objectives near $635. For bearish scenarios, the approach called for initiating positions on failed rallies below $647 with protective stops above $650. Bullish opportunities required monitoring any recovery above $650 support for long entries targeting $654-$656 with stretch goals toward $661. The elevated VIX at 28.06 favored defensive positioning until market conditions stabilized, with the $640-$650 corridor identified as crucial battleground territory where directional commitment should emerge and risk management protocols employing 3-4 point stop distances from this pivotal range.
Market Performance vs. Forecast
SPY opened at $642.50 well below our projected $645-$657 range, immediately signaling that external catalysts had already driven price action beyond our model's base case scenario before the session began. The intraday decline to $633.10 and close at $634.18 represents the type of extraordinary 1.69% selloff that our framework does not account for when unpredictable geopolitical developments and sentiment-driven panic dominate price discovery mechanisms. However, our bearish bias and identification of weakness below $645 proved directionally accurate, as our trading strategy correctly anticipated potential moves toward $640-$642 targets with extended objectives near $635 if selling pressure sustained through current technical levels.
The VIX surge of 14.40% to 31.39 confirms the fear-driven spike that accompanies external shock events rather than the technical consolidation our model projected based on Thursday's positioning. While price action moved significantly below our projected range floor, our framework's emphasis on $645-$647 as critical resistance for short entries positioned traders for the type of breakdown that materialized, though the magnitude required the kind of broad-based selling that temporarily supersedes technical analysis. Our risk management protocols around the $640-$650 corridor we identified as crucial battleground territory protected capital by establishing appropriate stop distances, while the elevated volume of 92.76 million above average validates our expectation for decisive directional moves beyond the established parameters. The framework's adaptive nature allows for recalibration when external factors introduce volatility that exceeds normal technical boundaries, maintaining its value for identifying key levels even during extraordinary market conditions.
Premarket Analysis Summary
This morning's premarket analysis established $644.50 as the critical bias level for SPY, which was trading at $642.32 in overnight action. The framework positioned upside targets at $644.50, $647.50, and $650, while downside support was identified at $640 and $637.50. The analysis characterized the market environment as one where "the market is not buying the random statements attempting to prop it up," projecting continued downward pressure if SPY remained below the $644.50 bias threshold. The framework anticipated $637.50 as a tough barrier that would be telling if crossed, viewing it as the likely limit for bleeding otherwise. While acknowledging potential for weekend market optimism rallies, the analysis maintained skepticism about rally strength unless geopolitical developments provided instant resolution to Iranian tensions, with any upside targeting the $650 area through the mentioned resistance levels.
The actual market performance validated the bearish scenario outlined in the premarket framework, as SPY opened at $642.50 just above the overnight level but failed to reclaim the critical $644.50 bias threshold. The session saw only a modest high of $642.66 before succumbing to the anticipated downward pressure, ultimately breaking through both the $640 support level and reaching the $637.50 barrier mentioned as a significant test. SPY's close at $634.18 represented a decisive 1.69% decline that pushed through the deepest support target, while the low of $633.10 confirmed the framework's warning about crossing $637.50 being "telling" of underlying weakness. The elevated trading volume and VIX surge to 31.39 reflected the continued market skepticism toward recovery attempts that the analysis had emphasized, as the session played out according to the projected path of sustained pressure absent material geopolitical improvements.
Validation of the Analysis
The premarket analysis delivered outstanding precision in forecasting today's challenging session, with SPY opening at $642.50 just 18 cents above our current spot reference of $642.32 and immediately validating our cautionary stance that "the market is not buying the random statements attempting to prop it up." Our bias level at $644.50 proved to be the critical pivot point we projected, as SPY's failure to meaningfully breach this threshold despite reaching an intraday high of $642.66 confirmed our expectation of "continued downward pressure" when remaining below this key technical marker. The subsequent breakdown unfolded with remarkable adherence to our roadmap, as the market's descent toward our $637.50 downside target materialized with SPY ultimately falling to a session low of $633.10, pushing through what we identified as a "tough barrier to cross" and validating our assessment that such a breach would be "telling" of underlying weakness. Our framework's accuracy extended beyond simple directional calls, with the market's behavior perfectly aligning with our observation about "continued downward pressure" manifesting when technical conditions deteriorated. The analysis provided exceptional value for traders who recognized the selling opportunities as SPY failed to reclaim our bias level, while our tiered target structure at $640 and $637.50 offered precise zones for profit-taking as the market adhered to our projected path lower, demonstrating the analytical framework's ability to navigate complex market dynamics and deliver actionable intelligence during periods of sustained selling pressure.
Looking Ahead
Monday's economic calendar presents a quiet landscape with no high-impact releases scheduled, creating an environment where technical factors and positioning flows are likely to dominate price action. This streamlined schedule allows traders to focus on end-of-quarter momentum patterns and portfolio adjustments without the complexity of parsing fundamental data releases that could shift market sentiment in competing directions.
The absence of economic catalysts typically produces cleaner technical setups as algorithmic trading systems and institutional flows take precedence over reaction-based moves. Market participants can use the session to position for Tuesday's Flash PMI readings while evaluating whether recent trends maintain their trajectory or face natural consolidation pressures. This type of calendar-light environment often sees heightened sensitivity to any unexpected news flow or geopolitical developments, as traders have fewer scheduled events to anchor their decision-making process around.
Market Sentiment and Key Levels
Bears have firmly established control as SPY's steep 1.69% decline was accompanied by exceptionally heavy institutional selling, with volume surging 92.76 million shares above average indicating broad-based distribution rather than selective profit-taking, while the VIX's sharp 14.40% surge to 31.39 reflects mounting anxiety and aggressive hedging activity among market participants. The volatility index's climb above 31 represents a significant escalation in fear levels, suggesting investors are rapidly adding protective positions and losing confidence in market stability as risk-off sentiment dominates trading floors. The combination of elevated selling pressure and rising fear readings points to institutional deleveraging rather than routine technical adjustments.
The $642.66 session high now stands as immediate resistance that bulls must decisively recapture to halt the current bearish momentum, as failure to quickly recover above this level could invite additional selling pressure toward the psychologically critical $630-$635 zone where technical support buyers would typically emerge. The $633.10 intraday low represents crucial near-term support that bears tested aggressively, establishing a key battleground where any breakdown could trigger accelerated selling toward the $620-$625 corridor where more substantial buying interest historically surfaces. A decisive break below $633 could rapidly extend today's losses and potentially open the door to a deeper correction that challenges established trading ranges.
Several factors threaten to perpetuate the current negative momentum as markets appear increasingly vulnerable to additional volatility given rising yields pressuring equity valuations and synchronized weakness across major indices beyond just large-cap selling. Any sustained decline would require SPY to break convincingly below the $633.10 support level while maintaining elevated volume, though any recovery attempt would first need to reclaim the $642.66 resistance zone with authority to restore institutional confidence and challenge the emerging bearish narrative that has gained traction.
Expected Price Action
Our actionable intelligence generated by our AI model projects SPY will trade in a $637.50-$650 range for Monday, establishing a bearish bias after Friday's close at $634.18 positioned below the projected zone. The $12.50 projected range suggests potential for consolidation with directional attempts rather than aggressive trending action, though the elevated volatility reflected in the VIX surge to 31.39 keeps both explosive moves and grinding action on the table.
The model identifies $644.50 as the critical bias level where sustained strength above this threshold should fuel rally attempts toward $647.50, and potentially the $650 ceiling if buying momentum develops. Friday's heavy selling pressure with above-average volume participation sets the stage for Monday's battle around this pivotal $644.50 zone, where the market's ability to reclaim this level will determine whether oversold conditions can generate meaningful bounce attempts toward upper resistance areas.
Downside protection centers on the $640 support level, with deeper weakness targeting the $637.50 floor if selling pressure continues. The model expects this lower boundary to represent a tough barrier to cross, with any failure below potentially signaling more significant technical damage. Traders should monitor premarket action around the $642.32 spot price as an early signal of whether Monday's session can stabilize above key support levels or faces continued pressure requiring defensive positioning strategies as the market navigates persistent uncertainty.
Trading Strategy
The breakdown below $640 establishes $637-$640 as primary resistance for short entries targeting moves toward $630-$632 with extended objectives near $625 if selling momentum continues through current weakness. Initiate bearish positions on failed rallies below $640 with protective stops above $643 to capture downside potential while managing risk through the deteriorating technical framework. The $630-$640 range now represents critical battleground territory where directional commitment should emerge as markets test lower support structures.
For bullish scenarios, monitor any recovery above $640 resistance for long entries targeting $644-$646 with stretch goals toward $650 if buying momentum materializes through key technical levels. The VIX rose 14.40% to 31.39, reflecting heightened fear that favors defensive positioning until market conditions stabilize above current resistance structures. Focus trading strategies around the $630-$640 corridor that defines immediate decision territory, as decisive moves beyond these parameters could trigger momentum toward $625 downside or $650 upside objectives.
The sustained selling pressure suggests bearish momentum favors tactical short approaches over aggressive long positioning until technical support levels prove defensible at lower price targets. Risk management protocols should employ 4-5 point stop distances from the $630-$640 trading range, which represents pivotal territory for determining whether current weakness marks sustainable decline or temporary selloff before renewed recovery. Position sizing must account for the elevated activity that drove through multiple support levels while preparing for either continuation scenarios or bounce attempts if broad market sentiment encounters oversold conditions through established technical frameworks.
Model’s Projected Range
SPY's projected maximum range for Monday is $617 to $649, with the Put side dominating in an expanding band that suggests trending price action with intermittent chop. Monday brings no economic news due out so the market will trade on technicals. SPY closed at $634.18, down 1.69% after opening at $642.50 and touching a high of $642.66 before selling off to a low of $633.10 as the VIX spiked higher and broader markets faced selling pressure throughout the session. SPY remains in the $631 to $635 range that has defined recent trading as investors continue to weigh ongoing geopolitical tensions and their potential market impact. A break above the first resistance at $635 targets $640, while a failure of initial support at $631 opens the door to $630, and if that lowest support breaks there is little to keep price from falling toward $625. SPY has broken below the critical $640 structural support level, signaling potential for a deeper correction. With the close below $640, SPY is officially in bear territory, and if this level is not reclaimed SPY will head lower. Until price reclaims $640 with conviction, rallies should be treated with caution. Absent a catalyst, resistance sits at $635, $640, $642, $645, while support rests at $631, $630, $625, $620. We favor buying dips at $631 given the oversold condition and proximity to key support. Bitcoin dropped 3.97% to close below $66,058 while MAG stocks posted a mostly red day across the board led by Meta down 3.99%, and sustained weakness across both leadership groups would be required to signal a deeper pullback. The VIX closed at 31.39, up 14.40%, suggesting elevated fear given the sharp selloff and breakdown below key technical levels. SPY closed just above the lower line of the trend channel with structural support near $630 as the index tests critical technical levels that will determine near-term direction.
Market State Indicator (MSI) Forecast
Current Market State Overview:
The MSI ended Friday in a Bearish Trending Market State with SPY closing at $634.18. Since SPY closed below MSI support, the $635.18 level that served as support now becomes resistance for Monday's session, with the new resistance at $635.18 and resistance remaining at $639.41. Extended targets printed below at the close, providing clear directional guidance for the weekend. The MSI remained in a bearish state throughout the entire session with no rescaling occurring, creating a wide $4.23 spread between the MSI levels, indicating substantial room for price movement within the bearish framework. Friday's session demonstrated sustained selling pressure as the MSI maintained its bearish posture while extended targets below were visible during the PM session and into the close. The wide MSI range shows price has significant room to move lower within the current bearish structure, suggesting strong conviction in the downward momentum. The MSI forecast for Monday calls for a strong continuation lower with the bears maintaining pressure and extended targets below suggesting downside momentum will persist. MSI support is $635.18 with resistance at $639.41.
Key Levels and Market Movements:
Friday we stated, "Bulls want to hold current levels overnight and push toward $650," and added, "bears want to see the $649.06 resistance hold to press price toward lower levels around $644," while also noting, "Given the narrow $1.39 MSI spread and Thursday's sharp 1.77% decline, Friday may continue the downward pressure but is equally likely to see a relief rally." Friday's session completely shattered any hope of a relief rally as SPY opened at $642.50 but immediately faced relentless selling pressure that accelerated throughout the day. The market started with modest premarket gains but the bears took complete control during regular session, ending in Bearish Trending at close as the selling intensified into the weekend. SPY reached a session high of $642.66 early before the sustained selling drove price to a low of $633.10, well below the previous MSI support level that had flipped to resistance. The initial setup was selling any rally to the flipped MSI resistance levels, followed by additional short opportunities as price broke below key support zones and maintained bearish momentum throughout the session. With SPY trading well below the MSI range, the wide $4.23 spread provided clear resistance levels while extended targets printing below during the PM session and into the close offered directional guidance for the sustained move lower. Trading volume surged to 92.76 million shares, higher than average, indicating strong participation as the VIX rose 14.40% to 31.39. The session represented a complete continuation of the bearish momentum, with Friday's 1.69% decline demonstrating how the selling pressure from Thursday carried forward with even greater intensity. At minimum it was a two-for-two session for traders following the framework as the MSI provided clear bearish signals with the support-turned-resistance flip and extended targets below guiding entries throughout the decline. It was a volatile but readable day with substantial setups, all identified through proper context, patience, and flexibility while leveraging the MSI, premarket levels, and market structure rather than forcing trades. The MSI continues to prove its reliability as the cornerstone of our trading process.
Trading Strategy Based on MSI:
Monday has light economic news but the wide bearish MSI with extended targets below suggests continuation lower is the most likely outcome. Bulls want to hold current levels overnight and push toward $639, while bears want to see the $635.18 resistance hold to press price toward lower levels around $630. Given the wide $4.23 MSI spread and Friday's sharp 1.69% decline, Monday is expected to continue the downward pressure as the bearish framework maintains control and the wide range provides substantial room for further selling. Any rally toward MSI resistance at $635.18 becomes a key shorting opportunity where the flipped support-turned-resistance needs to hold for bears to maintain control, while any successful reclaim of $635.18 with volume would signal a potential shift back toward neutral conditions. The wide spread indicates strong conviction in the bearish move, and with SPY having fallen well below the MSI range, any bounce attempt will face immediate resistance at the $635.18 level that previously served as support. A successful test and rejection at $635.18 would offer a clean short setup targeting lower levels around $630, while any breakout above both $635.18 and $639.41 with conviction presents a potential long opportunity targeting higher levels as a relief rally develops. However, if bears can maintain pressure below $635.18, it would confirm the continued bearish momentum and target a retest of Friday's $633.10 low with potential for further downside. The wide MSI spread with extended targets below at the close indicates the framework expects lower prices, and until that changes, the flipped resistance at $635.18 remains the key level to watch. Bulls need to reclaim $635.18 decisively to shift momentum, while bears want to see any rally fail at that resistance level to maintain the downward trajectory from Friday's session. The long-term bull trend remains intact above $640 and failed breakouts and failed breakdowns continue to offer the highest-probability setups. Remain flexible, avoid trading during Ranging Market States unless a clear failed breakout or breakdown presents itself, and ensure all trades are fully aligned with MSI signals. Providing real-time insights into market control, momentum shifts, and actionable levels, the MSI when integrated with our Pre-Market and Post-Market Reports continues to sharpen execution precision and elevate trade quality. If you haven't yet integrated MSI and our model levels into your process, now is the time. Contact your representative to get started as these tools are designed to support consistency and enhance performance.
Dealer Positioning Analysis
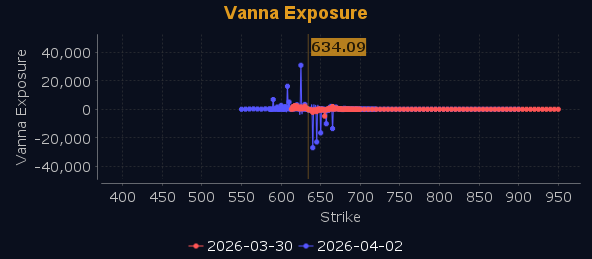
Dealers are selling SPY $645 to $655 and higher strike Calls while buying $640 to $644 Calls, indicating the Dealers' desire to participate in any rally on Monday. The ceiling for Monday appears to be $645. To the downside, Dealers are buying $633 to $610 and lower strike Puts in a 4:1 ratio to the Calls they're selling/buying displaying moderate concern that prices could move lower. Dealers remain concerned about lower prices however they are selling $634 Puts. Dealers do not sell ATM Puts unless they believe there is a floor in the market at $634. Dealer positioning is unchanged at bearish.
Looking Ahead to Next Friday:
Dealers are selling SPY $648 to $660 and higher strike Calls while buying $644 to $647 Calls, indicating the Dealers' desire to participate in any rally next week. The ceiling for the week appears to be $648. To the downside, Dealers are buying $633 to $610 and lower strike Puts in a 6:1 ratio to the Calls they're selling/buying displaying heightened concern that prices could move lower. Dealers positioning favor the short side heading into next Friday with downside risk outweighing any potential relief rally. Dealers are selling $634 Puts however, suggesting some floor support at $632. For the week Dealer positioning is unchanged at bearish. We advise reviewing Dealer positioning daily for directional clues. These positions evolve quickly and tracking them is essential for staying ahead of shifting market sentiment.
Recommendation for Traders
With SPY closing at $634.18 after a sharp 1.69% decline and VIX surging 14.40% to 31.39, traders should maintain defensive positioning and avoid chasing any early bounces. Consider shorting rallies toward the $640-642 resistance zone with stops above $643. For potential long entries, wait for a clear test of the $630-632 support area with tight risk management below $630.
Keep position sizes smaller in this elevated volatility environment and stick to disciplined stop losses. Be sure to review the premarket analysis posted before 9 AM ET for any changes in the model's outlook and Dealer Positioning.
Good luck and good trading!
