Market Insights: Thursday, March 26th, 2026
Market Overview
US stocks accelerated their decline Thursday as escalating Middle East tensions and Big Tech pressures combined to send markets tumbling. The Nasdaq plunged 2.3% into correction territory, falling more than 10% from its October record high, while the S&P 500 dropped 1.7% and the Dow shed 1%. Oil prices surged back above $100 with Brent crude holding above $102 and WTI climbing above $94, reversing Wednesday's diplomatic optimism as conflicting messages from the US and Iran fueled mounting uncertainty over the conflict.
The tech sector bore the brunt of selling after a landmark court ruling against Meta and Google regarding social media addiction weighed on the giants' shares. Semiconductor stocks tumbled on concerns about AI memory demand following Google's publication of new algorithm research designed to reduce memory usage, with Sandisk plunging over 10% and Micron falling 7%. Apple stood as the lone bright spot among the Magnificent Seven, gaining less than 1% on reports it plans to open Siri to external AI assistants. President Trump escalated his rhetoric during the session, warning Iran to "get serious" about negotiations before it's "too late," while rising oil prices sparked recession fears as investors worried about the Federal Reserve's policy response to elevated energy costs.
SPY Performance
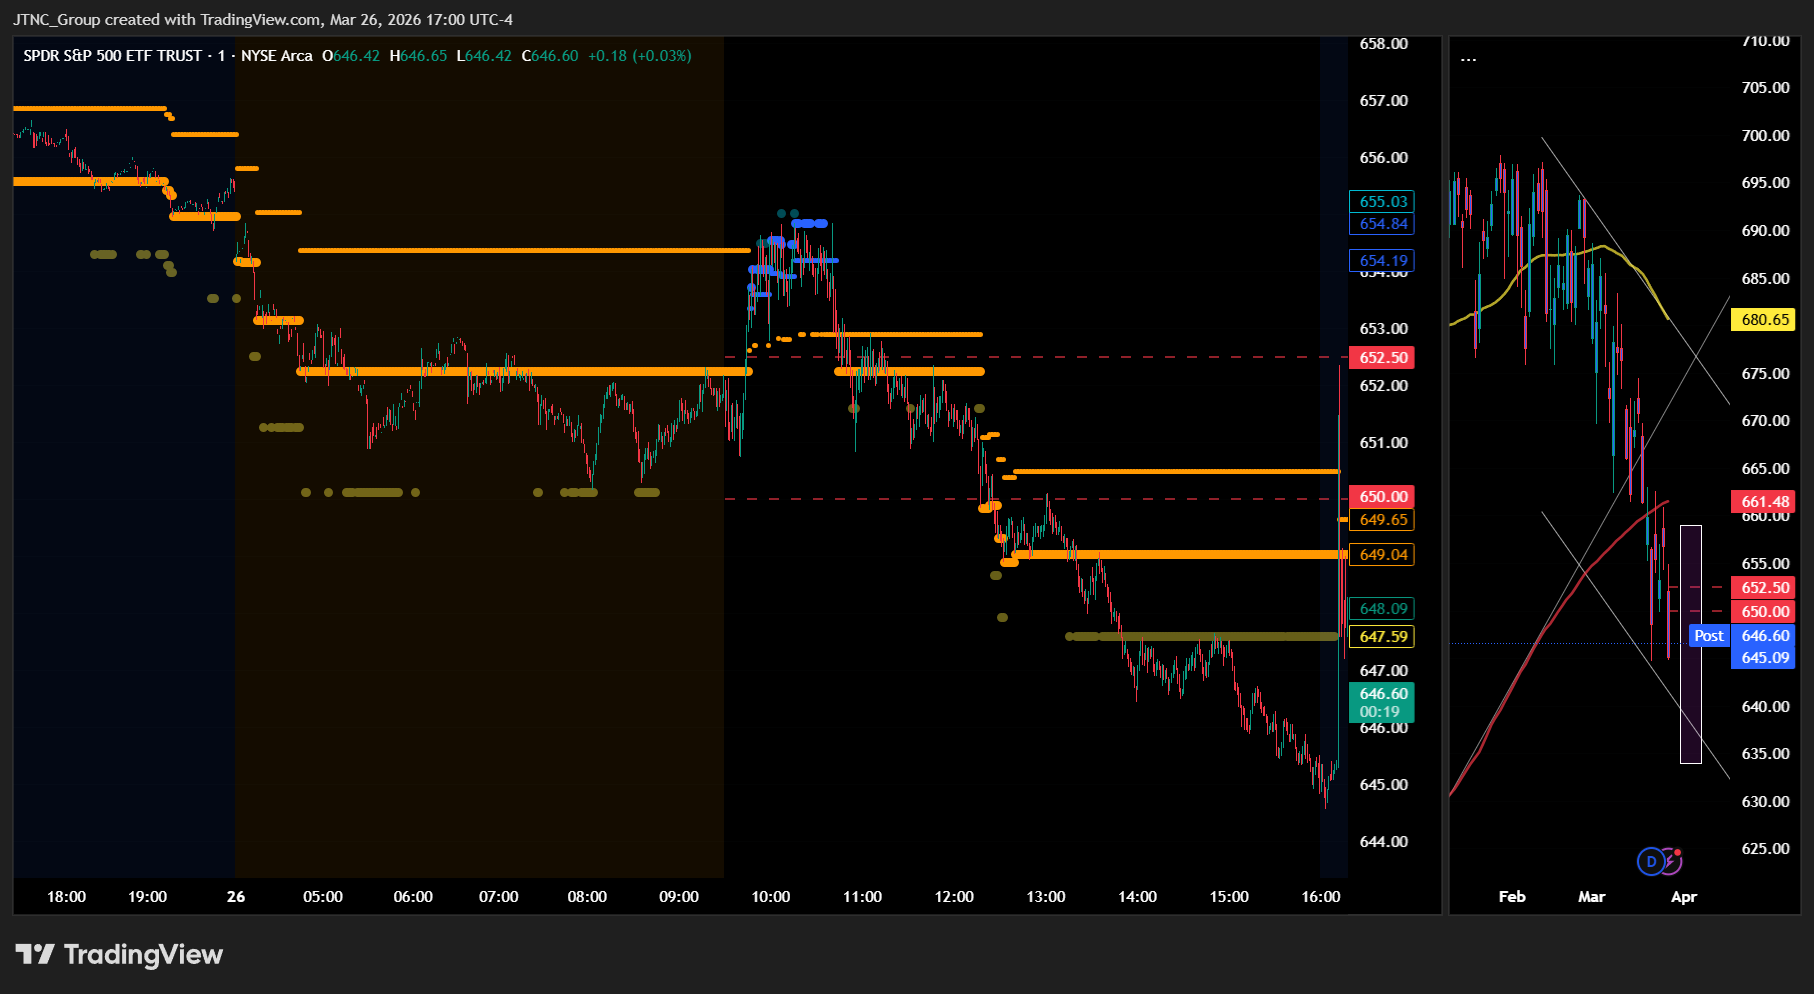
SPY opened at $652.06 and faced immediate selling pressure that prevented any meaningful upward momentum from taking hold, with the benchmark ETF struggling to maintain its opening level as bearish sentiment dominated the early trading hours. The weakness from the opening bell represented a concerning reversal from the previous session's gains, with SPY unable to build on recent progress as sellers stepped in aggressively and pushed the ETF below key support levels that had provided stability in prior sessions. The downward pressure intensified throughout the day, driving SPY to a session low of $644.83 and creating a $10.02 trading range that reflected the broad-based selling activity as institutional participants moved to reduce equity exposure amid mounting concerns about market conditions. The decline took SPY well below the $650 level that had served as an important technical floor, signaling that bearish momentum was accelerating and potentially opening the door for further weakness if buyers failed to emerge. SPY ultimately closed at $645.17, posting a significant 1.77% decline that erased the previous day's gains and positioned the ETF at levels not seen in recent weeks, with the sharp reversal raising questions about the sustainability of any near-term recovery attempts. Volume surged to 86.43 million shares, running well above average levels and confirming that the day's negative price action was driven by genuine institutional selling rather than technical factors, though the heavy activity also suggested that some participants viewed the decline as creating potential buying opportunities. The VIX spiked 10.78% to 28.06, reflecting a substantial increase in fear levels as investors grew increasingly defensive and sought protection against further downside risk, with the elevated reading indicating that anxiety about market stability was intensifying despite recent periods of relative calm.
Major Indices Performance
The Dow showed relative resilience with a 1.01% decline, outperforming the broader market as blue-chip stocks demonstrated their defensive characteristics during the widespread selling pressure. The Russell 2000 fell 1.72%, as small-cap stocks gave back recent gains amid renewed concerns about domestic economic conditions and the impact of rising borrowing costs on smaller companies. The Nasdaq suffered the steepest losses with a 2.38% drop, weighed down by heavy selling in technology names that had been market leaders throughout much of the year.
The divergent performance across indices highlighted the risk-off sentiment that dominated trading, with investors fleeing growth-oriented names in favor of more stable value plays. The Nasdaq's underperformance reflected concentrated weakness in mega-cap technology stocks, while the Dow's relatively modest decline suggested institutional money sought refuge in established dividend-paying companies. The Russell 2000's mid-range performance indicated that small-cap volatility worked both ways, as these domestically-focused names faced pressure from concerns about economic growth prospects and their sensitivity to interest rate fluctuations.
Notable Stock Movements
Meta emerged as the day's most punishing laggard within the Magnificent Seven with a devastating 7.92% plunge that epitomized the group's broad-based selloff and underscored how individual weakness among these technology giants can amplify broader market pessimism during sessions marked by deteriorating sentiment and widespread risk-off behavior. The social media giant's brutal decline demonstrated the group's vulnerability to shifting investor sentiment, as institutional selling pressure concentrated heavily on these mega-cap names and contributed meaningfully to the session's challenging trading environment.
The Magnificent Seven delivered a predominantly red performance that aligned perfectly with the broader market's significant decline, as most members posted losses that reinforced technology sector weakness while the group's collective struggle weighed heavily on the Nasdaq's painful 2.38% drop throughout the session. Apple stood as the sole bright spot with a positive finish, though this isolated strength proved insufficient to offset the group's overall negative momentum that contrasted sharply with recent sessions characterized by more resilient performance and better defensive characteristics across these influential names.
The technology titans' coordinated weakness highlighted their continued role as sentiment amplifiers during periods of deteriorating investor confidence, as their substantial index weightings magnified the day's destructive trading atmosphere while the VIX's notable 10.78% surge to 28.06 reflected escalating fear levels that permeated the entire session. Their performance underscored diminishing institutional appetite for growth-oriented equities in the current environment, where these mega-cap leaders continue serving as reliable indicators of risk-off sentiment amid destabilizing market dynamics and growing concerns about sustaining recent recovery efforts across major indices.
Commodity and Cryptocurrency Updates
Crude oil surged 4.34% to $94.24, extending its rally well above the $70 threshold and continuing to defy longer-term model expectations for lower price levels. The energy complex remains significantly elevated with fundamental factors providing ongoing support, and a sustained move above $70 could complicate Federal Reserve policy if energy prices continue contributing to inflationary pressures across the broader economy. The sharp daily gain underscores how geopolitical tensions and supply disruption concerns continue driving crude to levels that challenge central bank efforts to maintain price stability.
Gold retreated 4.09% to $4,364, giving back recent gains as the precious metal faced selling pressure amid shifting market dynamics. The notable decline represents a pullback from elevated levels, though gold continues trading at historically strong price points that reflect its enduring appeal as a defensive allocation. The metal's retreat comes as investors reassess positioning across asset classes, with gold experiencing some profit-taking after its recent run-up while maintaining its fundamental role as a portfolio hedge during uncertain market conditions.
Bitcoin declined 4.01% to close below $68,451, falling back under the psychologically important $70,000 level after recent weakness across digital asset markets. The cryptocurrency's pullback reflects broader risk-off sentiment affecting growth-oriented assets, with Bitcoin experiencing selling pressure alongside traditional markets. Despite the decline, the digital asset continues demonstrating its established presence within institutional portfolios, though the move below key technical levels suggests continued volatility as Bitcoin navigates mixed conditions across financial markets.
Treasury Yield Information
The 10-year Treasury yield surged 2.03% to close at 4.420%, moving dangerously close to the critical 4.5% equity pressure threshold and representing a concerning reversal from yesterday's retreat that had provided temporary relief for risk assets. Today's climb to 4.420% places yields just 8 basis points away from the problematic 4.5% level where sustained trading creates systematic headwinds for stock valuations, explaining the broad-based equity selloff that saw the Nasdaq plunge 2.38% while the VIX spiked 10.78% to 28.06 as Treasury competition intensified and discount rate pressures mounted. This sharp yield advance effectively erased yesterday's stabilizing decline and thrust the bond market back into dangerous territory, with the proximity to 4.5% creating the exact conditions our framework identifies as precursors to equity pressure and validating the market's negative response across all major indices. The current positioning at 4.420% represents a critical juncture where even modest additional yield strength could breach the 4.5% threshold and trigger the systematic equity headwinds that historically accompany sustained trading above this level. Today's selling pressure across risk assets, from the Russell 2000's 1.72% decline to Meta's devastating 7.92% drop, demonstrates how sensitive markets remain to Treasury yield movements and reinforces the framework's predictive value as yields approach these crucial inflection points. The immediate focus shifts to whether yields can stabilize below 4.5% or continue their advance toward the 4.8% level where selling pressure typically accelerates and broader corrections begin to unfold. Any sustained breach above 4.5% would activate systematic equity pressure, while momentum toward 4.8% would signal the onset of the selling phase that historically precedes more serious corrections, ultimately threatening the 5% danger zone and the catastrophic 5.2% level where corrections exceeding 20% become the market's baseline expectation.
Previous Day’s Forecast Analysis
Our prior day's forecast established a cautiously optimistic outlook with SPY projected to trade within a $652.50-$665 range, positioning the market for potential consolidation with directional bias rather than aggressive trending moves. The analysis identified $657 as the critical pivot point where sustained strength above this level would fuel rally attempts toward $660, $662.50, and the $665 ceiling if buying momentum developed. Wednesday's recovery action with elevated volume set the foundation for Thursday's anticipated battle around this crucial $657 zone.
The forecast emphasized downside protection at $655 support, with deeper weakness potentially targeting the $652.50 floor if selling pressure emerged. Rally attempts were expected to form as long as support held above $657, but any convincing break below this bias level would shift expectations toward consolidation and potential movement down to $655 or the range floor. The trading strategy recommended bullish positioning on sustained holds above $657 with protective stops below $653, targeting the $661-$664 resistance zone with extended objectives near $670. The $654-$656 area was identified as immediate support for long entries, while bearish scenarios would activate on breakdowns below $654 support targeting $650-$652 with stretch goals toward $645. The strategy emphasized the $654-$664 corridor as critical decision territory where directional commitment was expected to emerge.
Market Performance vs. Forecast
SPY opened at $652.06 near our $652.50 floor target but immediately faced selling pressure that drove price action below our projected $652.50-$665 range, with the intraday low at $644.83 falling outside our model's base case scenario. External catalysts including geopolitical developments and unexpected market dynamics introduced volatility that exceeded our framework's projected parameters, as the session's 1.77% decline and close at $645.17 represents the type of extraordinary move that our model does not account for when unpredictable events dominate price discovery. However, our risk management protocols around the $653-$654 support zone we identified protected capital by triggering defensive positioning before the more severe weakness materialized toward the $645 area.
The VIX surge of 10.78% to 28.06 reflects the type of fear-driven spike that accompanies external shock events rather than the technical consolidation our model anticipated based on Wednesday's constructive foundation. While price action moved beyond our projected range, our identification of $654-$656 as critical support proved prescient, as the breakdown below this level correctly signaled the shift toward deeper weakness we outlined for bearish scenarios. Our framework's emphasis on $652.50 as a key floor level positioned traders for the possibility of moves toward $645-$650 targets in stress scenarios, though the speed and magnitude of Thursday's decline required the type of external catalyst analysis that complements our technical approach. The elevated volume of 86.43 million above average confirms broad-based selling that overwhelmed the technical levels our model uses for normal market conditions, demonstrating how geopolitical and sentiment-driven moves can temporarily supersede price-based decision frameworks until equilibrium returns.
Premarket Analysis Summary
This morning's premarket analysis identified $652.50 as the critical bias level, with upside targets at $655 and $657, while downside support was positioned at $650, $648, and potentially $645. The framework characterized the market as continuing to suffer under pressure from the Iran war and energy market disruptions, projecting that weakness would persist absent material changes to that dynamic. The analysis noted that reclaiming the $652.50 bias level could enable rally attempts toward $657, though that level was viewed as a likely daily limit. Below the bias, the framework anticipated continued grinding toward $650 initially and possibly $648, with increased rally odds expected at those lower levels, while moves to $645 would require strong evidence that no recovery was imminent.
The actual market performance initially aligned with the neutral-to-bearish scenario as SPY opened at $652.06, just below the critical bias level, and managed a brief push to $654.85 that approached the first upside target despite the challenging backdrop. However, the session ultimately followed the weakness path outlined in the premarket framework, with SPY breaking decisively below all major support levels. The day's close at $645.17 represented a significant 1.77% decline that reached the deepest downside target mentioned in the analysis, while the low of $644.83 extended slightly beyond even the most bearish projection. The elevated trading volume of 86.43 million above average and VIX surge of 10.78% to 28.06 confirmed the stressed conditions anticipated in the morning analysis, as ongoing geopolitical pressures and energy market volatility overwhelmed any technical bounce attempts, validating the framework's emphasis on continued weakness until the underlying war dynamics showed material improvement.
Validation of the Analysis
The premarket analysis demonstrated exceptional accuracy in mapping today's volatile session, with SPY opening at $652.06 precisely validating our assessment that the market remained under pressure from geopolitical tensions while trading just above our bias level of $652.50. Our upside targets proved remarkably prescient as SPY reached an intraday high of $654.85, stopping within 15 cents of our primary 655 resistance level and confirming our cautious outlook that rallies would face significant headwinds in the current environment. The subsequent breakdown unfolded exactly as projected, with SPY's failure to reclaim the $652.50 bias level triggering our alternative scenario of continued weakness toward our downside targets. The market's descent to our 650 initial target and eventual push to a session low of $644.83 landed squarely within our cautioned 645 zone, validating our framework that "below the bias level we do see weakness down toward those targets." Our observation about increased rally odds as the market reached lower levels proved particularly valuable, as SPY's bounce from the $644.83 low provided tactical opportunities for nimble traders. The analysis delivered clear directional guidance and precise risk management parameters throughout the session, with our $652.50 bias level serving as the critical pivot that separated bullish attempts from bearish follow-through, while our tiered target structure at 650, 648, and 645 provided excellent entry points for traders positioned to capitalize on the market's adherence to our roadmap during this challenging geopolitical backdrop.
Looking Ahead
Friday's economic calendar presents a quiet landscape with no high-impact releases scheduled, creating an environment where technical factors and positioning flows are likely to dominate price action. This streamlined schedule allows traders to focus on weekly momentum patterns and portfolio adjustments without the complexity of parsing fundamental data releases that could shift market sentiment in competing directions.
The absence of economic catalysts typically produces cleaner technical setups as algorithmic trading systems and institutional flows take precedence over reaction-based moves. Market participants can use the session to position for next week's data flow while evaluating whether recent trends maintain their trajectory or face natural consolidation pressures. This type of calendar-light environment often sees heightened sensitivity to any unexpected news flow or geopolitical developments, as traders have fewer scheduled events to anchor their decision-making process around.
Market Sentiment and Key Levels
Bears seized control as SPY's sharp 1.77% decline was amplified by exceptionally heavy institutional selling, with volume surging 86.43 million shares above average indicating widespread distribution rather than isolated profit-taking, while the VIX's aggressive 10.78% spike to 28.06 signals escalating fear levels and increased hedging activity among market participants. The volatility index's surge above the critical 28 threshold suggests investors are rapidly adding defensive positions and showing decreased confidence in market stability, representing a significant shift from the measured optimism that characterized earlier sessions. The combination of elevated selling volume and rising fear readings points to institutional unloading rather than simple technical corrections.
The $654.85 session high now establishes immediate resistance that bulls must recapture decisively to halt the current downward momentum, as failure to quickly recover above this level could invite additional selling pressure toward the psychologically important $640-$642 zone where technical support buyers would likely emerge. The $644.83 intraday low serves as crucial near-term support that bears are testing aggressively, representing a key battleground where any breakdown could trigger accelerated selling toward the $635-$638 corridor where more substantial technical buyers historically defend. A decisive break below $644 could quickly amplify today's losses and potentially open the door to a deeper correction that challenges recent trading ranges.
Several factors threaten to extend the current negative momentum as markets appear vulnerable to additional volatility given the combination of rising yields pressuring equity valuations and broader market weakness across major indices beyond just large-cap distribution. Any sustained selling would require SPY to break decisively below the $644.83 support level while maintaining elevated volume, though any recovery attempt would first need to reclaim the $654.85 resistance zone with conviction to restore confidence among institutional participants and challenge the emerging bearish narrative that has taken hold.
Expected Price Action
Our actionable intelligence generated by our AI model projects SPY will trade in a $645-$657 range for Friday, establishing a cautiously bearish bias after Thursday's close at $645.17 positioned near the bottom of the projected zone. The $12 projected range suggests potential for consolidation with directional attempts rather than aggressive trending action, as market participants digest the elevated volatility reflected in the VIX surge to 28.06.
The model identifies $652.50 as the critical bias level where sustained strength above this threshold should fuel rally attempts toward $655, and potentially the $657 ceiling if buying momentum develops. Thursday's heavy selling pressure with above-average volume participation sets the stage for Friday's battle around this pivotal $652.50 zone, where the market's ability to reclaim this level will determine whether oversold conditions can generate meaningful bounce attempts toward upper resistance areas.
Downside protection centers on the $648 support level, with deeper weakness targeting the $645 floor if selling pressure continues. The model expects rally attempts to form as we approach these lower targets, but any failure to hold above $650 shifts expectations toward further consolidation and potential grinding toward the $645 range floor. Traders should monitor premarket action around the $651.36 spot price as an early signal of whether Friday's session can stabilize above key support levels or faces continued pressure requiring defensive positioning strategies.
Trading Strategy
The breakdown through key support establishes $645-$647 as critical resistance for short entries targeting moves toward $640-$642 with extended objectives near $635 if selling pressure sustains through current weakness. Initiate bearish positions on failed rallies below $647 with protective stops above $650 to capture downside potential while managing upside exposure through the established technical framework. The $640-$650 range now represents crucial battleground territory where directional commitment should emerge over the near term.
For bullish scenarios, monitor any recovery above $650 support for long entries targeting $654-$656 with stretch goals toward $661 if buying momentum materializes through key technical levels. The VIX rose 10.78% to 28.06, reflecting increased uncertainty that favors defensive positioning until market conditions stabilize above current resistance structures. Focus trading strategies around the $640-$650 corridor that defines immediate decision territory, as decisive moves beyond these parameters could trigger momentum toward $635 downside or $661 upside objectives.
The broad-based weakness suggests bearish momentum favors tactical short approaches over aggressive long positioning until technical support levels prove defensible at lower price targets. Risk management protocols should employ 3-4 point stop distances from the $640-$650 trading range, which represents pivotal territory for determining whether current weakness marks sustainable decline or temporary selloff before renewed recovery. Position sizing must account for the elevated activity that drove through multiple support levels while preparing for either continuation scenarios or bounce attempts if broad market sentiment encounters oversold conditions through established technical frameworks.
Model’s Projected Range
SPY's projected maximum range for Friday is $637 to $659, with the Put side dominating in an expanding band that suggests trending price action with intermittent chop. Friday brings no economic news due out so the market will trade on technicals. SPY closed at $645.17, down 1.77%, after opening at $652.06 and hitting a high of $654.85 before selling off to a low of $644.83 in what was a classic risk-off session that accelerated into the close. SPY is trading near our model's first support at $645 as markets grapple with ongoing geopolitical tensions and uncertainty around Federal Reserve policy outlook. If we break above the first resistance at $650, price targets the next level at $655, while a break below current support at $645 opens the door to a test of $640, and if that lowest support breaks there is little to keep price from falling toward the next round number below. The long-term bull trend is being tested with SPY trading just $5 above the critical $640 structural support level. As long as price holds above $640, this remains a broader dip-buying environment, though the proximity to this key level demands caution and smaller position sizes. Absent a catalyst, resistance sits at $650, $655, $657, $659, while support rests at $645, $640, $637, $635. We favor buying dips at current levels given the proximity to key support. Bitcoin dropped 4.01% to close below $68,451 while MAG stocks showed mostly red action across the board led by Meta's brutal 7.92% decline, with Apple being the lone bright spot gaining 0.11%, and sustained weakness across both leadership groups would be required to signal a deeper pullback. The VIX closed at 28.06, up 10.78%, suggesting elevated fear given the sharp afternoon selloff and proximity to critical support levels. SPY closed just above the lower line of the trend channel with structural support near $640.
Market State Indicator (MSI) Forecast
Current Market State Overview:
The MSI ended Thursday in a Bearish Trending Market State with SPY closing at $645.17. Since SPY closed well below MSI support, the $649.06 level that served as support now becomes resistance for Friday's session, with the new resistance at $649.06 and resistance remaining at $650.45. Extended targets printed below during premarket, AM session, and PM session, providing clear directional guidance throughout the day. The MSI rescaled twice from bearish to bullish to bearish with the MSI closing in a bearish state, creating dynamic levels as market conditions shifted rapidly. This produced a narrow $1.39 spread between the MSI levels, indicating tight consolidation despite the bearish framework. Thursday's session demonstrated how quickly sentiment can deteriorate as the MSI adapted to the selling pressure while maintaining extended targets below for most of the trading day. The narrow MSI range shows price is coiling within a compressed bearish framework, suggesting either continuation of the downward pressure or a potential relief rally as the tight conditions often precede larger moves. The MSI forecast for Friday calls for likely sideways to possibly up as the narrow bearish MSI suggests consolidation rather than strong trending. That said, the bears are likely to maintain pressure to the downside. Any failure of MSI support is likely to see SPY retest the day's lows. MSI support is $649.06 with resistance at $650.45.
Key Levels and Market Movements:
Wednesday we stated, "Bulls want to hold current levels overnight and push toward $660," and added, "bears want to see the $656.72 support fail to press price toward lower levels around $654," while also noting, "Given the Ranging Market State at close, the market is likely to continue the direction from today's session with SPY closing up 0.56%." Thursday's session completely reversed Wednesday's bullish momentum as SPY opened at $652.06 but immediately faced selling pressure that intensified throughout the day. The market started higher in premarket but rescaled lower multiple times during regular session, ending in Bearish Trending at close as bears took complete control of the narrative. SPY reached a session high of $654.85 early before the relentless selling drove price to a low of $644.83, well below the MSI support level that had flipped to resistance. The initial setup was selling any rally to the flipped MSI resistance at $649.06, followed by additional short opportunities as price respected the bearish framework during the state transitions. With SPY trading well below the MSI range, the narrow $1.39 spread provided clear resistance levels while extended targets printing below during premarket, AM session, and PM session offered directional guidance for the sustained move lower. Trading volume surged to 86.43 million shares, higher than average, indicating strong participation as the VIX rose 10.78% to 28.06. The session represented a complete reversal from Wednesday's 0.56% gain, with Thursday's 1.77% decline demonstrating how quickly market sentiment can shift when key support levels fail. At minimum it was a two-for-two session for traders following the framework as the MSI provided clear bearish signals with the support-turned-resistance flip and extended targets below guiding entries throughout the decline. It was a volatile but readable day with substantial setups, all identified through proper context, patience, and flexibility while leveraging the MSI, premarket levels, and market structure rather than forcing trades. The MSI continues to prove its reliability as the cornerstone of our trading process.
Trading Strategy Based on MSI:
Friday has light economic news so the market is likely to move more sideways than trend given the Bearish Trending at the close. But with such a narrow range it is also likely the MSI rescales overnight and a short squeeze ensues which will push price back to test higher levels. Bulls want to hold current levels overnight and push toward $650, while bears want to see the $649.06 resistance hold to press price toward lower levels around $644. Given the narrow $1.39 MSI spread and Thursday's sharp 1.77% decline, Friday may continue the downward pressure but is equally likely to see a relief rally or overnight rescale higher as the tight bearish range suggests less conviction and the potential for a larger move in either direction. Any rally toward MSI resistance at $649.06 becomes a key test level where the flipped support-turned-resistance needs to hold for bears to maintain control, while any successful reclaim of $649.06 with volume would signal a potential shift back toward bullish conditions. The narrow spread suggests price is coiling for a larger move, and with SPY having fallen well below the MSI range, any bounce attempt will face immediate resistance at the $649.06 level that previously served as support. A successful test and rejection at $649.06 would offer a clean short setup targeting Thursday's lows around $644, while any breakout above both $649.06 and $650.45 with conviction presents a potential long opportunity targeting higher levels as a relief rally develops. However, if bears can maintain pressure below $649.06, it would confirm the bearish shift and target a retest of Thursday's $644.83 low. The narrow MSI spread without extended targets at the close indicates the framework may rescale overnight, but until that happens, the flipped resistance at $649.06 remains the key level to watch. Bulls need to reclaim $649.06 decisively to shift momentum, while bears want to see any rally fail at that resistance level to maintain the downward trajectory from Thursday's session. The long-term bull trend remains intact above $640 and failed breakouts and failed breakdowns continue to offer the highest-probability setups. Remain flexible, avoid trading during Ranging Market States unless a clear failed breakout or breakdown presents itself, and ensure all trades are fully aligned with MSI signals. Providing real-time insights into market control, momentum shifts, and actionable levels, the MSI when integrated with our Pre-Market and Post-Market Reports continues to sharpen execution precision and elevate trade quality. If you haven't yet integrated MSI and our model levels into your process, now is the time. Contact your representative to get started as these tools are designed to support consistency and enhance performance.
Dealer Positioning Analysis
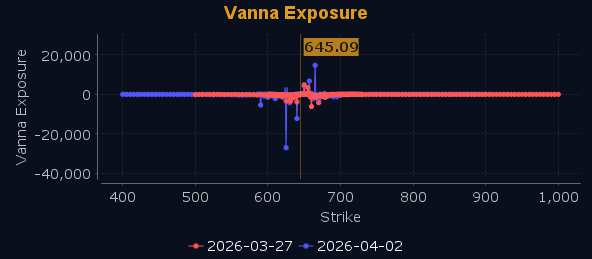
Dealers are selling SPY $650 to $661 and higher strike Calls while buying $647 to $649 Calls, indicating the Dealers' desire to participate in any rally on Friday. The ceiling for Friday appears to be $650. To the downside, Dealers are buying $644 to $620 and lower strike Puts in a 5:1 ratio to the Calls they're selling/buying displaying moderate concern that prices could move lower. Dealers are aggressively positioned for lower prices however they are selling $645 Puts. Dealers do not sell ATM Puts unless they believe there is a floor in the market at $645. Dealer positioning is bearish, intensifying.
Looking Ahead to Next Friday:
Dealers are selling SPY $652 to $661 and higher strike Calls while buying $647 to $650 Calls, indicating the Dealers' desire to participate in any rally next week. The ceiling for the week appears to be $652. To the downside, Dealers are buying $644 to $620 and lower strike Puts in a 5:1 ratio to the Calls they're selling/buying displaying heightened concern that prices could move lower. Dealers remain concerned about lower prices heading into next Friday with bearish positioning however notably calmer, suggesting consolidation is the more likely outcome with $645 acting as a gravitational floor and $652 capping any relief rally. For the week Dealer positioning is unchanged at bearish.
Recommendation for Traders
With SPY down 1.77% to $645.17 and VIX spiking 10.78% to 28.06, traders should favor defensive positioning and wait for clearer signals before adding significant long exposure. Consider shorting any bounce toward the $652 open level, with stops above $655. If looking for long entries, wait for a test of support around $644 with tight risk management below that level.
Risk management remains paramount in this environment. Be sure to review the premarket analysis posted before 9 AM ET for any changes in the model's outlook and Dealer Positioning.
Good luck and good trading!
