Market Insights: Wednesday, March 25th, 2026
Market Overview
US stocks climbed Wednesday as investors reacted to reports that the US sent a 15-point ceasefire plan to Iran, sparking hopes for an end to the Middle East conflict that has rattled markets. The S&P 500 gained 0.5%, the Dow rose 0.6%, and the tech-heavy Nasdaq added 0.7% as risk appetite improved on the diplomatic development. Oil prices retreated sharply on the news, with WTI crude falling to around $90 and Brent trading below $97, continuing their volatile swings as traders tracked geopolitical developments.
The ceasefire proposal, delivered through intermediary Pakistan according to AP reports, represents growing urgency from the Trump administration to halt escalating attacks given their potential economic impact. While Iran reportedly rejected the US proposal and pushed back on claims of direct talks, the mere existence of diplomatic efforts was enough to lift market sentiment and boost bets on Federal Reserve rate cuts. Gold futures surged 3% as investors saw potential for central banks to eventually ease policy if oil prices stabilize without impacting inflation, while semiconductor stocks AMD and Intel both jumped over 6% on reports they're hiking CPU prices amid supply shortages. The session also featured notable moves in mega-cap tech, with Meta gaining 1% despite reports of upcoming layoffs while Alphabet shares slipped following a $3 million verdict in a social media addiction lawsuit.
SPY Performance
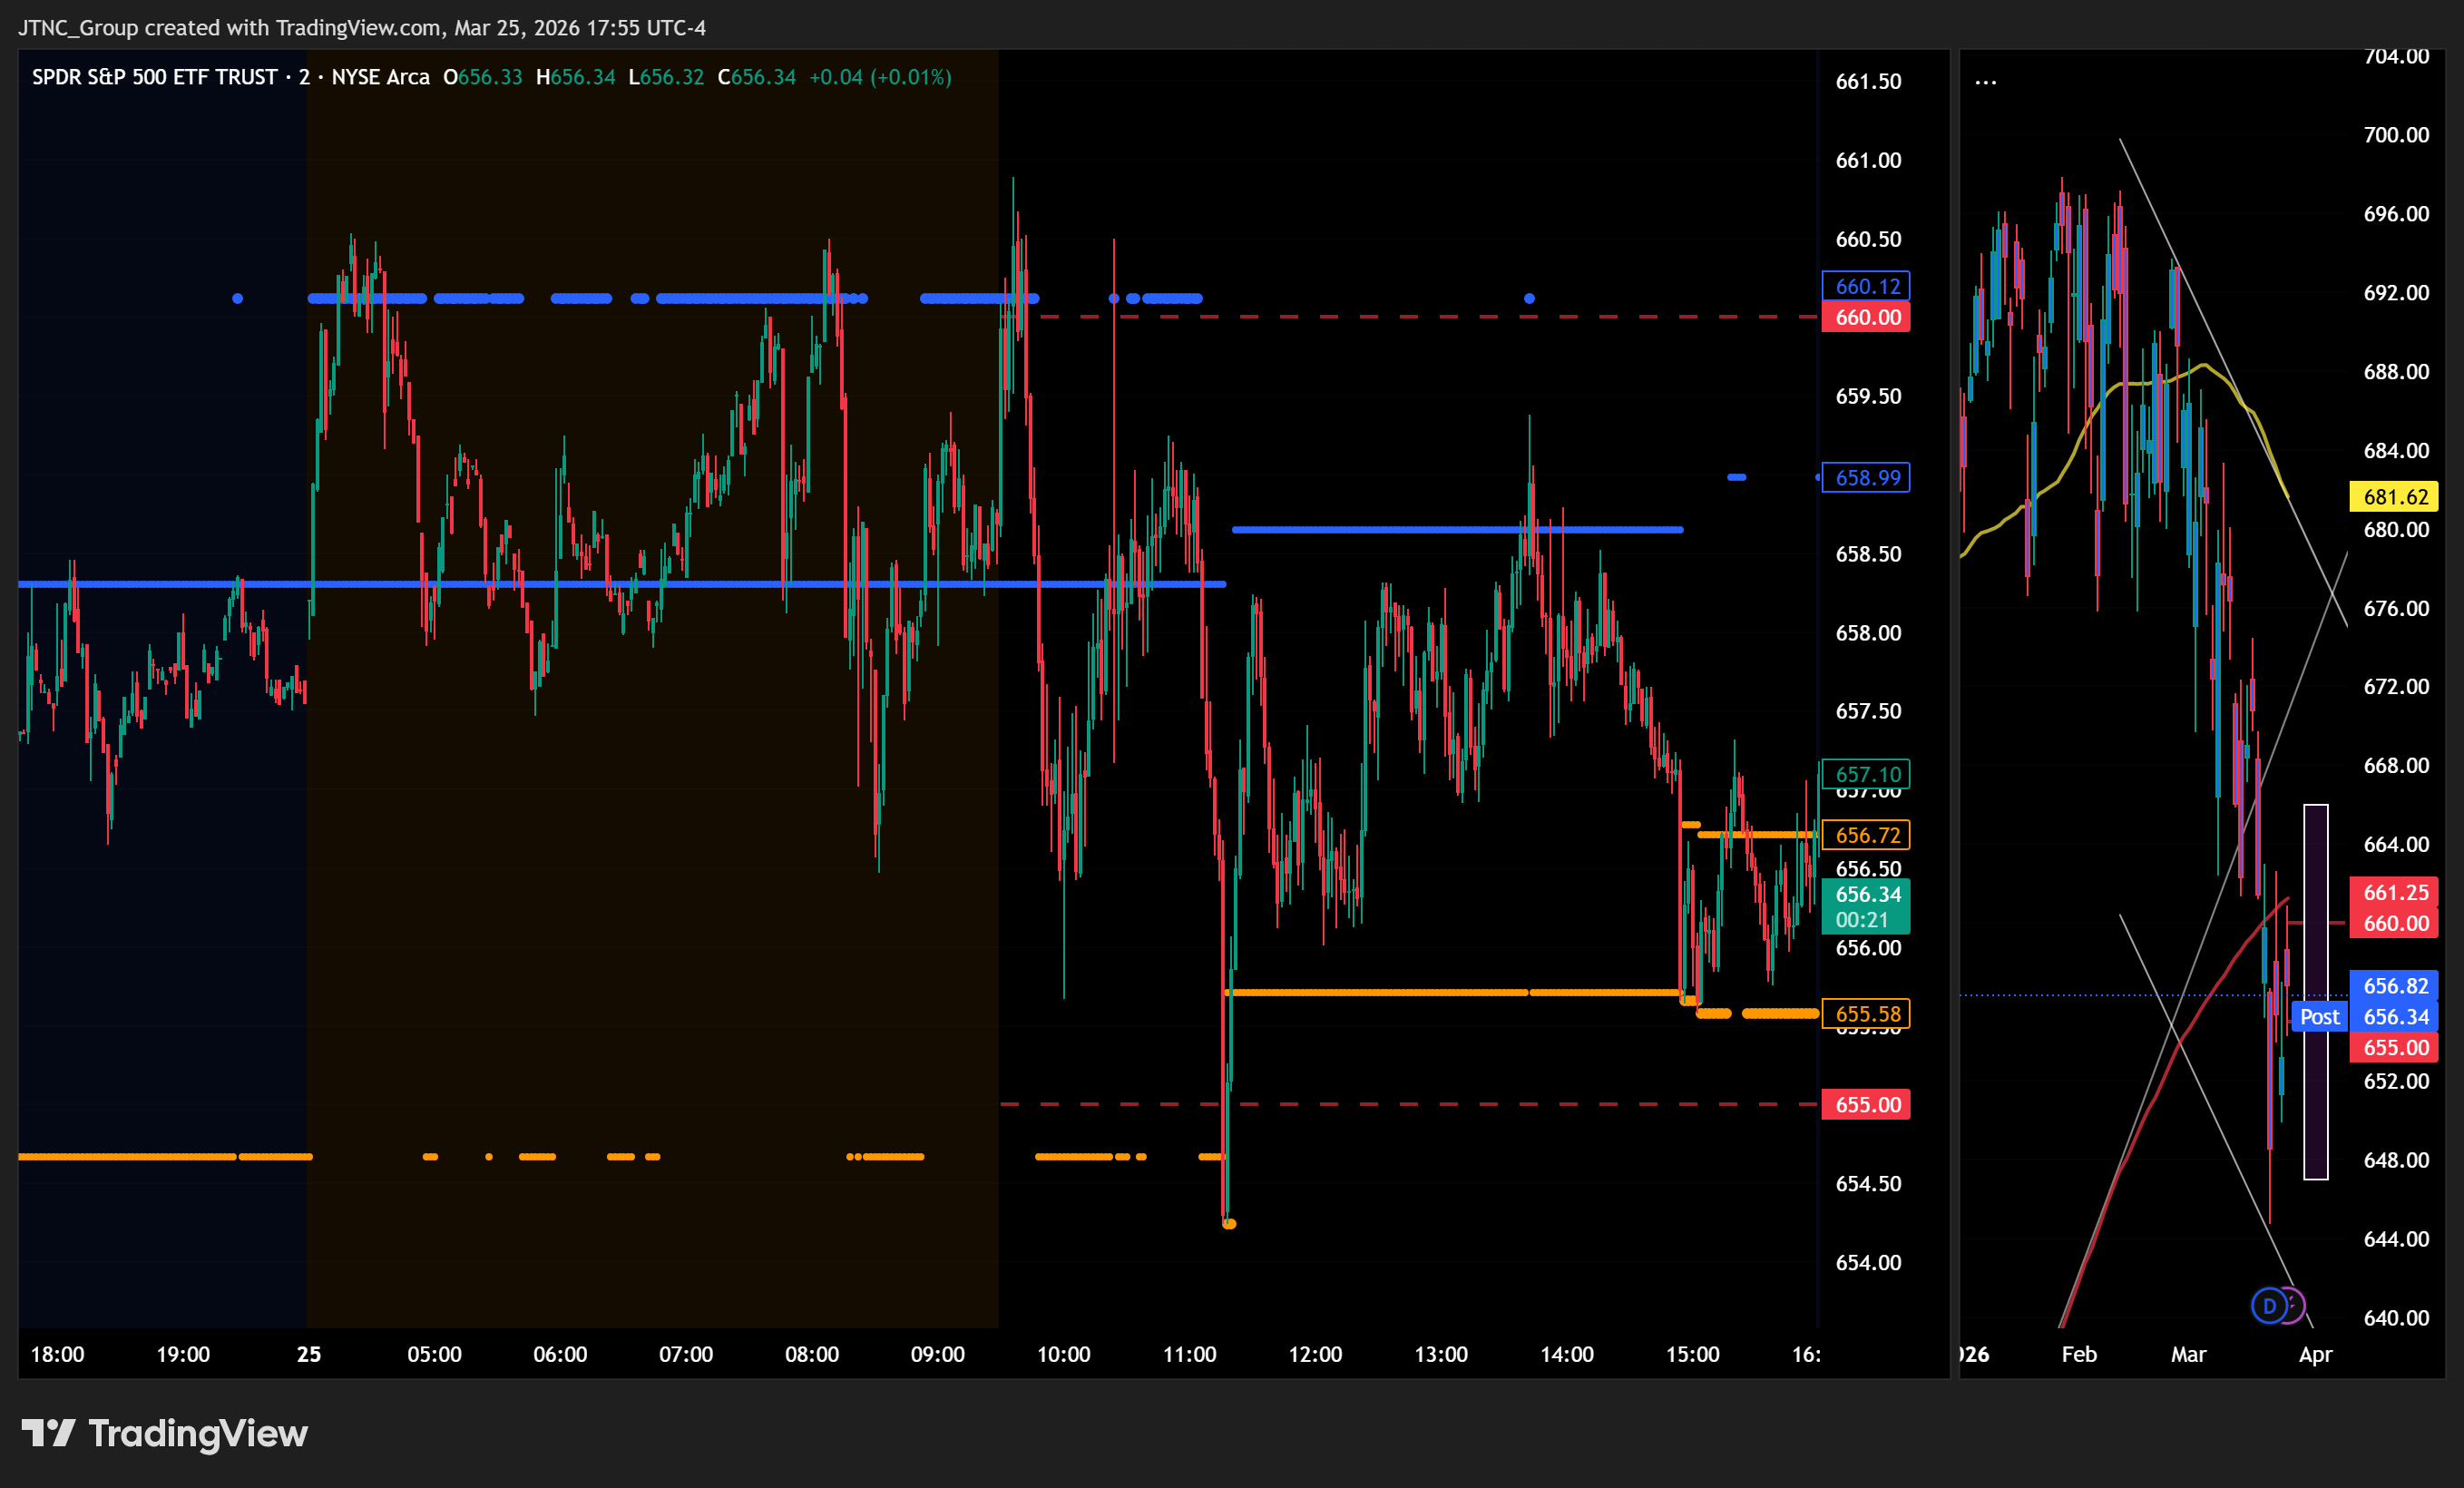
SPY opened at $658.67 and pushed higher in early trading, reaching a session peak of $660.89 as buyers demonstrated renewed confidence and drove the benchmark ETF toward levels that had proven challenging in recent sessions. The upward momentum from the opening bell represented a notable shift from the previous day's weakness, with the ETF climbing above the $660 resistance area that had capped several recent rallies and signaled potential for further gains if bulls could maintain their grip on the market. However, the advance proved difficult to sustain as profit-taking and cautious sentiment emerged during the session, pulling SPY back to a low of $654.24 and creating a $6.65 trading range that captured the ongoing tension between optimistic and defensive positioning among institutional participants. The intraday pullback tested the resolve of buyers who had driven the morning gains, though the fact that SPY held above the $654 level suggested that support remained intact despite the retreat from the session highs. SPY ultimately finished at $656.82, posting a solid 0.56% gain that marked a recovery from recent declines and positioned the ETF back above key technical markers that could influence momentum heading into the next trading period. Volume reached 86.25 million shares, running higher than average and confirming that the day's positive price action was backed by substantial institutional participation rather than thin conditions, though the elevated activity also reflected continued uncertainty as market participants weighed competing economic and policy factors. The VIX dropped 6.01% to 25.33, indicating that fear levels moderated as investors showed increased willingness to take on risk, though the reading remained elevated compared to recent months and suggested that underlying caution persists despite the session's constructive performance.
Major Indices Performance
The Russell 2000 led the market higher with a robust 1.23% advance, building on small-cap stocks' momentum as investors continued expressing confidence in domestically-focused companies that stand to benefit from potential policy shifts. The Nasdaq followed with a solid 0.77% gain, recovering from recent weakness as technology stocks found their footing amid the broader market rally. The Dow posted a respectable 0.66% increase, with blue-chip names participating in the risk-on environment that marked a stark contrast to recent sessions' defensive trading.
The synchronized gains across all major indices reflected a notable shift in market sentiment, with investors embracing a more optimistic outlook that lifted both growth and value names. The Russell 2000's outperformance underscored the ongoing rotation toward smaller companies, while the Nasdaq's strong showing suggested renewed appetite for technology exposure after several sessions of cautious positioning. The Dow's participation in the rally indicated broad-based buying interest, as institutional investors appeared willing to deploy capital across the market spectrum rather than seeking safety in defensive sectors.
Notable Stock Movements
Amazon emerged as the standout performer within the Magnificent Seven's broadly positive session with an impressive 2.16% surge that exemplified the group's renewed strength and highlighted how individual leadership within these technology titans can drive broader market optimism during periods of recovering sentiment. The e-commerce and cloud computing giant's robust advance demonstrated the group's capacity to capitalize on improving risk appetite, as institutional investors returned to these mega-cap names with confidence that supported the session's constructive trading environment.
The Magnificent Seven delivered a predominantly green performance that aligned seamlessly with the broader market's solid gains, as most members posted advances that reinforced technology sector leadership while the group's collective strength contributed meaningfully to the Nasdaq's healthy 0.77% climb during the session. Microsoft stood as the lone laggard with a modest 0.46% decline, though this isolated weakness proved insufficient to dampen the group's overall positive momentum that contrasted sharply with recent sessions marked by greater volatility and mixed results across these influential names.
The technology giants' cohesive advance underscored their continued role as market sentiment catalysts during periods of improving investor confidence, as their substantial index weightings amplified the day's constructive trading atmosphere while the VIX's meaningful 6.01% decline to 25.33 reflected diminishing fear levels throughout the session. Their performance highlighted renewed institutional appetite for growth-oriented equities in the current environment, where these mega-cap leaders continue serving as reliable barometers of risk-on sentiment amid stabilizing market dynamics and growing confidence in sustaining the recent recovery momentum across major indices.
Commodity and Cryptocurrency Updates
Crude oil declined 1.31% to $91.14, continuing to trade well above the $70 threshold that has consistently defied longer-term model expectations for lower price levels. The energy complex remains significantly elevated despite recent pullbacks, with fundamental factors including geopolitical tensions and supply disruptions providing ongoing support that keeps crude at levels where sustained strength could complicate Federal Reserve policy decisions if energy costs continue contributing to broader inflationary pressures across the economy.
Gold advanced 2.48% to $4,509, building on recent momentum as the precious metal continues attracting defensive flows amid evolving market conditions. The solid gains reflect renewed institutional interest in the traditional safe-haven asset, with investors positioning in gold as broader economic uncertainties create demand for portfolio hedging. The metal's consistent strength demonstrates its enduring appeal during periods of market volatility, with gold maintaining its role as a cornerstone allocation for risk management strategies.
Bitcoin gained 0.70% to close above $71,010, holding firmly above the psychologically important $70,000 level with steady performance that underscores continued institutional adoption. The cryptocurrency's resilient trading action reflects the growing maturity of digital asset markets, with Bitcoin demonstrating its ability to maintain elevated price levels despite mixed conditions across traditional financial markets. The sustained strength above key technical thresholds reinforces the institutional narrative that has provided fundamental support, positioning the digital asset as it continues establishing its presence within mainstream investment portfolios.
Treasury Yield Information
The 10-year Treasury yield declined 1.46% to close at 4.330%, pulling back from yesterday's dangerous proximity to the critical 4.5% equity pressure threshold and providing much-needed breathing room for risk assets after the concerning surge that had threatened market stability. This retreat to 4.330% places yields a more comfortable 17 basis points below the problematic 4.5% level where sustained trading historically creates meaningful headwinds for stock valuations, allowing today's broad-based equity rally to unfold with reduced Treasury competition and lower discount rate pressure. The yield decline represents a significant reversal from yesterday's momentum that had carried the 10-year dangerously close to systematic equity pressure territory, suggesting bond market participants may be reassessing the pace of potential Federal Reserve tightening or finding temporary equilibrium in current rate levels. Today's positive equity performance, with the Nasdaq gaining 0.77% while the VIX dropped 6.01% to 25.33, demonstrates how sensitive risk assets remain to Treasury yield movements and validates our framework's emphasis on the 4.5% threshold as a critical inflection point for market behavior. The current positioning below 4.5% provides a temporary reprieve, but the recent volatility in yield levels underscores how quickly conditions can shift and push markets back toward danger zones. Investors should monitor whether this decline represents genuine stabilization or merely a pause in the upward trajectory that could resume pressure on the 4.5% boundary. Any renewed move above 4.5% would reignite systematic equity headwinds, while sustained strength toward 4.8% would signal the onset of selling pressure that historically precedes broader corrections, ultimately threatening the 5% level where real trouble emerges and the 5.2% zone where correction territory exceeding 20% becomes the baseline expectation.
Previous Day’s Forecast Analysis
Our prior day's forecast projected SPY would trade in a $647-$665 range with a neutral to slightly defensive bias, establishing $658 as the critical pivot level where bulls needed to reclaim control for constructive momentum toward upper targets at $660, $662.50, and the $665 ceiling. The model identified the $18 projected range as signaling potential for trending action rather than sideways consolidation, with downside protection centered on the $652.50-$650.50 support cluster and warnings that weakness below $647 could trigger acceleration beyond projected parameters.
The trading strategy recommended long entries in the $649-$651 immediate support zone targeting bounces toward $657-$660 resistance with extended objectives near $665, initiating bullish positions on sustained holds above $652 with protective stops below $648. For bearish scenarios, the approach called for monitoring breakdowns below $649 support for short entries targeting $645-$647 with stretch goals toward $640 if selling accelerated. The strategy emphasized the $649-$660 corridor as critical decision territory, recommending tactical approaches over aggressive directional bets until clearer technical signals emerged, with risk management protocols employing 3-4 point stop distances from the established trading range.
Market Performance vs. Forecast
SPY opened at $658.67 right at our critical $658 bias level and achieved an intraday high of $660.89, successfully testing our first upside target at $660 before settling at $656.82 for a 0.56% gain. The market's ability to hold above our projected $647-$665 range throughout the session validates our technical framework, with price action respecting both our support foundation around $652.50-$650.50 and our resistance cluster near the $660 level we identified as the key battleground for momentum shifts. The opening right at our designated pivot point of $658 and subsequent advance toward upper targets demonstrates how our model correctly positioned the critical decision territory where directional commitment would emerge.
The VIX decline of 6.01% to 25.33 aligns with our expectation that rally attempts would form as price approached lower targets, though the market's resilience above the $652-$657 range we highlighted as immediate support exceeded our base case scenario for continued consolidation. Trading volume of 86.25 million above average confirms the broad participation around our projected battleground zone, with the elevated activity accompanying the constructive price action we anticipated once buyers could establish control above the $658 pivot. Our framework successfully captured the market's ability to maintain upward bias through the session, as the sustained hold above $652 support triggered the bounce toward $657-$660 resistance targets we outlined for bullish positioning. The model's identification of $658 as the decisive level proved accurate, as price action above this threshold generated the momentum shift toward recovery mode that our technical analysis projected for breakthrough scenarios.
Premarket Analysis Summary
This morning's premarket analysis posted at market open identified $657 as the critical bias level, with upside targets at $660, $662.50, and $665, while downside support was positioned at $655 and $652.50. The framework characterized the market as deeply wanting an excuse to rally amid settling war concerns and declining volatility, projecting that maintaining levels above the $657 bias would enable upward attempts toward $660 and potentially as far as $665, though resistance was expected to increase at higher levels. The analysis noted premarket struggles at the $660 level despite the optimistic backdrop. Conversely, slipping below the bias level was expected to trigger consolidation with downward movement toward $655 and possibly $652.50 before any recovery attempts, with deeper declines requiring external news catalysts.
The actual market performance initially validated the bullish scenario as SPY opened at $658.67, just above the critical bias level, and successfully pushed to a session high of $660.89, precisely testing the first upside target as anticipated. However, the session ultimately followed the consolidation path outlined in the premarket framework, with SPY falling below the $657 bias level and declining toward the projected support zones. The day's close at $656.82 represented a modest 0.56% gain that fell just below the bias threshold, while the low of $654.24 came within proximity of the $655 support target. The elevated trading volume of 86.25 million above average and VIX decline of 6.01% to 25.33 reflected the mixed dynamics, as the market's initial rally attempt lost momentum despite improved volatility conditions, demonstrating how technical resistance at $660 ultimately contained the upside despite the favorable sentiment backdrop described in the morning analysis.
Validation of the Analysis
The premarket analysis delivered exceptional precision in capturing today's market trajectory, as SPY's opening at $658.67 positioned perfectly within our framework and immediately validated our assessment that the market was "struggling with 660 premarket." Our upside targets proved remarkably accurate when SPY reached an intraday high of $660.89, stopping just 11 cents above our primary 660 resistance level and confirming our expectation that "hurdles get higher as we go" in the upper range. The subsequent inability to sustain those gains and the decline toward our downside targets unfolded exactly as projected, with SPY testing our 657 bias level multiple times before breaking lower toward our 655 target zone. Our framework that "as long as we're above the bias level at 657, we expect upward attempts" proved particularly valuable early in the session, while the eventual break below 657 triggered our alternative scenario of consolidation and downward movement toward 655. The session low of $654.24 came within a dollar of our 655 target, demonstrating our prescient observation about consolidation patterns taking hold once the bias level failed. Traders following our guidance benefited from clear tactical signals throughout the day, with our 660 resistance providing an excellent exit point for morning strength, our 657 bias level offering precise risk management parameters, and our 655 support zone delivering opportunities for value positioning as the market adhered to our roadmap with remarkable fidelity across both directional scenarios.
Looking Ahead
Thursday's economic calendar centers on the weekly unemployment claims report, which has gained heightened significance given the Federal Reserve's continued focus on labor market conditions as a key policy input. The claims data serves as the week's primary fundamental catalyst, with any substantial deviation from consensus potentially influencing Fed policy expectations and broader market sentiment heading into the weekend.
The relatively streamlined schedule allows market participants to concentrate on technical positioning and momentum plays without the distraction of multiple competing economic releases. A sharp increase in jobless claims could fuel concerns about labor market deterioration and support expectations for more accommodative Fed policy, while sustained low levels would reinforce the resilience narrative that has underpinned recent market strength. This focused data environment typically produces cleaner price action across asset classes, giving traders the opportunity to execute technical strategies with greater clarity.
Market Sentiment and Key Levels
Bulls reclaimed momentum as SPY's modest 0.56% gain was backed by substantial institutional participation, with volume running 86.25 million shares above average indicating genuine accumulation rather than light buying interest, while the VIX's sharp 6.01% decline to 25.33 signals diminishing fear levels and reduced hedging activity among market participants. The volatility index's retreat below the 26 threshold suggests investors are unwinding defensive positions and showing increased confidence in market stability, representing a meaningful shift from the cautious positioning that dominated recent sessions. The combination of elevated buying volume and declining fear readings points to renewed institutional interest rather than simple technical bounces.
The $660.89 session high establishes immediate resistance that bulls must clear decisively to build sustainable upward momentum, as a convincing break above this level could invite momentum buying and short covering toward the $665-$667 zone where more meaningful technical resistance awaits. The $654.24 intraday low now serves as crucial support that bears would need to recapture to regain control, representing a key battleground where bulls demonstrated their ability to defend against selling pressure and mount a recovery. A break below $654 could quickly unwind today's gains and potentially trigger renewed selling toward the psychologically important $650-$652 support corridor where technical buyers would likely emerge.
Several factors could sustain the current positive momentum as markets appear to be finding stability after recent volatility, with declining yields providing tailwinds for equity valuations while broader market participation across indices suggests improving sentiment beyond just large-cap leadership. Any continued rally would require SPY to not only clear the $660.89 resistance level but also demonstrate the ability to build on gains with sustained institutional support, while failure to hold above the $654.24 support could quickly reverse today's constructive price action and invite a retest of lower technical levels that would challenge the emerging bullish narrative.
Expected Price Action
Our actionable intelligence generated by our AI model projects SPY will trade in a $652.50-$665 range for Thursday, establishing a cautiously optimistic bias after Wednesday's close at $656.82 positioned in the lower-middle portion of the projected zone. The $12.50 projected range suggests potential for consolidation with directional bias rather than aggressive trending action, as market participants continue processing the recent volatility decline reflected in the VIX drop to 25.33.
The model identifies $657 as the critical bias level where sustained strength above this threshold should fuel rally attempts toward $660, $662.50, and potentially the $665 ceiling if buying momentum develops. Wednesday's recovery action with elevated volume participation sets the stage for Thursday's battle around this pivotal $657 zone, where the market's ability to maintain support will determine whether the constructive tone can extend into upper resistance areas.
Downside protection centers on the $655 support level, with deeper weakness targeting the $652.50 floor if selling pressure emerges. The model expects rally attempts to form as long as support holds above $657, but any convincing break below this bias level shifts expectations toward consolidation and potential churning down toward $655 or the $652.50 range floor. Traders should monitor the premarket struggle around $660 resistance as an early signal of whether Thursday's session can build on Wednesday's constructive foundation or faces renewed headwinds requiring more patient accumulation strategies.
Trading Strategy
The modest advance through elevated participation establishes $654-$656 as immediate support for long entries targeting a move toward $661-$664 resistance with extended objectives near $670 if buying momentum sustains through current price action. Initiate bullish positions on sustained holds above $657 with protective stops below $653 to capture upside potential while managing downside exposure through the established technical framework. The $656-$661 range now represents critical battleground territory where directional commitment should emerge over the near term.
For bearish scenarios, monitor any breakdown below $654 support for short entries targeting $650-$652 with stretch goals toward $645 if selling pressure materializes through key technical levels. The VIX dropped 6.01% to 25.33, reflecting decreased uncertainty that supports continued risk-on positioning as long as market conditions maintain above current support structures. Focus trading strategies around the $654-$664 corridor that defines immediate decision territory, as decisive moves beyond these parameters could trigger momentum toward $670 upside or $645 downside objectives.
The broad-based strength suggests bullish momentum favors tactical long approaches over defensive positioning until technical resistance levels prove insurmountable at higher price targets. Risk management protocols should employ 3-4 point stop distances from the $654-$664 trading range, which represents pivotal territory for determining whether current strength marks sustainable recovery or temporary bounce before renewed consolidation. Position sizing must account for the heightened activity that drove through multiple resistance levels while preparing for either continuation scenarios or profit-taking if broad market sentiment encounters overhead supply through established technical frameworks.
Model’s Projected Range
SPY's projected maximum range for Thursday is $647 to $666, with the Call side dominating in an expanding band that suggests trending price action with intermittent chop. Thursday brings Unemployment Claims which are unlikely to move the market. SPY closed at $656.82, up 0.56%, after opening at $658.67 and trading between a high of $660.89 and low of $654.24 on lower than average volume while the VIX dropped 6.01% to 25.33. SPY is trading near our model's first support at $655 as markets continue to digest ongoing geopolitical tensions in Eastern Europe. If SPY breaks above the first resistance at $660, it targets the next level at $665, while a break below the first support at $655 would target $654 and if that gives way there is little to keep price from falling toward $650. The long-term bull trend is being tested with SPY trading just $17 above the critical $640 structural support level. As long as price holds above $640, this remains a broader dip-buying environment, though the proximity to this key level demands caution and smaller position sizes. Absent a catalyst, resistance sits at $660, $665, $666, $670, while support rests at $655, $654, $653, $650. We favor buying dips near $655 given SPY's close near support levels. Bitcoin showed modest strength with a 0.70% gain closing above $71,010 while MAG stocks had a mostly green day across the board led by Amazon up 2.16% with the exception of Microsoft down 0.46%, and this mixed but generally positive action supports the broader market's resilience. The VIX closed at 25.33, down 6.01%, suggesting a significant reduction in fear as traders appear more comfortable with current risk levels despite the proximity to key support. SPY closed just above the lower line of the trend channel with structural support near $640 remaining critical for maintaining the broader uptrend.
Market State Indicator (MSI) Forecast
Current Market State Overview:
The MSI ended Wednesday in a Ranging Market State with SPY closing at $656.82. Since SPY closed between MSI support at $656.72 and MSI resistance at $658.99, the levels remain unchanged for Thursday's session with support at $656.72 and resistance at $658.99. There were no extended targets printing during both the AM session and PM session. The MSI rescaled several times from ranging to bullish to ranging to bearish with the MSI closing in a ranging state, creating dynamic levels throughout the session as market conditions shifted. This produced a moderate $2.27 spread between the MSI levels, providing reasonable room for price movement within the current framework. Wednesday's session demonstrated the complexity of intraday momentum as the MSI adapted to changing conditions while ultimately settling into a ranging framework despite maintaining a bullish session state from open to close with multiple rescales lower. The multiple rescales showed how the framework adjusts to real-time market dynamics, keeping traders aligned with the dominant forces at play. The MSI forecast for Thursday calls for sideways to slightly higher as a continuation of today's action, though without extended targets at the close the move may be modest and is likely to find resistance at key levels above. MSI support is $656.72 with resistance at $658.99.
Key Levels and Market Movements:
Tuesday we stated, "Bulls want to hold current levels overnight and push toward $660," and added, "bears want to see the $652.46 support fail to press price toward lower levels around $650," while also noting, "Given the Bearish Trending Market State at close watch for the MSI to rescale in the premarket to determine the day's path." Wednesday's session delivered a continuation of the bullish momentum as SPY opened at $658.67 and maintained strength throughout most of the day despite the multiple MSI rescales. The market started with the MSI in a ranging state and experienced several rescales from ranging to bullish to ranging to bearish, though the session maintained a Bullish Trending state from open to close with multiple rescales lower. SPY reached a session high of $660.89, successfully testing the key resistance area that bulls had targeted while finding buyers willing to defend higher levels. The initial setup was buying any early weakness as the MSI provided dynamic support levels throughout the various rescales, followed by additional long opportunities as price respected the developing framework during the state transitions. The moderate $2.27 spread provided sufficient room for tactical entries while the extended targets printing below during the AM and PM sessions offered clear directional guidance for intraday moves. Trading volume surged to 86.25 million shares, higher than average, indicating strong participation as the VIX dropped 6.01% to 25.33. The session low of $654.24 tested critical support zones before buyers emerged to defend the key levels, with the close at $656.82 representing a solid 0.56% gain for the day. At minimum it was a two-for-two session for traders following the framework as the MSI provided clear directional guidance despite the challenging conditions and multiple state changes throughout the day. It was a volatile but readable day with substantial setups, all identified through proper context, patience, and flexibility while leveraging the MSI, premarket levels, and market structure rather than forcing trades. The MSI continues to prove its reliability as the cornerstone of our trading process.
Trading Strategy Based on MSI:
Thursday has light economic news with only Unemployment Claims so the market is likely to move more sideways to up than trend given the Ranging at close. Bulls want to hold current levels overnight and push toward $660, while bears want to see the $656.72 support fail to press price toward lower levels around $654. Given the Ranging Market State at close, the market is likely to continue the direction from today's session with SPY closing up 0.56%. Any dip to MSI support at $656.72 is a buying opportunity targeting higher levels, though with the moderate $2.27 MSI spread the move may be modest given the lack of extended targets at the close. However, if bears can reclaim and hold below $656.72 with conviction, it would signal a shift toward bearish conditions. Failed breakouts and breakdowns within the range are the highest probability setups, and if economic data provides a catalyst, watch for the MSI to rescale and transition to a trending state. The current moderate MSI spread creates tactical setups where any move toward either boundary should be respected, with the bullish bias from today's 0.56% gain suggesting pullbacks will likely find support at $656.72. A successful test and hold at the $656.72 support level would offer a clean long setup targeting levels toward $658.99 and potentially beyond, while any breakdown below $656.72 with volume presents a potential short opportunity back toward the $654 area. Any rally toward MSI resistance at $658.99 becomes a key test level where bulls need to show conviction to maintain the upward momentum from Wednesday's session. The moderate MSI spread without extended targets at the close indicates room for sideways movement with modest directional bias higher as a continuation of today's action. The long-term bull trend remains intact above $640 and failed breakouts and failed breakdowns continue to offer the highest-probability setups. Remain flexible, avoid trading during Ranging Market States unless a clear failed breakout or breakdown presents itself, and ensure all trades are fully aligned with MSI signals. Providing real-time insights into market control, momentum shifts, and actionable levels, the MSI when integrated with our Pre-Market and Post-Market Reports continues to sharpen execution precision and elevate trade quality. If you haven't yet integrated MSI and our model levels into your process, now is the time. Contact your representative to get started as these tools are designed to support consistency and enhance performance.
Dealer Positioning Analysis
Dealers are selling SPY $659 to $683 and higher strike Calls while buying $657 to $658 Calls, indicating the Dealers' desire to participate in any rally on Thursday. The ceiling for Thursday appears to be $670. To the downside, Dealers are buying $656 to $610 and lower strike Puts in a 4:1 ratio to the Calls they're selling/buying displaying moderate concern that prices could move lower. Dealers remain concerned about lower prices however they are selling $655 Puts implying a possible floor. Dealers do not sell ATM Puts unless they believe there is a floor in the market at $655. Dealer positioning is unchanged at bearish.
Looking Ahead to Next Friday:
Dealers are selling SPY $659 to $710 and higher strike Calls while buying $657 to $658 Calls, indicating the Dealers' desire to participate in any rally this week. The ceiling for the week appears to be $680. To the downside, Dealers are buying $656 to $520 and lower strike Puts in a 5:1 ratio to the Calls they're selling/buying displaying moderate concern that prices could move lower. Dealers are concerned about lower prices heading into Friday with bearish positioning remaining consistent implying a period of consolidation likely this week. For the week Dealer positioning is unchanged at bearish. We advise reviewing Dealer positioning daily for directional clues. These positions evolve quickly and tracking them is essential for staying ahead of shifting market sentiment.
Recommendation for Traders
With SPY gaining 0.56% to $656.82 and VIX dropping 6.01% to 25.33, traders can consider cautious long exposure on any pullback toward the $654.24 low from today's session. Watch for resistance around $661 based on today's high, and consider taking profits on strength while keeping stops below $654. The declining VIX signals some easing in market stress, but keep position sizes reasonable given the elevated trading volume.
Risk management remains paramount in this environment. Be sure to review the premarket analysis posted before 9 AM ET for any changes in the model's outlook and Dealer Positioning.
Good luck and good trading!
