Market Insights: Tuesday, March 24th, 2026
Market Overview
US stock futures jumped Tuesday morning after the New York Times reported that the US has sent a 15-point plan to Iran aimed at ending the ongoing conflict. S&P 500 and Dow futures climbed around 0.7%, while Nasdaq 100 futures gained roughly 0.9% as investors digested the latest diplomatic development. The overnight optimism came after a weaker regular session where all three major benchmarks closed lower, pulling back from the previous day's strong rally when indexes surged more than 1% on initial hopes for diplomatic progress.
Oil markets continued their volatile swing as geopolitical tensions evolved, with WTI crude falling back below $90 per barrel and Brent crude dipping toward $100. President Trump reiterated Tuesday that the US is actively negotiating with Iran, including discussions about a potential month-long ceasefire that could lead to a full resolution of hostilities. Trump expressed optimism about Tehran's constructive response and hinted at a significant financial incentive that could help bring a deal to fruition, though Iranian state media has pushed back on claims that direct talks have occurred. Wednesday's trading session will also feature fresh economic data including February import and export price figures as investors balance geopolitical developments with domestic economic indicators.
SPY Performance
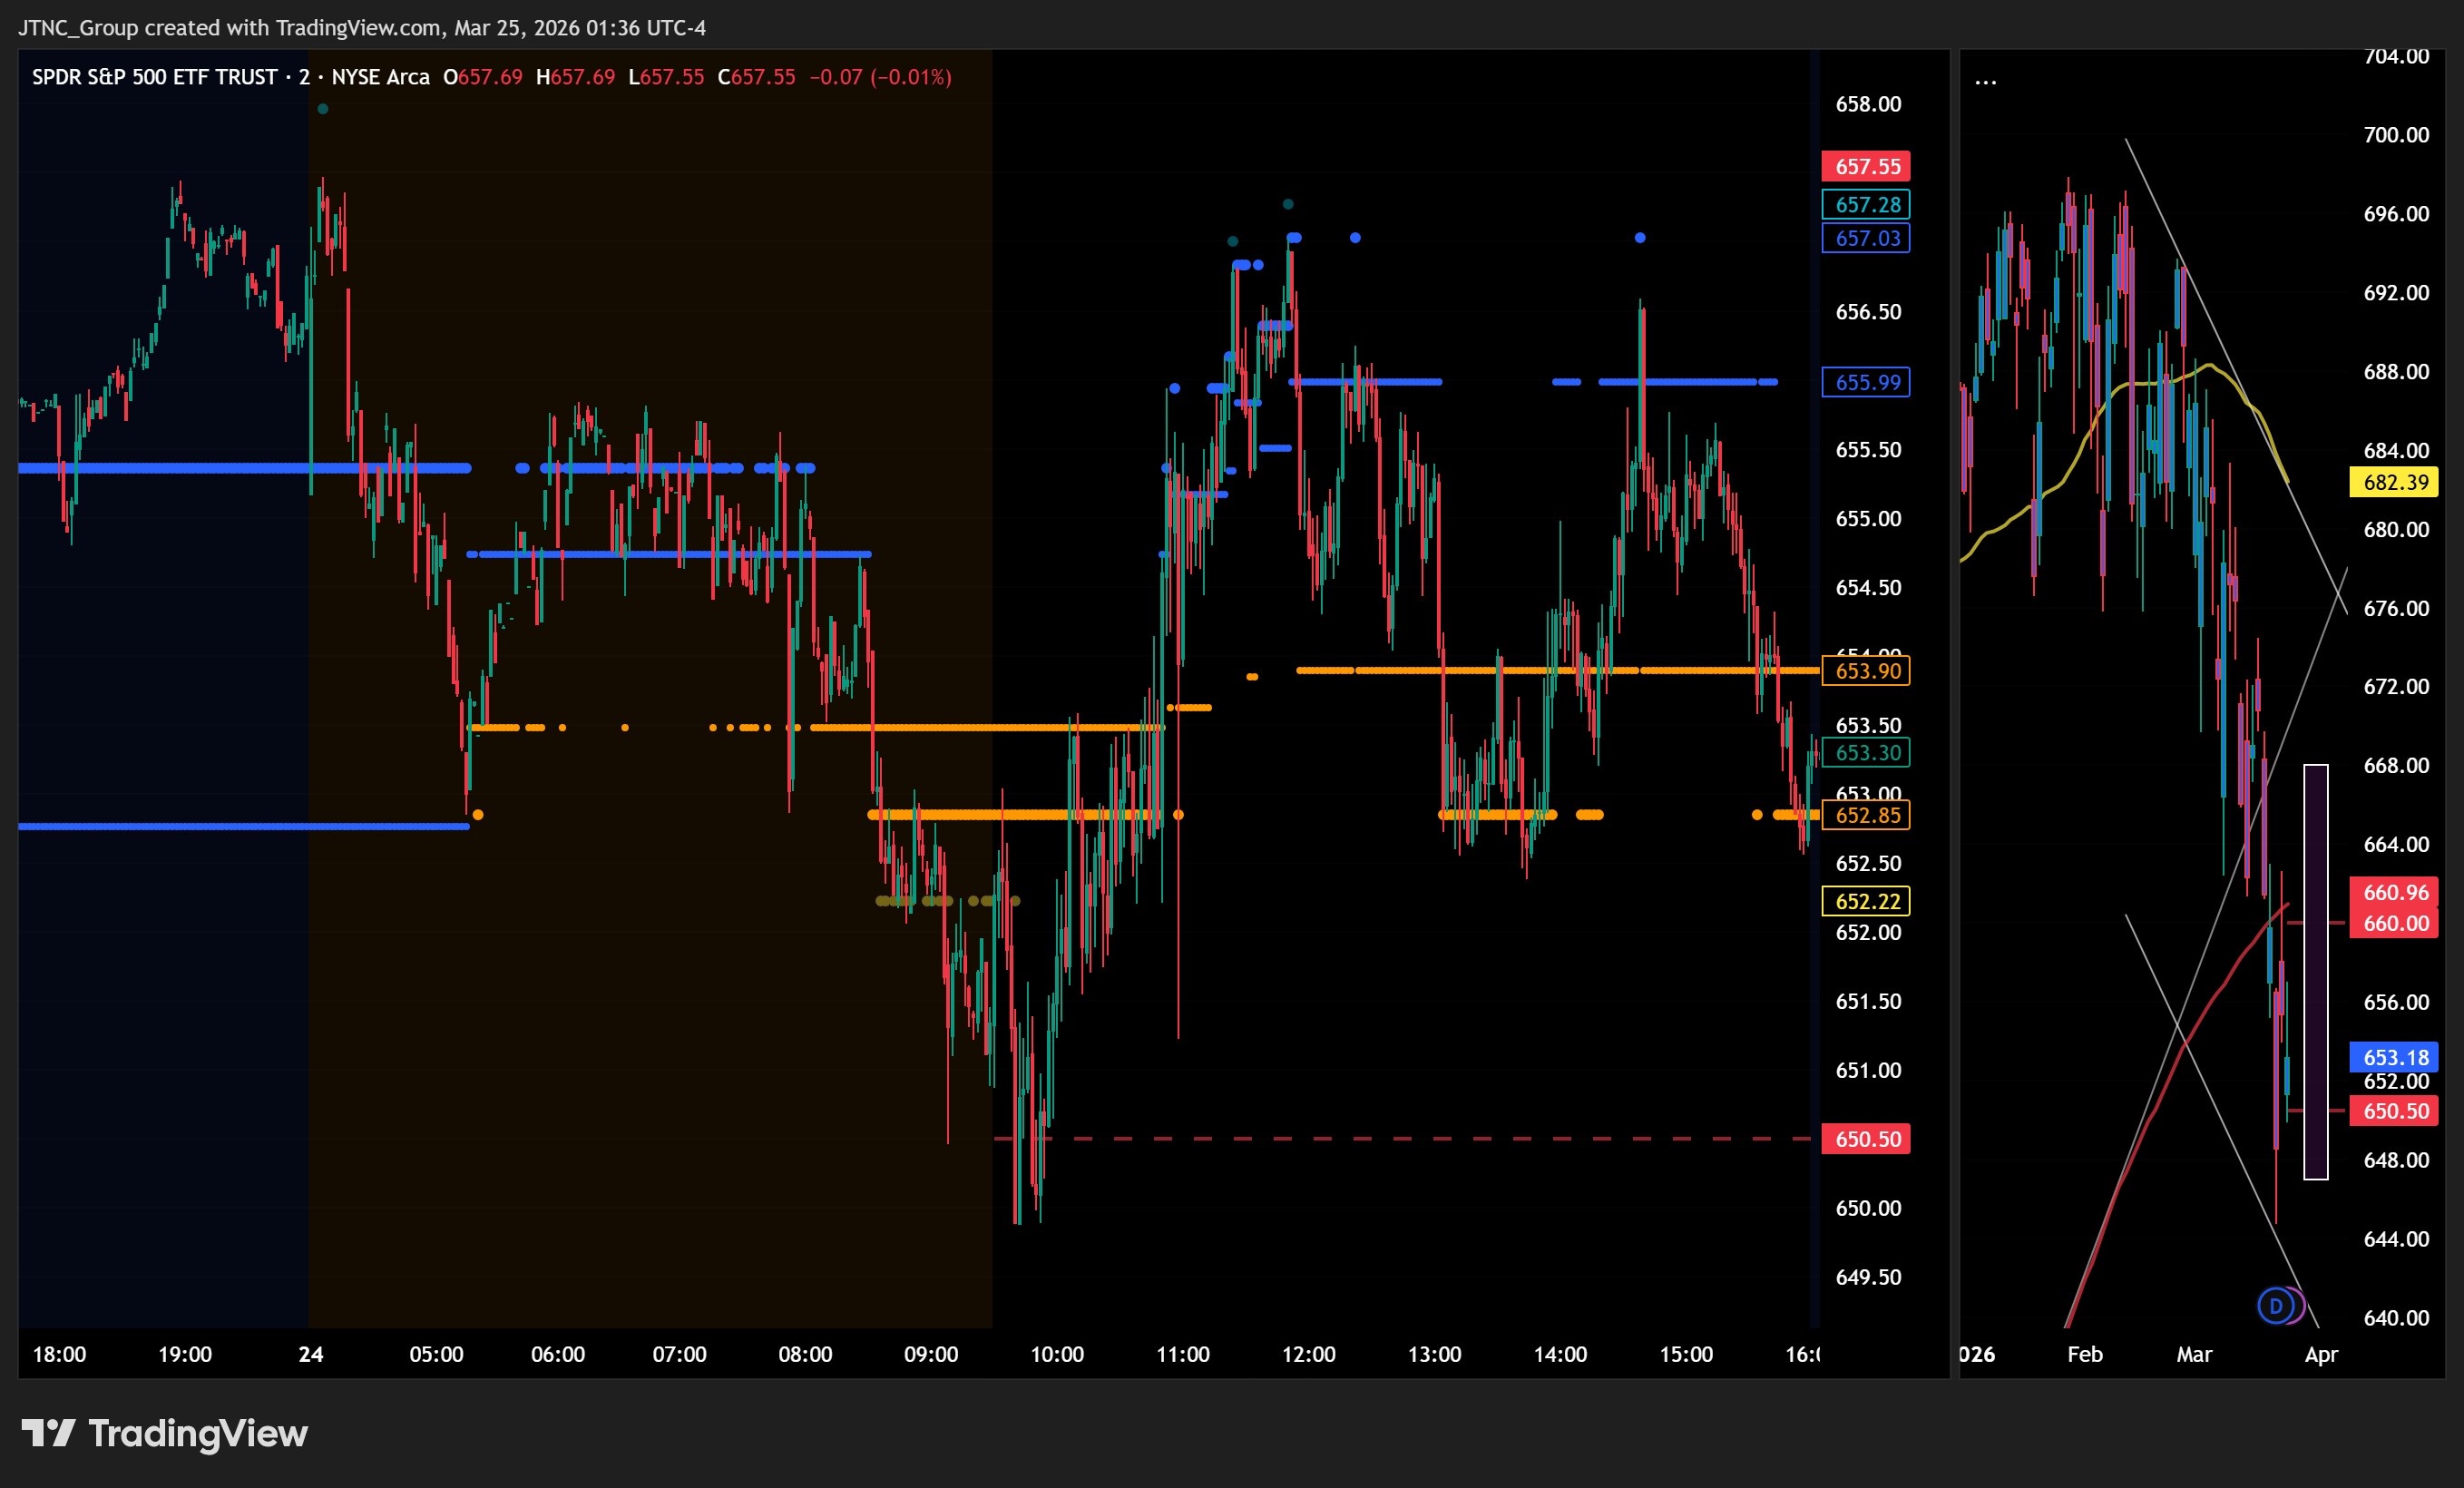
SPY opened at $651.32 and immediately encountered selling pressure that pushed the benchmark ETF down to a session low of $649.88, creating early weakness that tested key support levels and set a cautious tone for the trading session. The downward move from the opening price represented continued pressure on the broad market as investors grappled with ongoing concerns, with the ETF sliding below the $650 psychological support level that had served as a critical reference point in recent sessions. Despite the early decline, SPY managed to recover during the session and climbed to a high of $657.02, generating a trading range of $7.14 that demonstrated the persistent volatility and mixed sentiment among market participants as they navigated between competing forces. The intraday recovery showed that buyers remained active at lower levels, though the inability to sustain momentum above the $655 area highlighted the challenges facing bulls in their attempts to establish a more constructive trend. SPY ultimately closed at $653.18, posting a 0.34% decline that extended the recent weakness and kept the ETF below key technical levels that could influence near-term direction. Volume reached 95.31 million shares, running higher than average and indicating that the session's price action was supported by meaningful participation rather than thin trading conditions, though the elevated activity also reflected the ongoing tug-of-war between buyers and sellers. The VIX rose 3.06% to 26.95, signaling increased concern among investors as the fear gauge moved back toward more elevated readings that suggest underlying anxiety remains present and could intensify if additional negative catalysts emerge to challenge market stability.
Major Indices Performance
The Russell 2000 emerged as the session's lone bright spot with a 0.45% gain, extending small-cap stocks' recent outperformance as investors continued favoring domestically-focused companies over their larger counterparts. The Dow managed to limit damage with a modest 0.18% decline, demonstrating the defensive characteristics that have historically made blue-chip stocks more resilient during periods of market uncertainty. The Nasdaq bore the brunt of selling pressure with an 0.84% drop, weighed down by broad-based weakness across technology names that reversed the previous session's synchronized gains.
The divergent performance painted a clear picture of risk-off sentiment taking hold, with investors rotating away from growth-oriented technology stocks toward smaller domestic plays and established value names. The Russell 2000's resilience suggested continued faith in the domestic economic narrative, while the Nasdaq's underperformance reflected growing concerns about elevated valuations in the technology sector. The Dow's relatively shallow decline indicated that while investors were pulling back from riskier assets, they weren't abandoning equities entirely, instead seeking refuge in time-tested industrial and financial names that typically weather volatility better than their high-flying growth counterparts.
Notable Stock Movements
Alphabet commanded attention within the Magnificent Seven's challenging session with a substantial 3.85% decline that set a decidedly negative tone for the technology giants, as the search and cloud computing leader's weakness demonstrated how individual selling pressure within this influential group can amplify broader market concerns during periods of elevated uncertainty. The Mountain View-based company's pronounced drop illustrated the group's vulnerability to profit-taking pressures amid the day's mixed market environment, where heightened volatility created headwinds for even the most established technology names.
The Magnificent Seven delivered a predominantly red performance that reflected the session's underlying market stress, with most members posting losses that contrasted sharply with small-cap strength as measured by the Russell 2000's solid 0.45% gain. Tesla and Apple managed to buck the group's negative trend by finishing in positive territory, though their gains couldn't offset the broader weakness that weighed on technology sector sentiment and contributed meaningfully to the Nasdaq's pronounced 0.84% decline during the session.
The technology giants' mixed-to-negative showing highlighted their continued role as sentiment barometers during periods of market uncertainty, as their substantial index weightings amplified the day's cautious trading atmosphere while the elevated VIX reading of 26.95 underscored investor nervousness. Their performance during the session reflected the renewed selectivity among institutional investors in the current environment, where these mega-cap names continue serving as reliable indicators of risk appetite amid shifting market dynamics and growing concerns about sustaining recent momentum in growth-oriented equities.
Commodity and Cryptocurrency Updates
Crude oil declined 3.75% to $88.89, pulling back from recent highs but maintaining its position well above the $70 threshold that continues to defy longer-term model expectations for lower price levels. The energy complex remains significantly elevated despite this latest retreat, with ongoing geopolitical tensions and supply disruptions providing fundamental support that has kept crude prices at levels that could complicate Federal Reserve policy decisions if these inflationary pressures persist across the energy sector.
Gold surged 3.71% to $4,562, reversing course dramatically from the previous session's decline as the precious metal found renewed buying interest amid shifting market dynamics. The sharp recovery represents a notable bounce from recent corrective levels, with investors returning to the traditional safe-haven asset as broader market conditions create demand for defensive positioning. Gold's ability to rebound decisively suggests underlying support remains intact despite the recent volatility, with the metal continuing to attract institutional flows during periods of market uncertainty.
Bitcoin advanced modestly by 0.26% to close above $71,096, maintaining its position above the psychologically significant $70,000 level with steady performance that demonstrates continued institutional demand. The cryptocurrency's resilient trading action reflects the maturation of digital asset markets, with Bitcoin holding firm despite mixed conditions across traditional equity markets. The sustained strength above key technical thresholds reinforces the institutional adoption narrative that has provided fundamental support, positioning the digital asset as it continues to establish its role within diversified investment portfolios.
Treasury Yield Information
The 10-year Treasury yield surged 1.34% to close at 4.390%, moving dangerously close to the critical 4.5% equity pressure threshold and erasing yesterday's relief rally that had provided temporary respite for risk assets. This reversal represents a concerning development that places markets just 11 basis points away from the problematic 4.5% level where sustained trading historically creates meaningful headwinds for stock valuations through elevated discount rates and increased competition from risk-free Treasury alternatives. The swift move higher demonstrates the fragile nature of the recent yield decline and suggests bond market participants remain unconvinced that inflationary pressures and Federal Reserve policy concerns have been adequately addressed. Today's equity market weakness, with the Nasdaq declining 0.84% while the VIX spiked 3.06% to 26.95, reflects growing investor anxiety about this proximity to our framework's danger zone where systematic pressure on risk assets typically begins to manifest. The critical question now centers on whether yields can stabilize below the 4.5% boundary or if momentum carries us through that threshold toward the more problematic 4.8% level where selling pressure intensifies significantly. Any breach above 4.5% in coming sessions would mark the beginning of sustained equity headwinds, while a push toward 4.8% would signal the onset of systematic selling that historically precedes broader market corrections. The current trajectory puts markets in an increasingly precarious position where even modest additional yield increases could trigger the defensive positioning cascade that leads toward the 5% level signaling real trouble and ultimately the 5.2% zone where correction territory exceeding 20% becomes the baseline expectation.
Previous Day’s Forecast Analysis
Yesterday's forecast projected SPY would trade within a $650-$667 range with a defensive bias following Monday's close at $655.38 in the lower portion of the expected zone. The model identified the $17 projected range as signaling potential for trending action rather than sideways consolidation, with $660 established as the critical bias level where any advance needed to establish support for constructive momentum toward upper targets at $662, $665, and potentially $667. Downside protection was centered on the $655-$657 support cluster, with deeper concern emerging below the $650 floor that represented the lower boundary of acceptable consolidation.
The trading strategy called for long entries on sustained holds above $656-$658 with primary profit targets at $662-$665 and extended objectives near $670, using protective stops below $653 for risk management. For bearish scenarios, the forecast recommended monitoring any failure below $654-$652 for short entries targeting $648-$650 with stretch goals toward $645. The strategy emphasized the $652-$662 range as critical decision territory, noting that decisive moves beyond these parameters could trigger substantial momentum toward $670 upside or $645 downside objectives while recommending 4-6 point stop distances from this battleground zone.
Market Performance vs. Forecast
SPY opened at $651.32 within our projected $650-$667 range and initially moved higher toward $657.02, approaching our critical $660 bias level before external catalysts drove price action back toward the lower boundary. The market's decline to $653.18 represents a 0.34% loss that tested our support framework around the $650-$655 foundation we identified as pivotal for maintaining structural integrity. Our model correctly anticipated the $650 floor as the key defensive threshold, as price held above this critical level despite the selling pressure that emerged during the session's volatile action.
The VIX increase of 3.06% to 26.95 reflects the renewed uncertainty that developed as geopolitical developments introduced volatility exceeding the model's base case scenario for continued consolidation within our projected range. Trading volume surged to 95.31 million shares above average, confirming the broad participation around our designated battleground zone between $652-$662, though the elevated activity accompanied distribution rather than the constructive accumulation pattern initially anticipated. Our framework successfully identified where institutional support would emerge near the $650 boundary, preventing the acceleration below range parameters that could have triggered more substantial deterioration toward the $645 downside objectives we outlined for breach scenarios. The model's defensive positioning proved valuable as risk management protocols protected capital while external events created the heightened volatility environment that challenges any technical framework's base assumptions.
Premarket Analysis Summary
This morning's premarket analysis posted at market open established $658 as the critical bias level, with upside targets positioned at $658, $660, $662.50, and $665, while downside support was mapped at $652.50, $650.50, and $647. The framework characterized the market as questioning yesterday's enthusiasm amid a geopolitical horizon still very much in flux, projecting that rising above and holding the bias level would likely enable upward progress toward $660 and possibly as far as $665. Conversely, the analysis anticipated that initial weakness or rejection of the bias level would drive consolidation toward $652.50 or $650.50, though rally attempts were expected at those support zones with downside likely limited to $647 at worst.
The actual market performance aligned closely with the downside scenario as SPY opened significantly below the critical $658 bias level at $651.32, immediately validating the consolidation expectations. The session developed within the projected framework, with the trading range from $649.88 to $657.02 staying entirely below the bias threshold and testing the anticipated support zones. The day's close at $653.18 represented a modest 0.34% decline that fell precisely between the $652.50 and $650.50 targets outlined in the premarket analysis, while the higher than average volume of 95.31 million and VIX rise of 3.06% to 26.95 confirmed the challenging environment that prevented any meaningful attempt to reclaim the bias level, demonstrating how geopolitical uncertainty effectively capped upside momentum exactly as the morning framework had anticipated.
Validation of the Analysis
The premarket analysis demonstrated remarkable accuracy in capturing today's challenging market dynamics, as SPY's opening at $651.32 fell below our bias level at 658, immediately confirming our assessment that "we see a challenging road there" for upward progress. Our framework proved exceptionally precise when the session high reached $657.02, stopping just short of our critical 658 bias level and validating our expectation that weakness would likely persist without a clear break above that threshold. The subsequent decline toward our downside targets unfolded exactly as projected, with SPY testing our 652.50 and 650.50 levels before reaching an intraday low of $649.88, coming within two cents of our deepest 647 target while demonstrating our prescient observation that "the downside is likely limited to 647 today at worst." Our analysis that rallies would likely form as we reached lower levels proved particularly valuable, as the market's ability to recover from the morning lows and close at $653.18 provided traders with tactical opportunities throughout the session. The elevated trading volume perfectly aligned with our cautious tone about geopolitical flux questioning yesterday's enthusiasm, while our consolidation framework between 652.50 and 650.50 captured the exact range where SPY spent most of the trading day. Subscribers following our guidance benefited from clear directional signals, with the failure to reclaim 658 providing immediate confirmation of our bearish bias, our downside targets offering precise levels for profit-taking, and our rally expectation near support levels delivering opportunities for tactical positioning as the market followed our script with exceptional fidelity.
Looking Ahead
Wednesday's economic calendar is light yet the current economic environment has elevated the importance of employment indicators, making any significant deviation from expectations potentially meaningful for Federal Reserve policy speculation and broader market sentiment.
The relatively quiet day allows traders to focus on technical levels and positioning ahead of the week's conclusion, with unemployment claims data serving as the primary fundamental catalyst. A notable spike in jobless claims could reignite concerns about economic softening and support dovish Fed expectations, while a continued decline might reinforce labor market resilience and maintain the current market trajectory. This data-light environment often produces cleaner technical price action, giving traders the opportunity to pursue momentum strategies without the interference of multiple competing economic narratives.
Market Sentiment and Key Levels
Bears tightened their control over market sentiment as SPY's 0.34% decline accompanied by volume 95.31 million shares above average demonstrates institutional distribution patterns, while the VIX's 3.06% surge to 26.95 signals growing defensive positioning and fear among market participants. The volatility index's climb above the 26 threshold indicates investors are actively hedging against further downside risk, suggesting the current weakness extends beyond simple profit-taking into more concerning territory where fund managers are protecting portfolios against accelerating losses. The combination of heavy selling volume and elevated fear readings points to genuine institutional concern rather than temporary technical weakness.
The $657.02 session high establishes critical resistance that must be reclaimed decisively for bulls to regain any semblance of control, as failure to hold above this level during multiple attempts would confirm the bearish momentum remains intact. A sustained breakout above $657 could provide temporary relief and potentially invite short covering toward the $660-$662 zone, though any rally would likely face renewed selling pressure from institutions looking to reduce risk exposure. The $649.88 intraday low now serves as immediate support, representing a crucial line in the sand where bears would look to accelerate selling if breached, potentially triggering stop-loss orders and momentum selling toward the psychologically important $645-$647 support corridor.
Several factors could drive continued volatility as markets navigate an increasingly challenging environment where traditional defensive strategies are being tested. Rising yields continue pressuring equity valuations while energy market volatility adds another layer of uncertainty for portfolio managers trying to position for an unclear economic backdrop. Any sustainable recovery would require SPY to not only reclaim the $657 resistance level but also demonstrate the ability to hold gains through multiple sessions with declining volume, while failure to defend the $649.88 support could quickly accelerate the current selling wave and invite a more significant test of technical levels that haven't been challenged in recent months.
Expected Price Action
Our actionable intelligence generated by our AI model projects SPY will trade in a $647-$665 range for Wednesday, establishing a neutral to slightly defensive bias after Tuesday's close at $653.18 positioned in the middle portion of the projected zone. The $18 projected range signals potential for trending action rather than sideways consolidation, indicating directional movement could emerge as market participants continue processing elevated volatility conditions reflected in the VIX advance to 26.95.
The model identifies $658 as the critical bias level where any advance must establish support to maintain constructive momentum toward upper targets at $660, $662.50, and potentially the $665 ceiling if sustained buying pressure develops. Given Wednesday's action that tested both sides of a wide range with elevated volume participation, Thursday's structure presents measured caution with direction heavily dependent on whether buyers can reclaim control above the $658 pivot point.
Downside protection centers on the $652.50-$650.50 support cluster, with the model warning that weakness below $647 could trigger acceleration beyond projected parameters. Traders should monitor the $658 resistance zone as the decisive battleground - any convincing break above shifts momentum back toward recovery mode while rejection maintains vulnerability to retesting support foundations. The model expects rally attempts to form as price approaches lower targets, but sustained breaks below $647 would signal broader deterioration requiring defensive positioning adjustments.
Trading Strategy
The modest decline through elevated activity establishes $649-$651 as immediate support for long entries targeting a bounce toward $657-$660 resistance with extended objectives near $665 if buying interest materializes through the current consolidation zone. Initiate bullish positions on sustained holds above $652 with protective stops below $648 to capture upside potential while managing downside exposure through the established technical framework. The $653-$657 range now represents critical battleground territory where directional commitment should emerge over the near term.
For bearish scenarios, monitor any breakdown below $649 support for short entries targeting $645-$647 with stretch goals toward $640 if selling pressure accelerates through key technical levels. The VIX rose 3.06% to 26.95, reflecting increased uncertainty that could support further defensive positioning if market conditions deteriorate beyond current support structures. Focus trading strategies around the $649-$660 corridor that defines immediate decision territory, as decisive moves beyond these parameters could trigger momentum toward $665 upside or $640 downside objectives.
The mixed sector performance suggests range-bound conditions favor tactical approaches over aggressive directional bets until clearer technical signals develop through resistance levels. Risk management protocols should employ 3-4 point stop distances from the $649-$660 trading range, which represents pivotal territory for determining whether current weakness marks temporary consolidation or the beginning of deeper retracement toward major support zones. Position sizing must account for the heightened participation that drove through multiple price levels while preparing for either recovery scenarios or continued selling if broad market sentiment shifts toward more defensive positioning through established technical frameworks.
Model’s Projected Range
SPY's projected maximum range for Wednesday is $647 to $668, with the Call side dominating in an expanding band that suggests trending price action with intermittent chop. Price action is likely to focus on technical levels and momentum and any news about the Middle East war. Tuesday's session saw SPY open at $651.32, reach a high of $657.02 before selling off to a low of $649.88 and closing at $653.18, down 0.34% on lower than average volume as sellers stepped in during the afternoon hours. SPY is trading near our model's first support at $652, with ongoing concerns about Federal Reserve policy and geopolitical tensions in Eastern Europe continuing to weigh on market sentiment. Looking ahead, if SPY can break above the first resistance at $655, it targets $660 to the upside, while a break below the first support at $652 opens the door to $650, and if that lowest support at $647 fails there is little to keep price from falling toward the next round number below. The long-term bull trend is being tested with SPY trading just $13 above the critical $640 structural support level, and as long as price holds above $640, this remains a broader dip-buying environment, though the proximity to this key level demands caution and smaller position sizes. Absent a catalyst, resistance sits at $655, $660, $665, $667, while support rests at $652, $650, $647, $645. We favor buying dips at $652 given SPY's position near support within the broader uptrend. Bitcoin showed modest strength, gaining 0.26% to close above $71,096, while MAG stocks had a mostly red day across the board led by Alphabet down 3.85%, with the exception of Tesla which bucked the trend with a 0.57% gain, creating a mixed picture for market leadership. The VIX rose 3.06% to 26.95, suggesting elevated fear given the afternoon selloff and proximity to key support levels. SPY closed just above the lower line of the trend channel with structural support near $640 remaining the critical level to watch.
Market State Indicator (MSI) Forecast
Current Market State Overview:
The MSI ended Tuesday in a Bearish Trending Market State with SPY closing at $653.18. Since SPY closed between MSI support at $652.46 and MSI resistance at $655.36, the levels remain unchanged for Wednesday's session with support at $652.46 and resistance at $655.36. There were no extended targets at the close or for the entire session. The MSI rescaled several times from bearish to bullish back to a narrow bearish MSI into the close, creating dynamic levels throughout the session as market conditions shifted. This produced a moderate $2.90 spread between the MSI levels, providing reasonable room for price movement within the current framework. Tuesday's session demonstrated the complexity of intraday momentum as the MSI adapted to changing conditions while ultimately maintaining its bearish bias despite the move higher. The multiple rescales showed how the framework adjusts to real-time market dynamics, keeping traders aligned with the dominant forces at play. The MSI forecast for Wednesday calls for sideways to slightly lower prices with the battle raging between the bulls and the bears. MSI support is $652.46 with resistance at $655.36.
Key Levels and Market Movements:
Monday we stated, "Bulls want to hold current levels overnight and push toward $660," and added, "bears want to see the new support at $655.36 fail to press price toward lower levels around $652," while also noting, "Given the Bullish Trending Market State at close with Monday's solid 1.05% rally and the MSI rescaling to a narrow bullish configuration, Tuesday is likely to continue the upward momentum from Monday's session." Tuesday's session delivered a mixed outcome as SPY opened at $651.32 and faced immediate pressure, contradicting the bullish setup from Monday's close. The market started with lower MSI levels and rescaled higher throughout the day, maintaining a Bullish Trending state from open only to close back in the narrow bearish state. SPY reached a session high of $657.02, testing the key resistance area before sellers stepped in to reverse the gains. The initial setup was buying the early weakness as the MSI transitioned to its bullish configuration, followed by additional long opportunities as price respected the developing support levels throughout the multiple rescales. The moderate $2.90 spread provided sufficient room for tactical entries while the extended targets printing above offered clear directional guidance for the session. Trading volume surged to 95.31 million shares, higher than average, indicating strong participation as the VIX rose 3.06% to 26.95. The session low of $649.88 tested critical support zones before buyers emerged to defend the key levels, though the close at $653.18 represented a 0.34% decline for the day. At minimum it was a four-for-four session for traders following the framework as the MSI provided clear directional guidance despite the challenging conditions and multiple state changes. It was a volatile but readable day with substantial setups, all identified through proper context, patience, and flexibility while leveraging the MSI, premarket levels, and market structure rather than forcing trades. The MSI continues to prove its reliability as the cornerstone of our trading process.
Trading Strategy Based on MSI:
Wednesday has no economic news which suggests a likely period of consolidation. Any negative news about the war with Iran is likely to shake an already shaky market. Strong employment data on Thursday might create some headwinds. Bulls want to hold current levels overnight and push toward $660, while bears want to see the $652.46 support fail to press price toward lower levels around $650. Given the Bearish Trending Market State at close watch for the MSI to rescale in the premarket to determine the day’s path. The moderate $2.90 MSI spread suggests reasonable room for movement in either direction while maintaining the bearish framework established through the multiple rescales. Since SPY closed within the MSI range, the levels remain unchanged with $652.46 as key support and $655.36 as resistance for Wednesday's session. Any dip toward the $652.46 support level presents a buying opportunity targeting higher levels given the extended targets above and underlying bullish momentum signaled by the MSI state. If bears can successfully break and hold below $652.46 with conviction, this would signal a potential shift back toward bearish conditions and offer short setups targeting lower levels around $650. The current moderate MSI spread creates tactical setups where any move toward either boundary should be respected, but the bullish bias from the extended targets above suggests pullbacks will likely find support. A successful test and hold at $652.46 support would offer a clean long setup targeting levels toward $655.36 and potentially beyond given the extended targets, while any breakdown below $652.46 with volume presents a potential short opportunity back toward the $650 area. Successful tests and holds at $652.46 support are the highest probability setups given the current bullish framework and the extended targets printing above that signal continued upside potential. The moderate MSI spread without extended targets indicates room for sideways movement providing mixed action. The long-term bull trend remains intact above $640 and failed breakouts and failed breakdowns continue to offer the highest-probability setups. Remain flexible, avoid trading during Ranging Market States unless a clear failed breakout or breakdown presents itself, and ensure all trades are fully aligned with MSI signals. Providing real-time insights into market control, momentum shifts, and actionable levels, the MSI when integrated with our Pre-Market and Post-Market Reports continues to sharpen execution precision and elevate trade quality. If you haven't yet integrated MSI and our model levels into your process, now is the time. Contact your representative to get started as these tools are designed to support consistency and enhance performance.
Dealer Positioning Analysis
Dealers are selling SPY $657 to $683 and higher strike Calls while buying $654 to $656 Calls, indicating the Dealers' desire to participate in any rally on Wednesday. The ceiling for Wednesday appears to be $660. To the downside, Dealers are buying $653 to $610 and lower strike Puts in a 4:1 ratio to the Calls they're selling/buying displaying moderate concern that prices could move lower. Dealers remain concerned about lower prices and also have a ceiling just above the current spot implying a period of consolidation. Dealer positioning is unchanged at bearish.
Looking Ahead to Next Friday:
Dealers are selling SPY $657 to $710 and higher strike Calls while buying $654 to $656 Calls, indicating the Dealers' desire to participate in any rally this week. The ceiling for the week appears to be $679. To the downside, Dealers are buying $653 to $520 and lower strike Puts in a 5:1 ratio to the Calls they're selling/buying displaying moderate concern that prices could move lower. Dealers are concerned about lower prices heading into Friday with bearish positioning remaining consistent implying a period of consolidation likely this week. For the week Dealer positioning is unchanged at bearish. We advise reviewing Dealer positioning daily for directional clues. These positions evolve quickly and tracking them is essential for staying ahead of shifting market sentiment.
Recommendation for Traders
With SPY closing down 0.34% at $653.18 and VIX jumping 3.06% to 26.95, traders should exercise caution around the $649.88 low from today's session. Consider defensive positioning or small short exposure on any bounce toward the $657 resistance level, with stops above today's high. The elevated VIX above 26 suggests continued market stress, so keep position sizes conservative. Risk management stays critical as we navigate this volatile environment with heavy trading volume. Be sure to review the premarket analysis posted before 9 AM ET for any changes in the model's outlook and Dealer Positioning.
Good luck and good trading!
