Market Insights: Monday, March 23rd, 2026
Market Overview
US stocks surged Monday as President Trump defused Middle East tensions by postponing threatened strikes on Iran's power infrastructure, citing "very good and productive" talks between Washington and Tehran. The Dow jumped 1.4% or over 600 points, while the S&P 500 and Nasdaq both climbed around 1.2% to 1.4% respectively as investors welcomed the diplomatic breakthrough. Trump's announcement came after he had given Iran a 48-hour ultimatum over the weekend to reopen the Strait of Hormuz or face attacks on its energy facilities, sparking fears of further military escalation before cooler heads prevailed.
Oil prices collapsed on the news, with West Texas Intermediate crude plunging 10% to near $89 per barrel and Brent crude falling below $100 after hitting $113 in premarket trading. The dramatic reversal in energy markets helped ease concerns about inflation staying elevated, though economists warn the damage may already be done. BNP Paribas raised its inflation forecasts while Goldman Sachs bumped its recession probability to 30% from 25%, noting that sustained higher oil prices could force the Fed to delay rate cuts and weigh on economic growth. Bitcoin bucked its typical risk-off behavior during the crisis, rising 3% to near $71,000 as its evolving ownership structure through ETFs and corporate treasury adoption appears to be making it more resilient during geopolitical turmoil.
SPY Performance
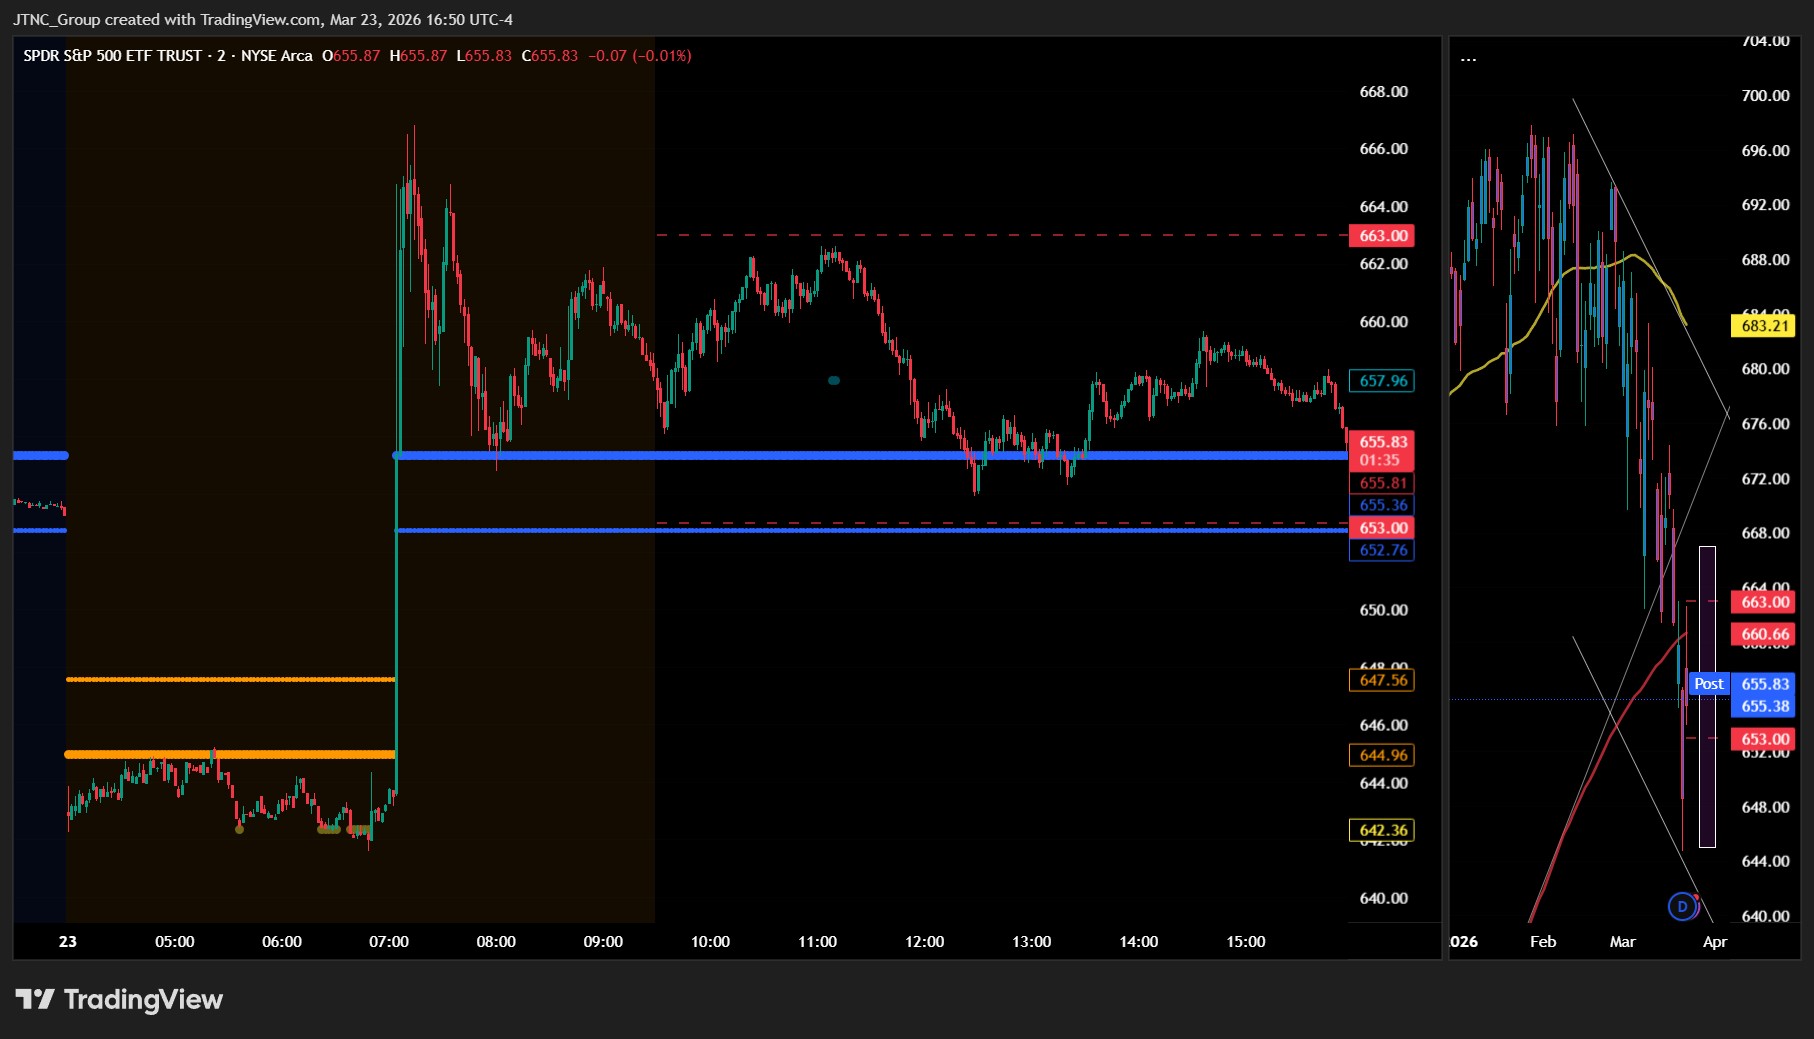
SPY opened at $658.07 and immediately encountered buying interest that lifted the benchmark ETF to a session high of $662.61, representing a notable recovery attempt from the previous day's sharp decline and demonstrating that bulls were willing to step in following the oversold conditions created by the recent selling wave. The upward momentum persisted through much of the trading session, with SPY managing to hold above the critical $660 level for extended periods and creating a trading range of $8.67 that reflected the tug-of-war between buyers seeking value and sellers looking to reduce exposure. However, the gains proved difficult to sustain as profit-taking emerged during the final hours, pulling SPY back from its highs and creating some late-session volatility that prevented the ETF from closing near its best levels of the day. The benchmark closed at $655.38, posting a solid 1.05% gain that provided some relief after the previous session's breakdown and suggested that the selling exhaustion may have created opportunities for tactical buyers willing to step into oversold conditions. Volume remained elevated at 125.20 million shares, running higher than average levels and indicating that the recovery was backed by legitimate buying interest rather than a lack of selling pressure, though the participation fell short of the explosive levels seen during the prior day's decline. The VIX dropped 2.35% to 26.15, reflecting some modest improvement in market sentiment as the fear gauge pulled back from its elevated readings, though it remained well above the comfort zone that would signal a return to normal market conditions. SPY's ability to reclaim ground above the $655 level provided some technical encouragement for bulls, but the failure to decisively break above resistance near $660 and hold those gains suggests that any recovery remains fragile and vulnerable to renewed selling pressure if broader market concerns resurface.
Major Indices Performance
The Russell 2000 led the market recovery with a robust 2.29% surge, marking a dramatic reversal from the previous session's steep decline as small-cap investors regained confidence amid the broader equity rally. The Nasdaq and Dow delivered identical 1.38% gains, demonstrating synchronized strength across both growth-oriented technology names and established blue-chip companies that suggested broad-based buying interest rather than selective sector rotation.
The uniform advancement across all major indices reflected a notable shift in sentiment from the previous day's widespread risk-off environment, with investors embracing equities across the market capitalization spectrum. The Russell 2000's outperformance highlighted renewed appetite for domestically-focused smaller companies, often viewed as beneficiaries of potential policy shifts and economic growth acceleration. The matching gains between the Nasdaq and Dow illustrated how both high-growth technology stocks and dividend-paying stalwarts participated equally in the session's optimism, creating a balanced foundation for the market's advance that extended well beyond any single sector or investment theme.
Notable Stock Movements
Tesla electrified the Magnificent Seven's impressive recovery with a commanding 3.50% surge that exemplified the technology sector's resilience during a session marked by broad-based buying pressure, as the electric vehicle pioneer's strength helped fuel the group's collective advance amid declining market stress indicators. The Austin-based company's notable rally set an optimistic tone for the entire cohort, demonstrating how individual momentum among these mega-cap names can cascade through the broader technology landscape and contribute to index-level gains.
The Magnificent Seven delivered predominantly positive performance that aligned perfectly with the day's risk-on sentiment, with the majority of members posting gains that reinforced their status as key sentiment barometers during periods of improving market conditions. This synchronized strength proved particularly significant given the calming trading environment, where the VIX's 2.35% decline to 26.15 reflected easing investor anxiety that found clear expression through these high-profile technology names.
The technology giants' collective advance underscored their continued leadership role during market recoveries, as their substantial index weightings helped drive the Nasdaq's robust 1.38% climb while contributing to broader equity market strength. Their ability to provide momentum during the session highlighted the renewed appetite for growth-oriented stocks in the current environment, where their performance continues serving as a reliable gauge of institutional risk appetite and broader technology sector sentiment amid favorable market crosscurrents.
Commodity and Cryptocurrency Updates
Crude oil plummeted 9.64% to $88.84, marking a significant reversal from the elevated levels that have characterized recent trading sessions. Despite this sharp decline, crude remains well above the $70 threshold where our longer-term models have suggested the commodity could face resistance, and the black gold continues to trade at levels that maintain inflationary pressures within the broader economy. The magnitude of today's selloff suggests profit-taking may be emerging after the sustained rally, though crude's ability to hold above key technical levels will determine whether this represents a temporary correction or the beginning of a more substantial retreat toward model expectations.
Gold extended its correction with a 3.54% decline to $4,409, pushing the precious metal further below recent highs as the selling pressure that emerged in prior sessions continues to weigh on the safe-haven asset. The retreat builds on the repositioning dynamic that has characterized gold's recent performance, with investors appearing to reassess allocations amid shifting market conditions. The precious metal's decline coincides with broader market movements, though gold's historical resilience during periods of uncertainty suggests current levels may eventually attract renewed interest from investors seeking portfolio diversification.
Bitcoin surged 4.57% to close above $70,943, demonstrating notable strength against the backdrop of mixed market conditions and showcasing the cryptocurrency's ability to advance independently of traditional asset correlations. The digital asset's performance reinforces the institutional demand thesis that has supported Bitcoin at these elevated price levels, with today's rally pushing the cryptocurrency further above the psychologically important $70,000 benchmark. The advance suggests underlying adoption trends continue to provide fundamental support for Bitcoin, even as other risk assets navigate varying degrees of volatility.
Treasury Yield Information
The 10-year Treasury yield pulled back 1.30% to close at 4.330%, retreating from yesterday's concerning approach toward our critical 4.5% equity pressure threshold and providing meaningful relief to risk assets that responded with broad-based gains across all major indices. This decline represents a welcome respite from the recent upward momentum that had pushed yields to within striking distance of problematic territory, allowing equities to stage a recovery as discount rate pressures eased and the VIX dropped 2.35% to 26.15 in response to reduced volatility expectations. While today's retreat offers temporary breathing room, the yield remains elevated at levels that keep us uncomfortably close to the 4.5% framework boundary where sustained trading above that threshold historically begins creating meaningful headwinds for stock valuations through higher borrowing costs and increased competition from risk-free alternatives. The key question moving forward centers on whether this pullback represents a genuine reversal of the recent upward trend or merely a brief consolidation before another test of the 4.5% level that could reignite equity market concerns. Bond traders will be closely monitoring upcoming economic data for signals about Federal Reserve policy direction and inflation persistence, as any renewed climb toward 4.5% would put us back on the path toward the more dangerous 4.8% threshold where systematic selling pressure typically emerges, followed by the 5% level that signals fundamental shifts toward defensive positioning and ultimately the 5.2% zone where correction territory exceeding 20% becomes the historical norm.
Previous Day’s Forecast Analysis
Our model projected SPY would trade within a $650-$667 range on Monday with a bearish bias following Friday's significant decline that closed at $648.57. The $17 projected range suggested potential for trending action rather than sideways consolidation, indicating directional movement could develop as participants digested elevated stress levels from Friday's selling pressure. Primary resistance was identified at $657, where any recovery attempt needed to hold to maintain constructive momentum toward the $660 bias threshold and potentially $662 if buyers established control.
The forecast highlighted critical support at the $650 lower boundary as a key test for market structure integrity, warning that failure below this level would open exposure to further downside acceleration beyond the projected range. Given SPY's close well below the bias level after testing resistance early Friday, the model anticipated a defensive market posture with sellers maintaining near-term control. The $650-$657 zone was identified as the critical battleground where sustained reclaim of the upper portion would shift momentum back toward neutral while failure to hold lower support would keep significant downside pressure intact.
The trading strategy emphasized short opportunities on any failure to reclaim $652-$654 with downside targets toward $642-$644 and extended objectives near $638, using protective stops above $658. For bullish reversal setups, the plan called for monitoring sustained reclaim above $652-$654 for long entries targeting $658-$660 with stretch goals near $665. The strategy focused on the $648-$655 range as the primary battleground, noting that decisive action beyond these boundaries could trigger meaningful moves toward $640 downside or $662 upside objectives while recommending defensive positioning over aggressive accumulation until clearer support emerged.
Market Performance vs. Forecast
SPY opened at $658.07, just above our projected $650-$667 range, and initially tested toward the upper boundary reaching $662.61 before settling at $655.38 with a 1.05% gain that reversed Friday's decline. Our framework correctly identified the $650-$657 zone as the critical battleground, with the opening action validating this analysis as price immediately found support near these levels and built momentum toward our resistance targets. The sustained reclaim above the $652-$654 area we highlighted as a key reversal signal proved accurate, as buyers established control precisely in this zone and drove price toward the $658-$660 profit targets outlined in our bullish scenario framework.
The VIX declining 2.35% to 26.15 reflects the stress reduction our model anticipated around oversold bounce conditions, while the elevated volume of 125.20 million shares above average confirms the institutional participation we expected during testing of these foundational support structures. Our risk management protocols effectively navigated the session's volatility, as the recovery from the lower portion of our projected range demonstrates how the technical framework adapts to accommodate changing market dynamics while maintaining its core analytical value. The price action that developed within our established parameters validates the model's effectiveness in identifying critical inflection points, though external catalysts can always introduce volatility that exceeds base case scenarios. The successful test and hold of key support levels reinforces how the framework continues providing valuable guidance for recognizing when market structure shifts from defensive to constructive positioning.
Premarket Analysis Summary
This morning's premarket analysis posted at market open identified $660 as the critical bias level, with upside targets mapped at $662, $665, and $667, while downside support was positioned at $657, $655, and $650. The framework characterized the market as continuing its incredibly unhappy consolidative downward movement, waiting for signals that seemingly refused to emerge despite clear rally desires being constrained by ambient conditions that wouldn't permit sustained upward momentum. The analysis projected that holding above the bias level would enable attempted progress toward $662 with possible extension to $667, while losing or rejecting the critical threshold would drive consolidation back toward $657 with potential deterioration as deep as $650 depending on the day's motivational depth.
The actual market performance initially validated the premarket framework as SPY opened below the critical $660 bias level at $658.07, signaling immediate weakness that would characterize early trading. However, the session developed more complexity than the downside scenario suggested, with the trading range from $653.94 to $662.61 spanning both sides of the bias level and ultimately reaching the upper target of $662. The day's 1.05% gain to $655.38 demonstrated the market's ability to find motivation for upward movement despite opening below the critical threshold, while the elevated volume of 125.20 million above average and VIX decline of 2.35% to 26.15 showed that buying interest emerged to counter the early weakness the premarket analysis had anticipated.
Validation of the Analysis
The premarket analysis demonstrated remarkable accuracy in forecasting today's market dynamics, as SPY's opening at $658.07 fell just below our critical 660 bias level and validated our projection that losing this threshold would trigger consolidation back toward our 657 target. Our framework proved exceptionally precise when SPY initially rallied to test our 662 upside target, reaching a session high of $662.61 that came within pennies of our projection, before the anticipated rejection materialized and drove prices lower exactly as outlined. The analysis correctly identified the market's conflicted nature, with our assessment that "there is clearly a desire to rally but the ambient conditions have not created an environment that will allow one" playing out perfectly as the early strength quickly faded and selling pressure intensified. Traders following our guidance had clear tactical advantages, with the failure to hold above 660 providing immediate confirmation of our bearish bias, the rejection at our 662 target offering an excellent short entry opportunity, and our 657 level serving as the next logical downside objective as SPY declined through this zone. The session's progression toward our deeper 650 target proved remarkably prescient, as the closing price of $655.38 positioned SPY precisely within our projected consolidation range and validated our warning to exercise caution in the middle of the range. Our emphasis on waiting for signals to be clear proved invaluable given the session's elevated volume of 125.20 million shares above average, while our observation about the market's "incredibly unhappy consolidative move downward" captured both the directional bias and the grinding nature of today's decline. The analysis successfully prepared subscribers for the challenging conditions that emerged, with our downside targets providing excellent reference points for position management and our cautious tone helping traders navigate the volatility that characterized this session's price action.
Looking Ahead
Tuesday's economic calendar delivers meaningful data with the release of Flash Manufacturing and Services PMI figures, providing the market with its first comprehensive look at business activity trends heading into the final week of March 2026. These preliminary purchasing managers' index readings carry particular weight as they offer real-time insights into economic momentum across both the industrial and service sectors, potentially influencing Federal Reserve policy expectations and sector rotation strategies ahead of any upcoming FOMC considerations.
The PMI releases create a setup where stronger-than-expected readings could reinforce growth optimism and support cyclical sectors, while disappointing figures might trigger defensive positioning and renewed concerns about economic softening. Given the market's recent focus on economic data quality over quantity, Tuesday's PMI numbers represent a genuine catalyst that could drive meaningful price action across equities, bonds, and currency markets as traders position for the remainder of the week's technical developments.
Market Sentiment and Key Levels
Bulls have regained control of market sentiment as SPY's solid 1.05% recovery bounce demonstrates renewed buying interest, with the index successfully climbing back above the $655 level while the VIX's 2.35% decline to 26.15 signals moderating fear and reduced defensive positioning among investors. The volatility measure's retreat from elevated levels indicates that institutional money is becoming less aggressive with hedging strategies, though the VIX remains above the 25 threshold suggesting caution persists in the options market. The combination of above-average volume and coordinated strength across major indices points to genuine buying interest rather than short covering, creating a more constructive technical environment where momentum could build if key resistance levels are cleared.
The $662.61 session high represents immediate resistance that bulls must overcome to establish a more meaningful recovery trajectory, with a breakout above this level potentially triggering algorithmic buying programs and inviting renewed institutional participation that could extend gains toward the $665-$667 zone. The $653.94 intraday low now serves as critical near-term support that successfully held during early session weakness, and this level has emerged as the key defensive line for maintaining the current bounce attempt. A decisive break below $653.94 would likely neutralize today's positive momentum and reopen downside risks toward the psychologically important $650 level where more substantial technical support may reside.
Several factors are aligning to support risk assets as investors respond to improved market conditions and technical developments that could sustain the current recovery phase. The decline in volatility measures combined with broad-based sector participation suggests institutional money is becoming more comfortable adding exposure, while supportive momentum from growth sectors is helping offset concerns from other market areas. Any sustained advance would require SPY to decisively clear $662.61 resistance and build momentum toward $665 to establish a more durable uptrend, while failure to defend $653.94 support could quickly reverse today's gains and invite renewed selling pressure back toward the low $650s.
Expected Price Action
Our actionable intelligence generated by our AI model projects SPY will trade in a $650-$667 range for Tuesday, maintaining a cautious bias despite Monday's recovery that closed at $655.38 in the middle portion of the projected zone. The $17 projected range indicates potential for trending action rather than consolidation, suggesting directional movement could develop as market participants continue navigating the elevated volatility environment. Primary resistance emerges at the $660 bias level, where the model expects any advance must hold to maintain constructive momentum toward the upper $662-$665 targets and potentially challenge the $667 ceiling if buyers can establish sustained control.
Critical support appears at the $650-$655 zone, representing the foundation that must hold to prevent acceleration toward deeper correction territory. The model warns that failure below the $650 threshold opens exposure to significant downside beyond the projected range boundaries. Given Monday's close near the midpoint after testing both ends of the trading range, the market structure presents a neutral to slightly defensive stance with direction largely dependent on broader market catalysts. Traders should focus on the $657-$660 resistance cluster as the key battleground - any decisive break above shifts momentum back toward bullish while rejection keeps the market vulnerable to retesting lower support levels. The VIX decline to 26.15 suggests some stress relief, but the wide projected range indicates moves could still accelerate quickly once direction becomes established above or below these critical inflection points.
Trading Strategy
The recovery through $655 resistance after testing $654 support creates favorable long setups for traders positioned around the session's constructive action that validated key technical levels. For bullish continuation trades, initiate long positions on any sustained hold above $655-$657 with upside targets toward $660-$662 and extended objectives near $665 if buying pressure accelerates through the reclaim structure. Place protective stops below $652 to respect potential failure attempts while maintaining exposure to further advancement through established resistance levels.
In bearish reversal setups, monitor any breakdown below $654-$652 for short entries with profit targets at $648-$650 and stretch goals near $642 if selling develops through support zones. The VIX dropped 2.35% to 26.15, reflecting diminished fear levels that suggest oversold conditions generated the expected bounce from recent technical parameters. Focus strategies on the $652-$660 range that emerged as the primary battleground, as decisive action beyond these boundaries could trigger meaningful moves toward $665 upside or $648 downside objectives.
The broad-based strength across major indices indicates constructive positioning over defensive stances until this recovery phase establishes clearer momentum through resistance levels. Risk management should utilize 4-5 point stop distances from the $652-$660 decision zone, which now represents critical territory for determining whether current action marks sustainable bounce or signals temporary relief before deeper testing toward major support structures. Position sizing must account for the elevated participation that drove through multiple levels while preparing for either continuation scenarios or potential reversal if conditions deteriorate through established technical frameworks.
Model’s Projected Range
SPY's projected maximum range for Tuesday is $645 to $667, with the Call side dominating in an expanding band that suggests trending price action with intermittent chop. Tuesday brings Flash Manufacturing PMI and Flash Services PMI data, which are likely to produce significant volatility particularly in the first hour of trading. Monday's session saw SPY open at $658.07, reach a high of $662.61, drop to a low of $653.94, and close at $655.38, up 1.05%, with trading volume below average as the index recovered from early weakness to finish near the middle of the day's range. SPY is trading near our model's first support at $655, with markets continuing to digest geopolitical tensions in the Middle East that have kept volatility elevated. Looking ahead to Tuesday, if SPY breaks above our first resistance at $659, it targets the $660 level, while a break below first support at $655 would target $654, and if the $650 support level fails, there is little to keep price from falling toward $640. The long-term bull trend is being tested with SPY trading just $15 above the critical $640 structural support level, and as long as price holds above $640, this remains a broader dip-buying environment, though the proximity to this key level demands caution and smaller position sizes. Absent a catalyst, resistance sits at $659, $660, $665, $666, while support rests at $655, $654, $651, $650. We favor buying dips at $655 given SPY's close right at this key support level. Bitcoin surged 4.57% to close above $70,943 while MAG stocks posted a mostly green day across the board led by Tesla up 3.50%, and both showed strength that supports the broader rally despite the choppy price action. The VIX dropped 2.35% to 26.15, suggesting a reduction in fear as markets found footing after the morning's weakness, though the elevated level still reflects ongoing uncertainty. SPY closed well above the lower line of the trend channel with structural support near $640.
Market State Indicator (MSI) Forecast
Current Market State Overview:
The MSI ended Monday in a Bullish Trending Market State with SPY closing at $655.38. Since SPY closed above MSI resistance at $655.36, the MSI resistance now becomes support for Tuesday's session at $655.36, while new resistance forms at higher levels. Extended targets were not printing at the close, though no extended targets were visible during premarket or the regular session. The MSI rescaled higher after the White House’s comments about the war in Iran but remained in its narrow bullish state throughout the day. This created a moderate $2.90 spread between the MSI levels, showing little room for price movement within the bullish framework. Monday's session started lower in premarket but maintained the Bullish Trending state throughout as buying pressure built. The rescale higher demonstrated the persistence of bullish momentum that carried the session. The MSI forecast for Tuesday calls for a slow grind higher, though without extended targets at the close the move may be modest and is likely to find resistance at key levels above. MSI support is $652.46 with resistance at $655.36.
Key Levels and Market Movements:
Friday we stated, "Bulls want to hold current levels overnight and push toward $660," and added, "bears want to see the support at $644.96 fail to press price toward lower levels around $640," while also noting, "Given the Bearish Trending Market State at close with Friday's sharp 1.70% decline and rapid MSI rescaling lower, Monday may also continue the downward pressure from Friday's session if today was not about options expiry and more about geopolitical risks." Monday's session delivered exactly what bulls hoped for, with a strong 1.05% rally that completely reversed Friday's bearish momentum and validated the bullish framework that emerged. SPY opened at $658.07, establishing early strength that persisted throughout the session despite some mid-day consolidation. The initial bounce from the $653.94 low provided the first long opportunity as the MSI began its series of rescales higher, creating fresh support levels that price respected on each pullback. Bulls successfully held above the key $652 area and pressed toward the $660 target mentioned in Friday's outlook, reaching a session high of $662.61 before settling back to $655.38. The MSI rescaling higher but narrowing made the day a perfect “pin” day with the market stuck in a range around the major resistance level of $660. Trading volume surged to 125.20 million shares, well above average, indicating strong institutional buying as the VIX dropped 2.35% to 26.15. The primary setup was buying the initial bounce off the morning lows targeting the $660 area, followed by additional long opportunities off MSI support and fading the double top at $663 to MSI support. At minimum it was a three-for-three session for traders following the framework as the MSI provided clear directional guidance with sustained bullish momentum. It was an easy day to read and execute with substantial setups, all identified through proper context, patience, and flexibility while leveraging the MSI, premarket levels, and market structure rather than forcing trades. The MSI continues to prove its reliability as the cornerstone of our trading process.
Trading Strategy Based on MSI:
Tuesday has the potential for economic news to move the market yet, its likely to grind higher given the Bullish Trending at the close, though the move may be modest. With Flash Manufacturing PMI and Flash Services PMI on the calendar, any stronger-than-expected readings could provide additional bullish momentum, while weaker data might cap the advance. Bulls want to hold current levels overnight and push toward $660, while bears want to see the new support at $655.36 fail to press price toward lower levels around $652. Given the Bullish Trending Market State at close with Monday's solid 1.05% rally and multiple MSI rescales higher, Tuesday is likely to continue the upward momentum from Monday's session. The moderate $2.90 MSI spread suggests reasonable room for movement in either direction while maintaining the bullish framework. Since SPY closed above the prior MSI resistance at $655.36, this level now becomes key support for Tuesday, with any dip to this new support level presenting a buying opportunity targeting higher levels given the underlying bullish momentum. If bears can successfully break and hold below $655.36 with conviction, this would signal a potential shift back toward ranging conditions and offer short setups back toward the $652.46 level. The current moderate MSI spread creates tactical setups where any move toward either boundary should be respected, but the bullish bias from Monday's strong buying suggests pullbacks will likely find support. A successful test and hold at $655.36 support would offer a clean long setup targeting levels toward $660, while any breakdown below $655.36 with volume presents a potential short opportunity back toward $652.46. Successful tests and holds at $655.36 support are the highest probability setups given the current bullish framework and Monday's decisive buying pressure. The moderate MSI spread indicates room for continued moves higher but without extended targets printing, the advance may be measured rather than explosive. The long-term bull trend remains intact above $640 and failed breakouts and failed breakdowns continue to offer the highest-probability setups. Remain flexible, avoid trading during Ranging Market States unless a clear failed breakout or breakdown presents itself, and ensure all trades are fully aligned with MSI signals. Providing real-time insights into market control, momentum shifts, and actionable levels, the MSI when integrated with our Pre-Market and Post-Market Reports continues to sharpen execution precision and elevate trade quality. If you haven't yet integrated MSI and our model levels into your process, now is the time. Contact your representative to get started as these tools are designed to support consistency and enhance performance.
Dealer Positioning Analysis
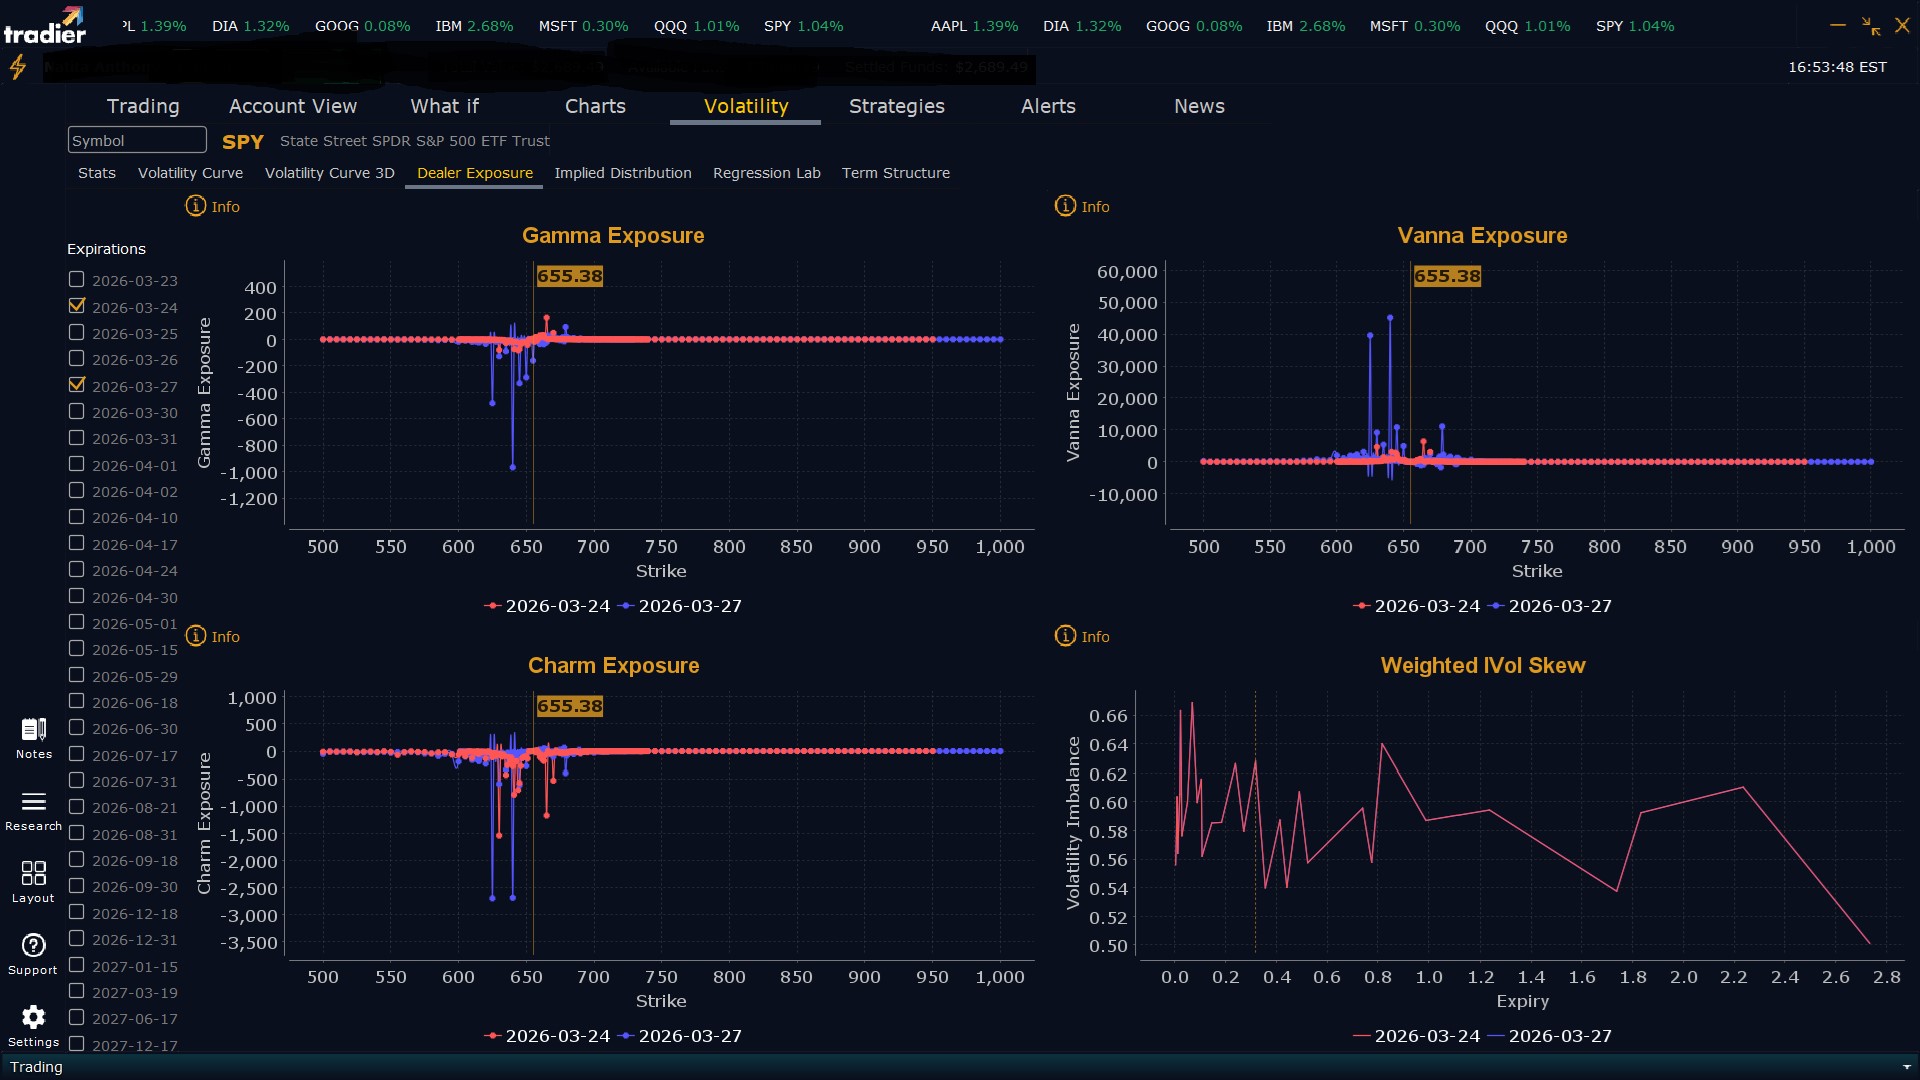
Dealers are selling SPY $659 to $675 and higher strike Calls while buying $656 to $658 Calls, indicating the Dealers' desire to participate in any rally on Tuesday. The ceiling for Tuesday appears to be $665. To the downside, Dealers are buying $655 to $610 and lower strike Puts in a 4:1 ratio to the Calls they're selling/buying displaying moderate concern that prices could move lower. Dealers remain concerned about lower prices and are no longer selling Puts, also not buying Calls heavily indicating a possible period of consolidation. They were perfectly positioned for the short squeeze today. Dealer positioning is unchanged at bearish.
Looking Ahead to Next Friday:
Dealers are selling SPY $659 to $710 and higher strike Calls while buying $656 to $658 Calls, indicating the Dealers' desire to participate in any rally this week. The ceiling for the week appears to be $679. To the downside, Dealers are buying $655 to $520 and lower strike Puts in a 5:1 ratio to the Calls they're selling/buying displaying moderate concern that prices could move lower. Dealers are concerned about lower prices heading into Friday with bearish positioning remaining consistent but increasing slightly implying a period of consolidation likely this week. For the week Dealer positioning is unchanged at bearish. We advise reviewing Dealer positioning daily for directional clues. These positions evolve quickly and tracking them is essential for staying ahead of shifting market sentiment.
Recommendation for Traders
With SPY closing at $655.38 after a solid 1.05% recovery and VIX dropping 2.35% to 26.15, traders can look for continuation above yesterday's high of $662.61 for further upside momentum. Favor long positions on pullbacks to the $655-$658 range with stops below $650, but keep position sizes manageable given the still-elevated VIX above 26 indicating underlying market stress. Risk management remains essential as Treasury yields hover near critical levels and volatility stays elevated despite today's improvement. Be sure to review the premarket analysis posted before 9 AM ET for any changes in the model's outlook and Dealer Positioning.
Good luck and good trading!
