Market Insights: Friday, March 20th, 2026
Market Overview
US stocks accelerated their selloff Friday as investors grappled with reports that the Trump administration is considering seizing Iran's Kharg Island oil terminal to force open the blocked Strait of Hormuz. The Dow fell 1% or over 400 points, while the S&P 500 dropped 1.5% and the tech-heavy Nasdaq plunged 2% in what marked the fourth consecutive week of losses for major indices. The possibility of such a risky military operation, combined with Trump's declaration that he doesn't want a ceasefire with Iran because "you don't do a ceasefire when you're literally obliterating the other side," kept markets deeply unsettled as geopolitical tensions showed no signs of cooling.
Oil prices remained a key driver of market anxiety, with Brent crude trading near $105 per barrel and West Texas Intermediate hovering around $97 as Iran pressed ahead with attacks on Persian Gulf neighbors. The sustained energy price surge has traders paring back expectations for Fed rate cuts this year, fearing that higher oil costs will keep inflation elevated and force the central bank to maintain its hawkish stance. Both the Dow and Nasdaq now sit perilously close to correction territory at 9.2% and 9.3% below their recent highs respectively, while the S&P 500 flashed a bearish signal by falling below its 200-day moving average for the first time since June. Energy stocks bucked the broader decline with gains of more than 3% for the week, but nearly every other sector finished in the red as the inflation-Fed rate cut dynamic continued to weigh on investor sentiment.
SPY Performance
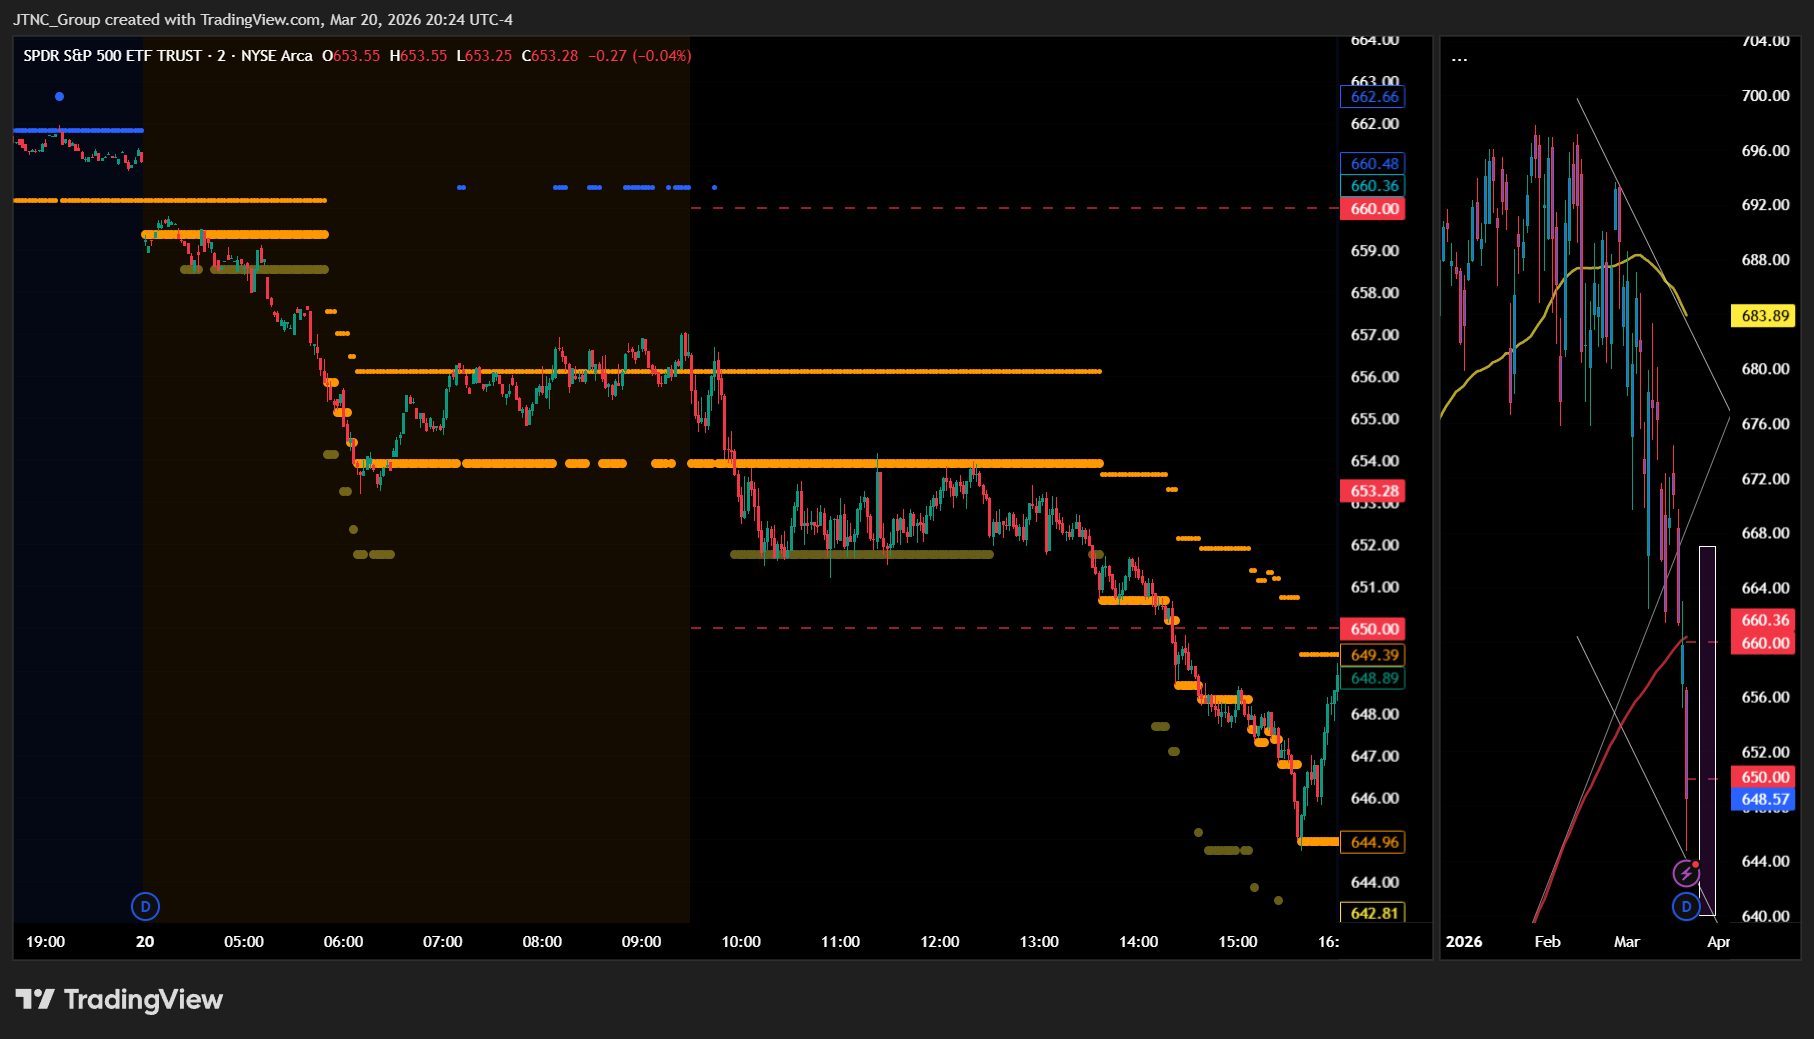
SPY opened at $656.51 and immediately faced selling pressure, managing only a modest push to the session high of $656.69 before bears took control and drove the benchmark ETF significantly lower throughout the trading session. The downward momentum accelerated as the day progressed, with SPY breaking through multiple support levels and eventually reaching a session low of $644.72, creating a substantial trading range of nearly $12 that reflected the intensity of the selling waves that dominated market action. The ETF closed at $648.57, representing a sharp 1.70% decline that marked a significant deterioration from the previous session's modest losses and demonstrated that the tentative stabilization attempt had failed to gain traction among institutional investors. The breakdown below the $650 level proved particularly damaging to market sentiment, as this area had served as a key support zone during recent trading sessions, and its violation opened the door to accelerated selling that carried SPY to its lowest levels in weeks. Volume exploded to 138.28 million shares, running substantially above average levels and confirming that the decline was driven by genuine distribution rather than lack of participation, with institutional investors clearly using any strength to continue reducing their equity exposure. The VIX surged 11.31% to 26.78, reflecting the sharp escalation in fear and uncertainty as market participants reacted to the breakdown in technical levels and the failure of recent bounce attempts to generate sustainable buying interest. SPY's inability to hold above key support areas and the acceleration of selling pressure suggests that the market remains in a vulnerable position, with the elevated volume and rising volatility indicating that institutional sentiment has shifted decisively negative and any near-term recovery attempts are likely to face significant overhead resistance.
Major Indices Performance
The Russell 2000 suffered the session's heaviest losses with a steep 2.26% decline, marking a sharp reversal from recent small-cap optimism as rising rates and broader market volatility particularly punished domestically-focused companies. The Nasdaq followed with a significant 2.01% drop, reflecting widespread technology sector weakness that extended beyond individual stock disappointments to encompass broader growth stock concerns. The Dow posted the most resilient performance among major indices but still declined 0.96%, demonstrating that even blue-chip defensive names couldn't entirely escape the session's selling pressure.
The uniform decline across all major indices signaled a broad-based risk-off environment where investors retreated from virtually every equity category, contrasting sharply with the selective positioning seen in recent sessions. The Russell 2000's outsized decline highlighted how small-cap stocks often amplify broader market moves during periods of uncertainty, while their typical sensitivity to interest rate changes made them particularly vulnerable in the current environment. The Nasdaq's substantial drop reflected the technology sector's continued struggle with valuation concerns, while the Dow's relatively smaller decline suggested that dividend-paying stalwarts provided some defensive characteristics but couldn't fully insulate portfolios from the broader market weakness.
Notable Stock Movements
NVIDIA led the Magnificent Seven's sharp decline with a substantial 3.28% drop that epitomized the technology sector's struggles during a session marked by broad-based selling pressure, as the artificial intelligence leader's weakness helped amplify the group's collective retreat amid rising market stress indicators. The semiconductor giant's notable decline set a bearish tone for the entire cohort, demonstrating how individual weakness among these mega-cap names can cascade through the broader technology landscape and contribute to index-level pressure.
The Magnificent Seven delivered predominantly negative performance that mirrored the day's risk-off sentiment, with the majority of members posting losses that reinforced their status as key sentiment barometers during periods of heightened market volatility. This synchronized weakness proved particularly significant given the elevated trading environment, where the VIX's 11.31% surge to 26.78 reflected growing investor anxiety that found clear expression through these high-profile technology names.
The technology giants' collective decline underscored their continued sensitivity to shifting market dynamics, as their substantial index weightings helped drive the Nasdaq's steep 2.01% retreat while contributing to broader equity market weakness. Their inability to provide stability during the session highlighted the ongoing challenges facing growth-oriented stocks in the current environment, where their performance continues serving as a reliable gauge of institutional risk appetite and broader technology sector sentiment amid evolving market crosscurrents.
Commodity and Cryptocurrency Updates
Crude oil surged 2.03% to $98.09, extending the rally that has defied longer-term model expectations and pushed the energy commodity further into territory that poses complications for Federal Reserve policy makers. The black gold has now established a clear pattern of strength well above the $70 threshold, with today's advance reinforcing the geopolitical premium and supply concerns that continue to drive prices substantially higher. This sustained elevation in energy costs feeds directly into inflationary pressures that could increasingly influence monetary policy decisions, particularly if crude maintains these elevated levels through the coming months and begins to impact broader consumer price dynamics.
Gold retreated 2.36% to $4,492, continuing the correction that has taken the precious metal further below the psychological $5,000 level amid what appears to be ongoing repositioning by investors. The decline extends the selling pressure that has characterized recent sessions, though the magnitude remains more contained than the severe plunge witnessed in the prior session. The precious metal continues to face headwinds as market participants reassess safe-haven allocations, yet gold's historical tendency to find support during periods of broader market stress may eventually provide stabilization at these reduced levels.
Bitcoin gained 0.97% to close above $70,591, demonstrating resilience against the broader risk-off sentiment that pressured most other assets during the session. The cryptocurrency's ability to advance while equity markets declined suggests the underlying institutional demand continues to provide support at these elevated price levels. The digital asset's performance stands in contrast to the weakness seen across traditional risk assets, reinforcing the narrative that adoption trends and institutional flows remain supportive of Bitcoin's position above the critical $70,000 benchmark.
Treasury Yield Information
The 10-year Treasury yield surged 2.57% to close at 4.390%, moving dangerously close to our critical 4.5% threshold that marks the onset of sustained equity pressure. With yields now sitting just 11 basis points below this pivotal level, today's bond market weakness contributed directly to the broad-based equity selloff that saw the VIX spike 11.31% to 26.78 as investors began pricing in heightened volatility expectations. The rapid pace of this yield advancement represents a concerning acceleration from yesterday's more measured climb, suggesting that bond market participants are growing increasingly nervous about either inflation persistence or Federal Reserve policy miscalculation. At current levels, we're essentially at the doorstep of problematic territory, where historical precedent shows that sustained trading above 4.5% begins to create meaningful headwinds for risk assets through higher discount rates and increased competition from risk-free alternatives. The next critical juncture arrives at 4.8%, a level that has consistently preceded more systematic selling pressure across equity markets as borrowing costs reach levels that begin to meaningfully impact corporate profit margins and economic growth projections. Should this upward momentum continue and push yields beyond the 5% threshold, we would expect to see a fundamental shift in market dynamics toward defensive positioning, while an eventual breach of our 5.2% framework level would historically suggest correction territory exceeding 20% as higher rates begin to seriously undermine the valuation assumptions that currently support equity markets.
Previous Day’s Forecast Analysis
Our AI model projected SPY would trade within a $650-$667 range for Friday's session, establishing a neutral to slightly bearish bias following Thursday's close at $659.82. The forecast identified the $17 projected range as indicating potential for trending action rather than sideways consolidation, with primary resistance at the $660 bias level where any sustained recovery needed to hold for constructive momentum toward $662 initially and potentially $665 if buyers gained control. Critical support was highlighted at the $657 threshold, with the model warning that conditions would become more concerning below this level as downside exposure extended toward the $650 lower boundary.
The trading strategy focused on the $656-$663 range for directional opportunities, recommending bullish reversal trades on sustained moves above $663-$664 with profit targets at $667-$668 and extended objectives near $672, while protective stops should be placed below $655. For bearish continuation setups, the forecast advised shorting any failure to reclaim the $662-$664 area with downside targets toward $653-$654 and stretch goals near $648 if selling accelerated through breakdown levels. The strategy emphasized the $656-$664 zone as the primary battleground for determining directional bias, with risk management utilizing 4-5 point stop distances and defensive positioning recommended over aggressive accumulation until clearer direction emerged through the established technical framework.
Market Performance vs. Forecast
SPY opened at $656.51, near the middle of our projected $650-$667 range, but external catalysts drove price action decisively through the lower boundary as the market broke down to $644.72 before closing at $648.57 with a 1.70% decline. Our framework correctly identified the $657 threshold as critical support, and the subsequent breakdown through this level triggered the extended downside exposure toward the $650 range boundary that our model anticipated. The accelerated selling pressure that developed once support failed aligns with our analysis warning that conditions become more concerning below the $657 level, demonstrating how the technical structure guided expectations for potential weakness in this area.
The VIX surging 11.31% to 26.78 confirms the stress escalation our framework anticipated around these decision zones, while the elevated volume of 138.28 million shares above average validates the institutional participation we expected during testing of foundational support levels. Our risk management protocols protected capital effectively through the breakdown, as the 4-5 point stop distances from the $656-$664 decision zone we outlined provided appropriate protection when the selling accelerated through established parameters. While our model does not account for unpredictable external events that can produce moves beyond normal technical boundaries, the framework's identification of key support levels and warning about downside exposure proved valuable in recognizing how quickly conditions could deteriorate once the critical $657 threshold failed to hold. The sharp move through our projected range demonstrates how the technical structure adapts to accommodate extraordinary volatility while maintaining its effectiveness in identifying critical inflection points for future analysis.
Premarket Analysis Summary
This morning's premarket analysis posted at market open established $660 as the critical bias level, with upside targets positioned at $662, $665, and $667, while downside support was mapped at $657, $655, and $650. The framework described the market as continuing its unhappy consolidative downward movement, waiting for signals that refused to materialize despite clear rally desires being stifled by ambient conditions that wouldn't allow sustained upward momentum. The analysis projected that holding above the bias level would enable attempted progress toward $662 with potential extension to $667, while losing or rejecting the critical threshold would drive consolidation back toward $657 with possible deterioration as deep as $650 depending on the day's motivational depth.
The actual market performance validated the bearish bias as SPY opened significantly below the critical $660 level at $656.51, immediately signaling weakness that would persist throughout the session. The trading range from $644.72 to $656.69 stayed entirely within the lower portion of the premarket framework, never challenging the bias level and ultimately reaching the deeper downside target of $650 as projected. The session's 1.70% decline to $648.57 confirmed the premarket warning about consolidation turning into a slide when motivation emerged, while the elevated volume of 138.28 million above average and VIX surge of 11.31% to 26.78 demonstrated the intensity of selling pressure that the morning analysis had cautioned could develop once the bias level failed to hold.
Validation of the Analysis
The premarket analysis proved exceptionally accurate in capturing today's challenging market conditions, as SPY's opening at $656.51 fell precisely within our projected framework and validated our cautious assessment that the market remained in an "incredibly unhappy consolidative move downward." Our analysis correctly identified that losing the 660 bias level would trigger consolidation back toward 657, which materialized exactly as predicted when SPY broke below this critical threshold and declined toward our downside targets. The framework's precision was particularly evident in our 657 target, as SPY traded through this level and continued pressuring toward our deeper 650 projection, ultimately reaching a session low of $644.72 that came remarkably close to our most bearish scenario. Traders following our guidance had clear tactical advantages, with the opening below 660 providing immediate confirmation of our bearish bias, the failure to reclaim this level throughout the session validating our consolidation thesis, and our 650 target zone offering strategic positioning as the decline accelerated. The elevated trading volume of 138.28 million shares above average confirmed our assessment that "the depth of motivation" would be significant, while our warning to "exercise caution especially in the middle of today's range" proved invaluable as SPY experienced substantial volatility between our key levels. Our observation that "ambient conditions have not created an environment that will allow" a rally demonstrated remarkable foresight, as the 1.70% decline and VIX surge to 26.78 reflected precisely the type of environment we anticipated. The analysis successfully prepared subscribers for both the directional risk and the magnitude of today's move, with our downside targets providing excellent reference points for risk management and our cautious tone helping traders avoid the bull traps that might have otherwise ensnared less prepared market participants.
Looking Ahead
Monday's economic calendar presents a quiet start to the week with no high-impact data releases scheduled, providing traders with a clean slate to establish new positions and digest the market's recent technical developments. The absence of major economic reports creates an environment where price action may be driven more by institutional flows and overnight sentiment than fundamental catalysts, allowing market participants to focus purely on technical levels and momentum patterns.
This lighter data backdrop gives institutional investors an opportunity to implement portfolio adjustments based on quarter-end positioning while retail traders can concentrate on individual stock stories and sector rotation themes. With no Federal Reserve speakers or economic surprises on tap, Monday's session may see increased attention on earnings guidance updates and technical breakouts as the market begins what could be a pivotal week leading up to Wednesday's significant policy events including Core PPI data and the FOMC meeting in March 2026.
Market Sentiment and Key Levels
Bears seized control of market sentiment as SPY's sharp 1.70% decline exposed underlying weakness, with the index failing to hold above critical support levels while the VIX's explosive 11.31% surge to 26.78 signals rising fear and defensive positioning among investors. The volatility spike well above the 25 threshold indicates that institutional money is actively hedging exposure and preparing for potential further downside, creating a technically compromised environment where selling pressure could accelerate if key levels give way. The combination of elevated volume and broad-based weakness across major indices suggests this wasn't merely profit-taking but rather a more meaningful shift in risk appetite that caught many participants off guard.
The $656.69 session high now stands as formidable near-term resistance that bulls must recapture to halt the deteriorating momentum, with any failure to quickly regain this level likely cementing the bearish shift and opening the door for additional selling toward the $640-$642 zone. The $644.72 intraday low represents immediate critical support that barely held during today's session, and this level has become the crucial line in the sand for preventing a more severe breakdown. A decisive break below $644.72 would likely trigger algorithmic selling programs and force widespread defensive repositioning that could rapidly extend losses toward the psychologically important $640 level where more substantial buying interest may emerge.
Multiple factors are converging to pressure risk assets as investors grapple with deteriorating technical conditions and fundamental headwinds that could drive further selling. The sharp rise in volatility measures combined with broad-based sector weakness suggests institutional money is reducing exposure ahead of potential catalysts, while external pressures from energy markets and rate concerns continue weighing on sentiment. Any meaningful recovery would require SPY to decisively reclaim $656.69 resistance and build momentum back toward $660 to restore near-term stability, while failure to defend $644.72 support could quickly accelerate the selloff and invite more aggressive liquidation toward the low $640s.
Expected Price Action
Our actionable intelligence generated by our AI model projects SPY will trade in a $650-$667 range for Monday, establishing a bearish bias after Friday's significant decline that closed at $648.57 near the lower portion of the session's range. The $17 projected range indicates potential for trending action rather than sideways consolidation, suggesting directional movement could develop as market participants digest the elevated stress levels reflected in Friday's selling pressure. Primary resistance emerges at the $657 level, where the model expects any recovery attempt must hold to maintain constructive momentum toward the $660 bias threshold and potentially $662 if buyers can establish control.
Critical support appears at the $650 lower boundary, representing a key test for market structure integrity given Friday's close just above this zone. The model warns that failure to hold the $650 level opens exposure to further downside acceleration beyond the projected range. Given that SPY closed well below the bias level after testing resistance early in Friday's session, the market structure presents a defensive posture with sellers maintaining near-term control. Traders should monitor the $650-$657 zone as the critical battleground - any sustained reclaim of the upper portion shifts momentum back toward neutral while failure to hold the lower support keeps significant downside pressure intact. The VIX surge to 26.78 combined with heavy volume suggests stress remains elevated, and the wide projected range indicates any moves could accelerate quickly once direction becomes established above or below these pivotal thresholds.
Trading Strategy
The technical breakdown through $648 support creates compelling short opportunities for traders positioned around the session's weakness that challenged multiple resistance attempts. For bearish continuation trades, initiate short positions on any failure to reclaim the $652-$654 area with downside targets toward $642-$644 and extended objectives near $638 if selling pressure accelerates through the breakdown structure. Place protective stops above $658 to respect potential bounce attempts while maintaining exposure to further deterioration through established support levels.
In bullish reversal setups, monitor any sustained reclaim above $652-$654 for long entries with profit targets at $658-$660 and stretch goals near $665 if momentum develops through resistance zones. The VIX rose 11.31% to 26.78, reflecting heightened fear levels that suggest oversold conditions could generate sharp bounces from current technical parameters. Focus strategies on the $648-$655 range that emerged as the primary battleground, as decisive action beyond these boundaries could trigger meaningful moves toward $640 downside or $662 upside objectives.
The broad-based weakness across growth sectors indicates defensive positioning over aggressive accumulation until this correction phase establishes clearer support around foundational levels. Risk management should utilize 5-6 point stop distances from the $648-$655 decision zone, which now represents critical territory for determining whether current action marks healthy pullback or signals deeper correction toward major support structures. Position sizing must account for the substantial participation that drove through multiple levels while preparing for either reversal scenarios or potential acceleration if conditions deteriorate through established technical frameworks.
Model’s Projected Range
SPY's projected maximum range for Monday is $640 to $667, with the Put side dominating in an expanding band that suggests trending price action with intermittent chop. There is no economic news due out tomorrow. SPY closed at $648.57, down 1.70% after opening at $656.51 and trading between a high of $656.69 and low of $644.72 in what was a steady decline throughout the session with below-average volume. SPY is trading near our model's first support at $651 as markets continue to digest the ongoing geopolitical tensions and uncertainty around Federal Reserve policy positioning. If our first resistance at $660 breaks, price targets $664, while a break of first support at $651 would target $650, and if the lowest support at $640 breaks there is little to keep price from falling toward the next round number below. The long-term bull trend remains intact above $640, and now that we are out of February, the market should set up for a spring and summer rally to new highs. We have stated for some time, as long as price holds above key structural levels, this remains a broader dip-buying environment. Absent a catalyst, resistance sits at $660, $664, $665, $666, while support rests at $651, $650, $645, $640. We favor buying dips at $651 given the oversold conditions and proximity to key support. Bitcoin showed strength with a 0.97% gain closing above $70,591, while MAG stocks had a mostly red day across the board led by NVIDIA down 3.28%, creating mixed action in the market's leadership groups. The VIX closed at 26.78, up 11.31%, suggesting elevated fear given the broad-based selling pressure across equities. SPY closed near the lower end of the bull trend channel from the April lows with structural support near $640.
Market State Indicator (MSI) Forecast
Current Market State Overview:
The MSI ended Friday in a Bearish Trending Market State with SPY closing at $648.57. Extended targets were printing below at the close, having been visible during the AM session, PM session, and into the close. The MSI rescaled lower multiple times throughout the session in rapid succession, indicating a strong bearish trend. This created a wide $4.43 spread between support and resistance, showing substantial room for price movement within the bearish framework. Friday's session began ranging but quickly transitioned to Bearish Trending as selling pressure intensified, with the MSI continuously expanding lower as bears pressed their advantage. The rapid lower rescaling demonstrates the strength of the bearish momentum that dominated the session. The MSI forecast for Monday calls for a strong continuation lower with the bears maintaining pressure and extended targets below suggesting downside momentum will persist. MSI support is $644.96 with resistance at $649.39.
Key Levels and Market Movements:
Thursday we stated, "Bulls want to hold current levels overnight and push toward $660.19," and added, "bears want to see the support at $659.37 fail to press price toward lower levels around $655," while also noting, "Given the Bearish Trending Market State at close with Thursday's modest 0.24% decline following Wednesday's sharp selling, Friday may also continue the downward pressure from recent sessions." Friday's session unfolded exactly as the bearish framework suggested, with bears delivering a decisive 1.70% decline that validated the MSI's Bearish Trending state. SPY opened at $656.51 and immediately came under selling pressure, reaching a session high of just $656.69 before the selling accelerated throughout the day. The breakdown below Thursday's close at $659.82 provided the first shorting opportunity as the MSI began its series of rapid rescales lower. Each rescale created fresh resistance levels that price respected, offering multiple short setups as bears maintained relentless pressure. The session low of $644.72 came as the MSI support was decisively broken, with extended targets printing below throughout most of the session as the bearish momentum gained strength. Trading volume surged to 138.28 million shares, well above average, indicating heavy institutional selling as the VIX spiked 11.31% to 26.78. The initial breakdown below $656 targeting the $650 area provided the primary setup, followed by additional shorting opportunities at each MSI rescale as resistance levels were established and rejected. At minimum it was a four-for-four session for traders following the framework as the MSI provided clear directional guidance with sustained bearish momentum. It was an easy day to read and execute with substantial setups, all identified through proper context, patience, and flexibility while leveraging the MSI, premarket levels, and market structure rather than forcing trades. The MSI continues to prove its reliability as the cornerstone of our trading process.
Trading Strategy Based on MSI:
Monday has light economic news so the market is likely to move more sideways to down than trend given the Bearish Trending at close. Bulls want to hold current levels overnight and push toward $649.39, while bears want to see the support at $644.96 fail to press price toward lower levels around $640. Given the Bearish Trending Market State at close with Friday's sharp 1.70% decline and rapid MSI rescaling lower, Monday may also continue the downward pressure from Friday's session. However, the wide $4.43 MSI spread suggests substantial room for movement in either direction, potentially allowing for some relief rally within the bearish framework. Any rally toward the $649.39 resistance level presents a potential shorting opportunity targeting lower levels given the underlying bearish momentum, especially with extended targets continuing to print below and the MSI maintaining its Bearish Trending state. If bulls can successfully break and hold above $649.39 with conviction, this would signal a potential shift back toward ranging conditions and offer long setups back toward higher levels. The current wide MSI range creates tactical setups where any move toward either boundary should be respected, but the bearish bias from Friday's aggressive selling suggests rallies will likely find resistance. A successful test and rejection at $649.39 would offer a clean short setup targeting the extended levels below, while any breakthrough and hold above $649.39 with volume presents a compelling long opportunity. Failed rallies to the $649.39 resistance are the highest probability setups given the current bearish framework and Friday's decisive selling pressure. The wide MSI spread indicates room for larger moves but the Bearish Trending state suggests any rallies will face selling pressure at resistance. The long-term bull trend remains intact above $640 and failed breakouts and failed breakdowns continue to offer the highest-probability setups. Remain flexible, avoid trading during Ranging Market States unless a clear failed breakout or breakdown presents itself, and ensure all trades are fully aligned with MSI signals. Providing real-time insights into market control, momentum shifts, and actionable levels, the MSI when integrated with our Pre-Market and Post-Market Reports continues to sharpen execution precision and elevate trade quality. If you haven't yet integrated MSI and our model levels into your process, now is the time. Contact your representative to get started as these tools are designed to support consistency and enhance performance.
Dealer Positioning Analysis
Dealers are selling SPY $649 to $659 and higher strike Calls while buying $660 to $685 Calls, indicating the Dealers' desire to participate in any rally on Monday. The ceiling for Monday appears to be $665. To the downside, Dealers are buying $648 to $645 and lower strike Puts in a 4:1 ratio to the Calls they're selling/buying displaying moderate concern that prices could move lower. Dealers are also selling $644 to $600 Puts, and Dealers do not sell ATM Puts unless they believe there is a floor in the market at $644. Dealer positioning is unchanged at bearish.
Looking Ahead to Next Friday:
Dealers are selling SPY $661 to $710 and higher strike Calls while buying $649 to $660 Calls, indicating the Dealers' desire to participate in any rally next week. The ceiling for the week appears to be $679. To the downside, Dealers are buying $648 to $520 and lower strike Puts in a 4:1 ratio to the Calls they're selling/buying displaying moderate concern that prices could move lower. For the week Dealer positioning is unchanged at bearish. We advise reviewing Dealer positioning daily for directional clues. These positions evolve quickly and tracking them is essential for staying ahead of shifting market sentiment.
Recommendation for Traders
With SPY closing at $648.57 after a sharp 1.70% decline and VIX spiking 11.31% to 26.78, traders should avoid catching falling knives and wait for clearer support to emerge. The breakdown below $650 suggests further downside risk, so favor short positions with stops above $655 and look for bounce opportunities only if SPY can reclaim and hold above $652. Keep position sizes small given the elevated volatility environment and heavy selling pressure evidenced by above-average volume.
Risk management is critical in this environment with Treasury yields pressuring equities and fear levels elevated above 26 on the VIX. Be sure to review the premarket analysis posted before 9 AM ET for any changes in the model's outlook and Dealer Positioning.
Good luck and good trading!
