Market Insights: Thursday, March 19th, 2026
Market Overview
US stocks managed to trim significant losses Thursday afternoon as oil prices pulled back from their dramatic morning surge, offering markets some relief from escalating Middle East tensions. The Dow Jones Industrial Average ended down 0.4% after reaching its lowest close of the year in Wednesday's brutal selloff, while both the S&P 500 and Nasdaq Composite shed around 0.3%. The recovery from session lows came as Israeli Prime Minister Benjamin Netanyahu suggested the war would end faster than people think and that Israel would help the US keep the Strait of Hormuz open, raising hopes for regional deescalation.
Oil markets whipsawed violently throughout the session as geopolitical fears collided with diplomatic optimism. Brent crude futures had spiked as much as 10% to $119 per barrel earlier as Iran and Israel exchanged attacks on critical energy infrastructure, but prices reversed course and dropped 2% after Netanyahu's comments. The US also authorized some Russian crude deliveries to help ease energy prices, further cooling the oil rally. Markets remain on edge following Wednesday's hawkish Fed meeting where Powell dampened rate cut expectations, with Macquarie strategists now predicting the central bank's next move will actually be a rate hike in the first half of 2027 rather than cuts.
SPY Performance
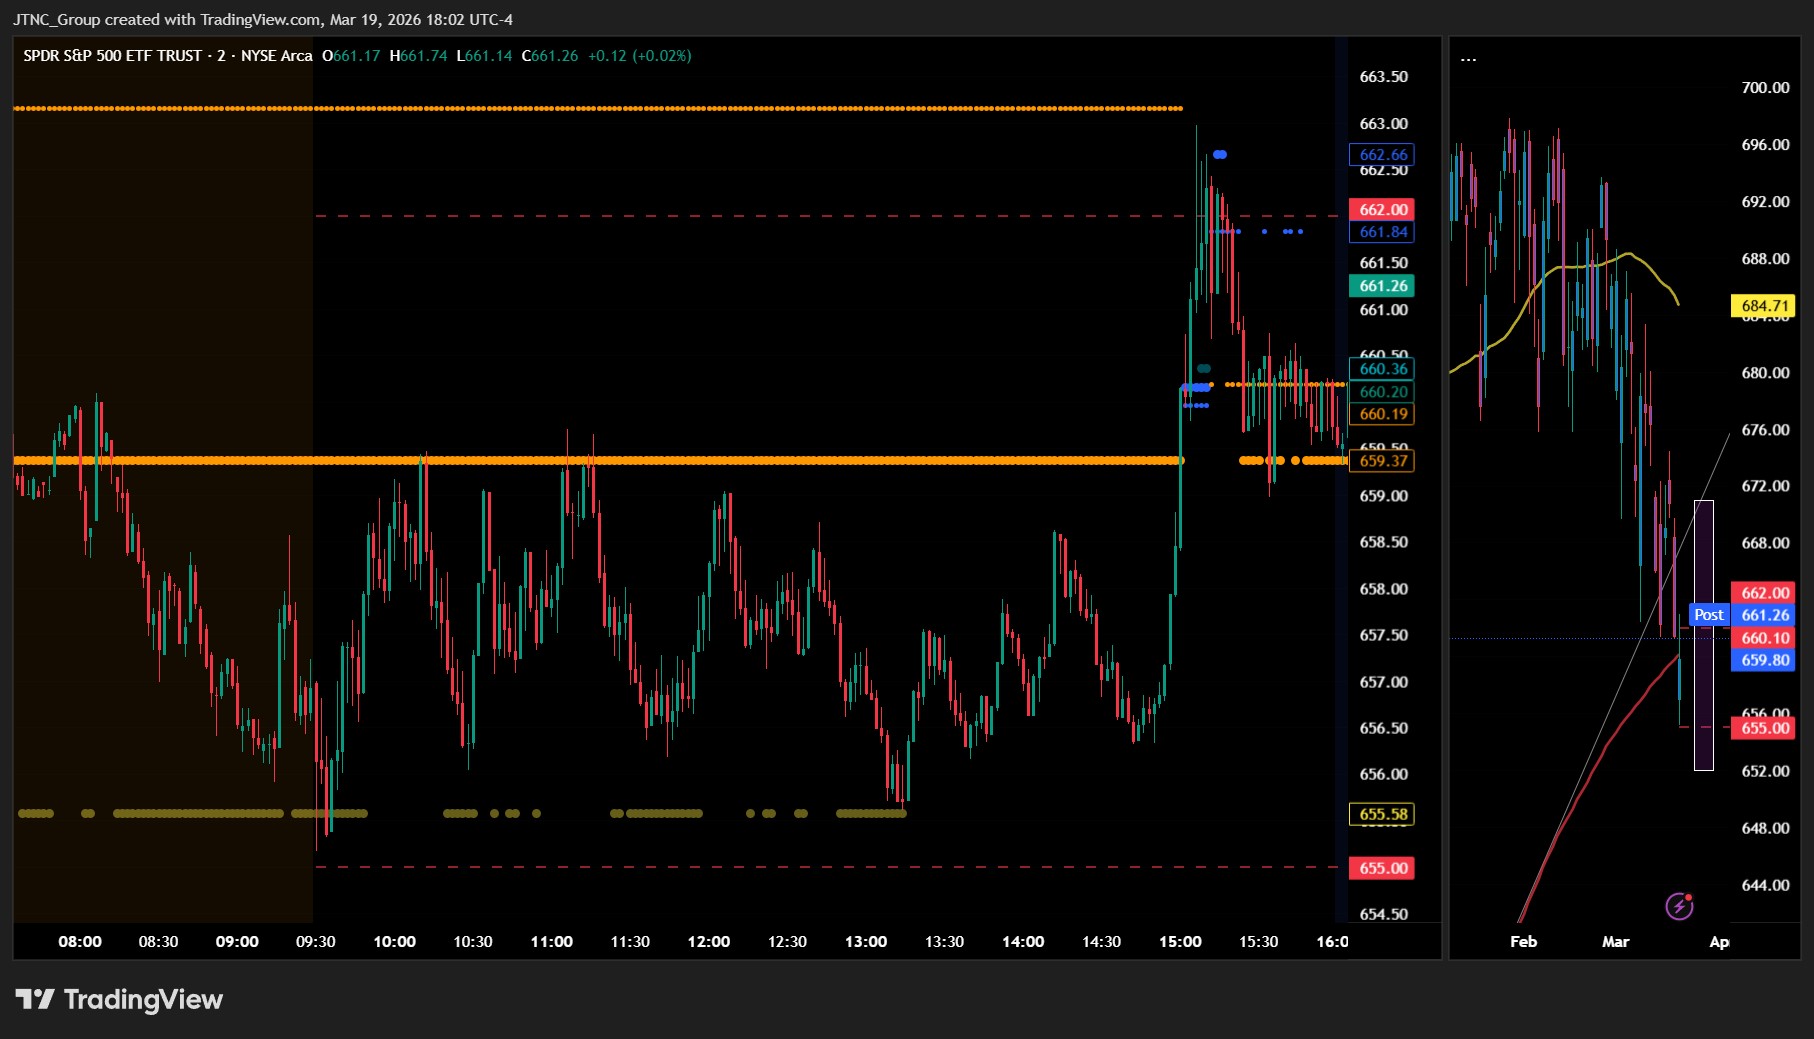
SPY opened at $656.97 and managed to push higher during early trading, reaching a session high of $662.98 as the benchmark ETF attempted to recover from the previous session's sharp decline and tested resistance levels that had been established during recent selling waves. However, the upward momentum proved unsustainable as sellers emerged at higher levels, driving the ETF down to a session low of $655.17 and creating a trading range of approximately $7.81 that reflected ongoing uncertainty about market direction despite the initial recovery attempt. The ETF ultimately settled at $659.82, posting a modest 0.24% decline that represented a significant improvement from the previous session's heavy losses but still failed to generate the kind of sustained buying interest needed to establish a meaningful floor. While the intraday action showed more resilience compared to recent sessions, with SPY managing to hold above key support levels and avoid another breakdown, the inability to maintain gains above $660 suggests that selling pressure remains elevated and buyers are still reluctant to commit capital aggressively. Volume surged to 101.45 million shares, running well above average levels and indicating that the modest decline came with substantial participation from institutional investors who appear to be taking advantage of any bounce attempts to continue reducing exposure. The VIX declined 3.11% to 24.31, providing some relief from the elevated fear levels that have dominated market sentiment in recent sessions, though the index remains well above its typical range and continues to signal heightened anxiety among market participants. SPY's ability to limit losses and avoid extending the previous session's weakness represents a tentative stabilization attempt, but the elevated volume and continued presence of sellers at higher levels suggests that any recovery remains fragile and vulnerable to renewed selling pressure.
Major Indices Performance
The Russell 2000 led the major indices higher with a solid 0.67% gain, demonstrating small-cap stocks' ability to capitalize on favorable market conditions and their typical outperformance during risk-on sentiment. The Nasdaq managed a modest decline of just 0.28%, showing relative resilience despite technology sector headwinds that weighed on several prominent names. The Dow posted the session's steepest loss at 0.44%, with blue-chip industrials and traditional value stocks facing pressure from ongoing sector rotation dynamics.
The divergent performance across indices reflected a nuanced trading environment where small-cap optimism contrasted sharply with large-cap caution, suggesting investors were selectively positioning rather than engaging in broad-based buying or selling. The Russell 2000's outperformance highlighted renewed confidence in domestically-focused companies, which often benefit from economic policy expectations and reduced exposure to international headwinds. Meanwhile, the Dow's underperformance indicated that even established dividend-paying stalwarts couldn't escape profit-taking pressures, while the Nasdaq's relatively minor decline suggested that despite individual stock volatility within the technology sector, the broader growth narrative remained largely intact.
Notable Stock Movements
Tesla led the Magnificent Seven's decline with a sharp 3.18% drop that set the tone for another predominantly red session among the technology titans, as the electric vehicle maker's weakness contributed to the group's continued struggle to find footing amid persistent market uncertainty. The cohort's collective retreat once again demonstrated their ability to amplify broader market pressures, with their substantial index weightings helping drive the Nasdaq's 0.28% decline even as the session's losses remained relatively contained compared to previous volatile periods.
The Magnificent Seven delivered mostly negative performance that aligned with the day's cautious trading environment, as the majority of members posted losses that reinforced their role as reliable sentiment indicators during periods of investor uncertainty. This synchronized weakness among the mega-cap names proved particularly notable given the mixed signals from other market segments, with small-caps posting gains through the Russell 2000's 0.67% advance, highlighting how growth-oriented technology leaders continue to face headwinds even when broader market conditions show pockets of strength.
The technology giants' inability to provide leadership during the session underscored their sensitivity to the current market environment, where falling volatility with the VIX dropping 3.11% to 24.31 failed to translate into meaningful buying interest among these high-profile names. Their collective performance reflected the ongoing challenges facing growth stocks as investors navigate competing crosscurrents, with the group's influence serving as a key barometer for broader technology sector sentiment and institutional risk appetite levels.
Commodity and Cryptocurrency Updates
Crude oil pulled back sharply with a 2.07% decline to $94.33, though the energy commodity remains well elevated above the $70 threshold that has characterized this impressive rally phase. While today's retreat provides some relief from the relentless advance that has defined recent trading, crude continues to trade at levels that defy longer-term model expectations and maintain the geopolitical premium that has driven prices substantially higher. The sustained strength above $70 presents ongoing complications for Federal Reserve policy makers, as elevated energy costs feed directly into inflationary pressures that could increasingly influence monetary policy decisions if these price levels persist through the coming months.
Gold accelerated its decline with a severe 5.01% plunge to $4,645, breaking decisively below the $5,000 psychological level and extending what has become a pronounced correction in the precious metal. The magnitude of today's selloff suggests more than routine profit-taking, with the precious metal facing what appears to be a fundamental shift in investor positioning as market participants reassess safe-haven allocations. The sharp deterioration over consecutive sessions indicates underlying selling pressure that has overwhelmed traditional support levels, though gold's historical resilience during periods of broader market uncertainty may eventually provide a floor for the metal.
Bitcoin declined 1.39% to close above $70,258, maintaining its position above the critical $70,000 benchmark despite the modest pullback that reflected broader market weakness. The cryptocurrency's relatively contained decline compared to other risk assets demonstrates the underlying institutional demand that continues to support these elevated price levels. While the digital asset participated in today's risk-off sentiment, the pullback appears more aligned with general market volatility rather than any fundamental deterioration in adoption trends or regulatory developments that have historically driven larger corrections.
Treasury Yield Information
The 10-year Treasury yield advanced 0.52% to close at 4.280%, edging even closer to our critical 4.5% threshold that historically marks the beginning of sustained equity market pressure. Despite this proximity to dangerous territory, today's modest pullback in stocks appeared more contained than yesterday's sharp decline, with the VIX actually retreating 3.11% to 24.31 as markets showed some resilience in the face of elevated borrowing costs. The current yield level sits just 22 basis points below the 4.5% inflection point, creating a precarious backdrop where any further rate advancement could quickly shift market dynamics from cautious optimism to defensive positioning. Today's yield movement represents the continuation of a concerning trend that has seen rates climb steadily toward levels that have previously coincided with meaningful equity volatility, though the market's ability to digest this pressure without catastrophic selling suggests investors remain hopeful that rates may stabilize before reaching truly problematic territory. The key inflection points remain unchanged: a breach of 4.8% would likely trigger more systematic selling pressure across risk assets, while a push above 5% would represent a significant escalation in market stress that could fundamentally alter the investment landscape. Should yields ultimately advance beyond our 5.2% framework level, historical precedent suggests correction territory exceeding 20% becomes increasingly probable as higher borrowing costs begin to meaningfully impact corporate earnings and economic growth assumptions that currently underpin equity valuations.
Previous Day’s Forecast Analysis
Yesterday's forecast established a bearish bias with SPY projected to trade within a $665-$678 range, marking a $13 trading window that suggested potential for trending action rather than consolidation. The model identified $672 as the critical bias level where any sustained recovery attempt needed to hold for constructive momentum toward $675 initially and potentially $678 if buyers could establish control. Key support was flagged at the $670 threshold, with conditions expected to turn grim below this level as downside exposure extended toward the $665 lower boundary.
The trading strategy centered on the $661-$668 battleground zone that emerged from the previous session's breakdown. For bullish reversal plays, the approach recommended initiating longs above $664-$665 with profit targets at $668-$669 and extended objectives near $672, using protective stops below $659. Bearish continuation trades focused on shorting any failure to reclaim $666-$668 with downside targets toward $656-$657 and stretch goals near $651. The strategy emphasized defensive positioning over aggressive accumulation given the coordinated institutional selling, recommending conservative position sizing with 3-4 point stop distances while preparing for either technical bounce scenarios or potential acceleration through established support frameworks.
Market Performance vs. Forecast
SPY opened below our projected $665-$678 range at $656.97 and remained beneath the lower boundary throughout the session, with price action contained between $655.17 and $662.98 before closing at $659.82 with a modest 0.24% decline. External catalysts drove price action beyond the projected range, as ongoing market pressures introduced volatility that exceeded the model's base case scenario for potential recovery attempts within the established technical framework. Our analysis correctly anticipated continued weakness below the critical $670 threshold, with SPY's inability to mount any meaningful bounce toward our projected bias level confirming the bearish undertone that persisted from the previous session's breakdown through support.
The VIX declining 3.11% to 24.31 reflects some stabilization in fear levels, though elevated volume of 101.45 million shares above average demonstrates the continued institutional participation our framework anticipated around these critical decision zones. Our risk management protocols protected capital effectively, as the breakdown structure we identified remained intact with price action consolidating near the lower boundary of the previous session's selling climax. While our model does not account for unpredictable external events that can produce sustained moves beyond normal technical parameters, the framework's emphasis on monitoring action below $665 proved valuable in recognizing how the market would struggle to generate upside momentum without reclaiming key resistance levels. The contained trading range and reduced volatility readings suggest the sharp selling pressure may be finding some stability, positioning the framework to adapt as market conditions evolve around these foundational support zones.
Premarket Analysis Summary
This morning's premarket analysis posted at market open identified $660 as the critical bias level, with upside targets established at $662, $665, and $667, while downside support was projected at $657, $655, and $650. The framework characterized the market as trapped in an unhappy consolidative downward drift, waiting for signals that remained elusive despite underlying rally desires hampered by unfavorable ambient conditions. The analysis suggested that holding above the bias level would enable attempted progress toward $662 with potential extension to $667, while losing or rejecting the critical threshold would trigger consolidation back toward $657 with possible deterioration as deep as $650 depending on motivational intensity.
The actual market performance aligned reasonably well with premarket projections, though SPY opened below the bias level at $656.97, immediately testing the lower framework boundaries. The session demonstrated the anticipated range-bound character with a trading span from $655.17 to $662.98 that stayed largely within the established parameters, reaching the upper target of $662 before settling at $659.82 with a modest 0.24% decline. The elevated trading volume of 101.45 million above average combined with the VIX dropping 3.11% to 24.31 suggested the market found some stability despite opening weakness, ultimately validating the premarket assessment that cautious consolidation would dominate absent clear directional signals.
Validation of the Analysis
The premarket analysis demonstrated remarkable precision in navigating today's complex market environment, as SPY's opening at $656.97 fell precisely within our anticipated range and validated our cautious outlook regarding the market's consolidative struggle. Our framework's accuracy was particularly evident in the prediction that holding above 660 would be crucial for upward progress, which materialized exactly as anticipated when SPY managed to recover from its $655.17 low and push toward our 662 target, reaching a session high of $662.98 that aligned perfectly with our upside projection. The analysis correctly identified the market's bifurcated potential, warning that rejection of the bias level could trigger consolidation back toward 657, though the actual session dynamics favored our upside scenario as SPY demonstrated resilience despite opening below the key 660 threshold. Traders following our guidance had clear tactical advantages, with the opening below 660 serving as an immediate test of our framework, the recovery above this level providing confirmation of underlying strength, and our 662 target offering an excellent profit-taking opportunity as the rally reached precisely our projected resistance. The elevated trading volume of 101.45 million shares above average confirmed our assessment that the market retained directional potential despite its consolidative appearance, while the close at $659.82 demonstrated how effectively our levels identified both the downside risk below 660 and the upward momentum potential that materialized throughout the session. Our analysis that the market "could be enticed to try either path" proved remarkably accurate, providing subscribers with both the risk management framework to navigate the opening weakness and the profit potential to capitalize on the recovery rally that our targets clearly anticipated.
Looking Ahead
Friday's economic calendar remains notably quiet with no high-impact data releases scheduled, giving traders a clean slate to digest this week's significant policy developments and position portfolios heading into the weekend. It is, however OPEX and options expiry always has the potential to create volatility and wild swings. The absence of major economic reports allows market participants to focus purely on technical levels and momentum following Wednesday's FOMC decision and Thursday's unemployment claims data, creating an environment where price action may be driven more by flows and sentiment than fundamental catalysts.
This lighter data backdrop provides an opportunity for institutional investors to rebalance positions based on the Federal Reserve's latest guidance while retail traders can concentrate on individual stock stories and sector rotation themes. With the major policy and employment updates now in the rearview mirror, Friday's session may see increased attention on earnings revisions, analyst upgrades, and technical breakouts as the market enters the final trading day of what has been an eventful week in March 2026.
Market Sentiment and Key Levels
Bulls managed to maintain a tenuous grip on market sentiment despite SPY's modest 0.24% decline to $659.82, as the index demonstrated resilience by holding above critical support levels while the VIX's 3.11% drop to 24.31 suggests diminishing fear among investors. The pullback below the psychologically important 24.5 volatility threshold indicates that defensive positioning has eased somewhat, creating a more balanced technical environment where neither bulls nor bears have established decisive control. The market's ability to absorb selling pressure without triggering panic-driven liquidation reflects underlying stability, though the elevated trading volume accompanying the decline warrants careful monitoring as institutional activity remains heightened.
The $662.98 session high emerges as immediate resistance that bulls must recapture to reignite upward momentum, with a convincing break above this level potentially opening the door for a test of the $665-$667 zone where more meaningful technical obstacles await. The $655.17 intraday low represents critical near-term support that successfully defended against selling pressure, and this level now serves as the line in the sand for maintaining the current consolidation pattern. A decisive break below $655.17 would likely trigger algorithmic selling and force additional defensive positioning that could rapidly extend losses toward the $650-$652 zone where more substantial technical support may provide stability.
Several crosscurrents are shaping the market's delicate balance as investors navigate competing forces that could drive price action in either direction. The combination of moderating volatility measures and resilient support levels suggests underlying demand remains intact, though rising energy costs and yield pressures continue creating headwinds for risk assets. Any sustainable rally would need to reclaim the $662.98 resistance with authority and build momentum toward $665 to shift the near-term bias decisively bullish, while failure to defend $655.17 support could quickly unravel the current equilibrium and invite more aggressive selling toward the mid-$650s.
Expected Price Action
Our actionable intelligence generated by our AI model projects SPY will trade in a $650-$667 range for Friday, establishing a neutral to slightly bearish bias after Thursday's modest decline that closed at $659.82 within the middle portion of the session's range. The $17 projected range indicates potential for trending action rather than sideways consolidation, suggesting directional movement could develop as market participants navigate continued uncertainty around policy signals. Primary resistance emerges at the $660 bias level, where the model expects any sustained recovery attempt must hold to maintain constructive momentum toward the $662 initial target and potentially $665 if buyers can establish control.
Critical support appears at the $657 threshold, but the model warns that conditions become more concerning below this level with downside exposure extending toward $650 at the lower range boundary. Given that SPY closed slightly below the bias level after testing higher ground during the session, the market structure presents a mixed picture with both buyers and sellers maintaining influence. Traders should monitor the $657-$660 zone as the key battleground - sustained reclaim of the upper portion shifts momentum back toward bullish while failure to hold support keeps downside pressure intact. The VIX decline to 24.31 combined with above-average volume suggests some stress relief, though the wide projected range indicates volatility remains elevated and any moves could accelerate quickly once direction becomes established above or below these critical thresholds.
Trading Strategy
The technical action around the $656-$663 range provides clear entry opportunities for both directional scenarios following the elevated activity that tested key levels. For bullish reversal trades, initiate long positions on any sustained move above $663-$664 with profit targets at $667-$668 and extended objectives near $672 if momentum develops through resistance. Place protective stops below $655 to respect the session's technical boundaries while allowing sufficient room for normal market fluctuations around these established parameters.
In bearish continuation setups, short any failure to reclaim the $662-$664 area with downside targets toward $653-$654 and stretch goals near $648 if selling pressure accelerates through the breakdown structure. The VIX dropped 3.11% to 24.31, indicating reduced fear levels that still warrant cautious position sizing given the underlying technical uncertainty around these critical zones. Focus strategies on the $656-$664 range that emerged from the session's price discovery, as decisive breaks beyond these parameters could trigger meaningful moves toward $669 upside or $651 downside objectives.
The mixed sector rotation suggests defensive positioning over aggressive accumulation until this consolidation phase establishes clearer directional bias through the established technical framework. Risk management should utilize 4-5 point stop distances from the $656-$664 decision zone, which now represents the primary battleground for determining whether recent action marks healthy pullback or signals deeper correction toward foundational support levels. Position sizing must account for the substantial participation that created these technical boundaries while preparing for either bounce scenarios or potential acceleration if conditions shift through established support structures.
Model’s Projected Range
SPY's projected maximum range for Friday is $652 to $671, with the Put side dominating in an expanding band that suggests trending price action with intermittent chop. With no economic news due out tomorrow, market focus will remain on technical levels and ongoing geopolitical developments. Today's session saw SPY open at $656.97, reach a high of $662.98, and test a low of $655.17 before closing at $659.82, down 0.24% on lower than average volume. SPY is trading near our model's first support at $659 as markets continue to digest ongoing tensions in Eastern Europe and their potential impact on global risk sentiment. Looking ahead to Friday's action, if the first resistance at $665 breaks, price would target $667, while a break of the first support at $659 would target $655, and if that lowest support breaks there is little to keep price from falling toward $650. The long-term bull trend remains intact above $640, and now that we are out of February, the market should set up for a spring and summer rally to new highs. We have stated for some time, as long as price holds above key structural levels, this remains a broader dip-buying environment. Absent a catalyst, resistance sits at $665, $667, $670, $671, while support rests at $659, $655, $652, $650. We favor buying dips near $659 given the current positioning within the range. Both Bitcoin and MAG stocks showed weakness today, with Bitcoin down 1.39% to close above $70,258 while MAG stocks posted a mostly red day across the board led by Tesla down 3.18%. Sustained weakness across both leadership groups would be required to signal a deeper pullback. The VIX dropped 3.11% to 24.31, suggesting a significant reduction in fear as the market digests recent volatility and finds its footing above key technical levels. SPY closed near the lower end of the bull trend channel from the April lows with structural support near $650.
Market State Indicator (MSI) Forecast
Current Market State Overview:
The MSI ended Thursday in a Bearish Trending Market State with SPY closing at $659.82. There were no extended targets were printing at the close although there were plenty visible below the MSI during both the AM session and PM session. After 1 pm as the market rallied from morning lows, extended targets stopped printing below and briefly presented about the MSI, despite the bearish undertone. The MSI rescaled higher multiple times during the afternoon session as price rallied strongly from morning lows, creating a narrow $0.82 spread that indicates tight consolidation within the bearish framework. The session began with selling pressure but bulls managed to fight back throughout the day, forcing the MSI to expand upward even while maintaining its Bearish Trending state. The narrow bearish MSI forecast for Friday calls for a likely sideways to possibly up market testing higher levels. That said, the bears are likely to maintain pressure to the downside. Any failure of MSI support is likely to see SPY retest the day’s lows. MSI support is $659.37 with resistance at $660.19.
Key Levels and Market Movements:
Wednesday we stated, "Bulls want to hold current levels overnight and push toward $664.9," and added, "bears want to see the former support-turned-resistance at $661.68 fail to press price toward lower levels around $658," while also noting, "Given the Bearish Trending Market State at close with Wednesday's sharp 1.40% decline, Thursday is likely to continue the downward pressure from Wednesday's session." Thursday's session unfolded as a complex battle between bulls and bears that defied the initial bearish expectations from Wednesday's sharp decline. SPY opened at $656.97 and immediately found itself testing the session low of $655.17 in early trading, giving bears hope for continuation of Wednesday's selling pressure. However, buyers stepped in aggressively throughout the morning and afternoon sessions, driving price higher to a session high of $662.98 before settling at $659.82 with a modest 0.24% decline. The session demonstrated the resilience of buyers as the MSI rescaled higher multiple times during the rally from morning lows, creating fresh resistance levels that price ultimately respected. The narrow $0.82 MSI spread at the close suggests tight consolidation despite the intraday volatility. Trading volume came in at 101.45 million shares, higher than average, indicating institutional participation in both the morning selling and afternoon recovery. The initial breakdown below the $656.97 opening level provided the first shorting opportunity targeting the morning lows around $655.17, but the subsequent rally from those lows created multiple long opportunities as the MSI rescaled higher. Each rescale provided a fresh setup as bulls defended the new support levels while targeting the expanding resistance zones. At minimum it was a four-for-four session for traders following the framework as the MSI provided clear directional guidance despite the complex intraday price action. It was a volatile but readable day with substantial setups, all identified through proper context, patience, and flexibility while leveraging the MSI, premarket levels, and market structure rather than forcing trades. The MSI continues to prove its reliability as the cornerstone of our trading process.
Trading Strategy Based on MSI:
Friday has light economic news so the market is likely to move more sideways than trend given the Bearish Trending Market State at the close. But with such a narrow range its also likely the MSI rescales overnight and a short squeeze ensues which will push price back to test higher levels. Bulls want to hold current levels overnight and push toward $660.19, while bears want to see the support at $659.37 fail to press price toward lower levels around $655. Given the Bearish Trending Market State at close with Thursday's modest 0.24% decline following Wednesday's sharp selling, Friday may also continue the downward pressure from recent sessions. Any rally toward the $660.19 resistance level presents a potential shorting opportunity targeting lower levels given the underlying bearish momentum, especially since the MSI maintained its Bearish Trending state despite Thursday's intraday recovery. However, if bulls can successfully break and hold above $660.19 with conviction, this would signal a potential shift back toward a more neutral stance and offer long setups back toward higher levels. The current positioning within the narrow MSI range creates a tactical setup where any move toward either boundary should be respected. A successful test and rejection at $660.19 would offer a clean short setup targeting the extended levels below, while any breakthrough and hold above $660.19 with volume presents a compelling long opportunity. The narrow $0.82 MSI spread suggests price is coiling for a larger move in either direction. Failed rallies to the $660.19 resistance are the highest probability setups given the current bearish framework, but the tight range demands patience for clear signals. The multiple rescales higher during Thursday's session show bulls are willing to defend levels, but the Bearish Trending state suggests any rallies will likely find selling pressure. The long-term bull trend remains intact above $640 and failed breakouts and failed breakdowns continue to offer the highest-probability setups. Remain flexible, avoid trading during Ranging Market States unless a clear failed breakout or breakdown presents itself, and ensure all trades are fully aligned with MSI signals. Providing real-time insights into market control, momentum shifts, and actionable levels, the MSI when integrated with our Pre-Market and Post-Market Reports continues to sharpen execution precision and elevate trade quality. If you haven't yet integrated MSI and our model levels into your process, now is the time. Contact your representative to get started as these tools are designed to support consistency and enhance performance.
Dealer Positioning Analysis
Dealers are selling SPY $676 to $700 and higher strike Calls while buying $660 to $675 Calls, indicating the Dealers' desire to participate in any rally on Friday. The ceiling for Friday appears to be $678. To the downside, Dealers are buying $659 to $525 and lower strike Puts in a 4:1 ratio to the Calls they're selling/buying displaying moderate concern that prices could move lower. Dealer positioning is unchanged at bearish.
Looking Ahead to Next Friday:
Dealers are selling SPY $676 to $710 and higher strike Calls while buying $660 to $675 Calls, indicating the Dealers' desire to participate in any rally next week. The ceiling for the week appears to be $680. To the downside, Dealers are buying $659 to $520 and lower strike Puts in a 5:1 ratio to the Calls they're selling/buying displaying heightened concern that prices could move lower. For the week Dealer positioning is unchanged at bearish. We advise reviewing Dealer positioning daily for directional clues. These positions evolve quickly and tracking them is essential for staying ahead of shifting market sentiment.
Recommendation for Traders
With SPY closing at $659.82 and testing key support levels, traders should remain cautious and consider taking profits on short positions while watching for potential bounce opportunities near the $655-657 zone. The VIX decline of 3.11% to 24.31 suggests some fear reduction, but elevated volume indicates continued uncertainty. Favor tight range trading around current levels with stops above $663 for shorts and below $655 for any long attempts. Keep position sizes modest given the mixed signals from elevated trading volume despite the modest pullback. With Treasury yields still pressuring markets and volatility remaining elevated above 24, disciplined risk management remains essential. Be sure to review the premarket analysis posted before 9 AM ET for any changes in the model's outlook and Dealer Positioning.
Good luck and good trading!
