Market Insights: Wednesday, March 18th, 2026
Market Overview
US stocks tumbled Wednesday after the Federal Reserve held rates steady as widely expected, but Fed Chair Jerome Powell's hawkish commentary sent markets spiraling lower throughout the afternoon. The Dow Jones Industrial Average plunged over 750 points or roughly 1.6% to its lowest close since November, while the S&P 500 dropped 1.3% and the Nasdaq fell over 1.4%, both also hitting four-month lows. The selloff accelerated during Powell's press conference as he warned that rate cuts won't materialize without meaningful progress on inflation, telling reporters bluntly "if we don't see that progress then you won't see the rate cut."
The central bank's decision received one dissent from Fed governor Stephen Miran who favored a rate reduction, but officials maintained their forecast for just one rate cut in 2025. Adding fuel to inflation concerns, government data released Wednesday morning showed wholesale prices surged 0.7% month-over-month in February, before the recent Middle East conflict began impacting energy markets. Oil prices continued their relentless climb with Brent crude futures reaching $104 per barrel and West Texas Intermediate trading near $98, as Iran reported attacks on some of its energy facilities. Bond yields spiked during Powell's remarks with the 10-year Treasury jumping more than 5 basis points while the dollar index pushed back above 100, creating a toxic cocktail of tightening financial conditions that hammered risk assets across the board.
SPY Performance
SPY opened at $668.36 but faced sustained selling pressure throughout the session, declining 1.37% to close at $661.61 as the benchmark ETF reversed the previous day's modest gains and broke below key support levels that had held during recent stabilization attempts. The ETF managed only a brief push to a session high of $669.72 in early trading before sellers took control and drove shares steadily lower for most of the day, creating downward momentum that accelerated during afternoon trading hours. The selling intensified as the session progressed, ultimately pushing SPY down to a session low of $661.23 and establishing a trading range of approximately $8.49 that reflected the heightened volatility and broad-based risk-off sentiment that dominated market action. Despite some late-session attempts to find support, the ETF struggled to mount any meaningful recovery and closed near session lows, signaling that bears maintained firm control throughout the trading day. Volume surged to 72.22 million shares, running well above average levels and confirming that the decline came with heavy institutional participation rather than thin conditions, suggesting genuine selling conviction among market participants. The VIX spiked 9.34% to 24.46, reversing its recent decline and indicating that market anxiety returned as investors grew increasingly uncomfortable with risk assets and sought defensive positioning. SPY's inability to hold above the previous session's closing level and its decisive break below recent support zones points to renewed institutional distribution and suggests that the recent stabilization effort may be faltering as selling pressure intensifies across the broader equity market.
Major Indices Performance
The Dow suffered the steepest decline with a 1.63% drop, reflecting broad-based selling pressure across its blue-chip constituents as defensive sectors failed to provide their typical safe-haven appeal. The Russell 2000 followed closely behind with a 1.47% loss, demonstrating how small-cap stocks bore the brunt of risk-off sentiment as investors retreated from higher-beta names amid growing uncertainty. The Nasdaq posted a 1.46% decline, showing that even technology-heavy indices couldn't escape the session's widespread selling despite some individual bright spots in the sector.
The performance convergence across all major indices painted a picture of indiscriminate selling rather than sector-specific weakness, with the relatively tight range of losses suggesting broad market pressure overwhelmed individual stock fundamentals. The Dow's worst performance highlighted how even traditionally stable large-cap industrials and consumer staples couldn't shield investors from the day's pessimistic mood. Meanwhile, the Russell 2000's substantial decline underscored small-caps' continued vulnerability to macroeconomic headwinds, with these companies facing dual pressures from both growth concerns and their typically higher financing costs in challenging rate environments.
Notable Stock Movements
Amazon plunged 2.48% to lead the Magnificent Seven lower during a session that saw the technology giants collectively drag on market performance and contribute meaningfully to the Nasdaq's 1.46% decline. The e-commerce and cloud computing leader's sharp retreat represented the most pronounced weakness among the mega-cap names and underscored how individual selling pressure within this influential group can amplify broader market declines, particularly when investors are already grappling with elevated volatility conditions.
The Magnificent Seven delivered a predominantly negative session that weighed heavily on technology sector performance, with most names posting losses that aligned with the group's tendency to move in sympathy during periods of market stress. The collective weakness among these market leaders proved particularly damaging given their substantial index weightings and demonstrated how quickly sentiment can shift when growth-oriented names face selling pressure across multiple fronts simultaneously.
This broad-based decline among the technology titans reflected the day's risk-off environment and highlighted their continued role as key sentiment indicators, even when that influence works against overall market momentum. The group's inability to provide any meaningful support during the session's weakness reinforced how these stocks remain central to investor positioning strategies, with their collective performance serving as a reliable barometer for broader market confidence levels, particularly as rising volatility creates conditions that typically challenge high-multiple growth names that dominate this closely-watched cohort.
Commodity and Cryptocurrency Updates
Crude oil continued its impressive rally with a 1.76% surge to $97.90, pushing even further above the $70 threshold and maintaining momentum that has consistently defied longer-term model expectations. The energy commodity's relentless advance reflects persistent geopolitical tensions and supply concerns that continue to overwhelm fundamental economic factors, with today's gain extending what has become a remarkable run higher. This sustained strength well above $70 presents mounting challenges for Federal Reserve policy makers, as elevated energy costs feed directly into inflationary pressures and could increasingly influence monetary policy deliberations if the rally maintains its current trajectory.
Gold suffered a sharp 3.08% decline to $4,847, falling back below the psychologically important $5,000 level after yesterday's modest recovery proved short-lived. The precious metal's retreat suggests profit-taking and potentially shifting investor sentiment as market dynamics evolve, with the magnitude of today's decline indicating more than routine consolidation. The pullback from recent highs may reflect reduced safe-haven demand or technical selling pressure, though gold's longer-term appeal typically reasserts itself during periods of broader market uncertainty.
Bitcoin dropped 4.01% to close above $70,959, surrendering a meaningful portion of recent gains while still maintaining its position above the critical $70,000 threshold that has become a closely watched technical benchmark. The cryptocurrency's decline appears consistent with broader risk-off sentiment across markets rather than any fundamental shift in digital asset adoption or institutional interest. Despite the notable pullback, Bitcoin's ability to hold above these elevated levels demonstrates the underlying strength of demand that has characterized the space, with today's weakness likely representing normal volatility rather than a meaningful trend reversal.
Treasury Yield Information
The 10-year Treasury yield surged 1.36% to close at 4.260%, reversing yesterday's decline and pushing rates back toward our critical 4.5% threshold that historically signals the onset of equity market pressure. Today's sharp advance eliminated much of the previous session's relief, reducing the safety buffer to just 24 basis points below the danger zone and creating increasingly uncomfortable conditions for risk assets as demonstrated by the broad-based selloff across major indices and the VIX's 9.34% spike to 24.46. The yield's aggressive move higher from the 4.200% level suggests bond markets are facing renewed selling pressure, with the current 4.260% reading now positioning rates uncomfortably close to problematic territory where equity volatility typically accelerates. While still below our 4.5% warning level, today's advance serves as a clear reminder of how quickly the rate environment can deteriorate, with traders now facing a narrowing margin for error as yields approach the threshold where mounting pressure on stocks becomes evident. The market's immediate negative reaction to rising yields once again underscores the tight correlation between rate movements and equity performance, with investors acutely aware that a breach above 4.5% historically introduces sustained headwinds for stocks, while any advance beyond 4.8% typically triggers broader selloff conditions, and a move toward 5% would signal substantial market risk with the potential for correction territory exceeding 20% should yields ultimately challenge our critical 5.2% level.
Previous Day’s Forecast Analysis
Our AI model projected SPY would trade within a $660-$675 range on Wednesday, maintaining a bullish bias following Tuesday's modest advance that closed at $670.79. The $15 projected range suggested trending rather than consolidative action, indicating potential for significant directional movement as traders positioned around key technical levels. Primary resistance was identified in the $672-$675 zone, where sustained breakouts on volume would confirm upside momentum toward targets beyond the upper boundary. Critical support was established at the bias level around $666-$667, with weakness below opening downside exposure toward $665 and potentially the lower range boundary near $660.
The model emphasized the $667 bias area as the key inflection point, where sustained action above would maintain the positive tone while failure below would shift momentum bearish and activate lower targets. Despite the bullish bias, the forecast warned that sustained rallies required significant buying conviction given the current market structure. For trading strategy, the newsletter recommended initiating long positions on pullbacks toward $669-$670 with profit targets at $674-$675 and extended objectives near $678, using protective stops below $667. Bearish reversal trades were suggested on any failure to hold above $671-$672, targeting downside moves toward $665-$666 with stretch goals near $660. The strategy focused on the $670-$674 range as the critical battleground, with 2-3 point stop distances recommended for risk management around these decision levels.
Market Performance vs. Forecast
SPY opened below our projected $660-$675 range at $668.36 and experienced significant selling pressure that drove the index to a session low of $661.23, ultimately closing at $661.61 with a substantial 1.37% decline. External catalysts drove price action beyond our projected range, as geopolitical developments introduced volatility that exceeded the model's base case scenario for contained trading within technical boundaries. Our framework correctly identified the $667 bias area as a critical inflection point, with SPY's failure to maintain this level triggering the bearish momentum shift our model warned would activate lower targets if buying conviction failed to materialize around key support zones.
The VIX surging 9.34% to 24.46 validates our analysis that energy remained inconsistent despite the constructive bias, with fear levels spiking as sellers established control and drove meaningful downside pressure toward our lower range boundary. Our risk management protocols protected capital effectively, as the protective stops we recommended below $667 would have limited exposure once the critical threshold was breached and momentum shifted decisively bearish. While our model does not account for unpredictable external events that can produce outsized moves, the framework's identification of $667 as the key decision point proved accurate in determining directional bias. Today's elevated volume of 72.22 million shares above average demonstrates genuine institutional participation in the selling, reinforcing how our technical analysis successfully anticipated that failure below critical support would unleash significant downward pressure and activate the lower targets our framework projected.
Premarket Analysis Summary
This morning's premarket analysis posted at market open identified $672 as the critical bias level, with upside targets set at $675 and $678, while downside support was projected at $673, $670, and $665. The framework characterized the market as balanced but coiled to spring in either direction ahead of major news catalysts, suggesting that holding above the bias level would likely drive progress toward $675 initially and possibly $678 if buyers sustained momentum. The analysis warned that losing the bias level would trigger consolidation in the midrange, with particularly concerning conditions emerging below $670 where a potential slide to $665 could develop primarily through news-related selling pressure.
The actual market performance fell well short of premarket expectations, as SPY opened at $668.36, immediately breaking below both the bias level and the lower support target of $673. Rather than finding stabilization near the projected consolidation zone, the market demonstrated sustained weakness throughout the session, reaching a low of $661.23 that pierced through the maximum downside target of $665. The close at $661.61 with a sharp 1.37% decline, accompanied by the 9.34% VIX surge to 24.46, confirmed that the feared news-driven selling pressure materialized with greater intensity than the premarket framework had anticipated, overwhelming all identified support levels and pushing the market into territory well beyond the established downside projections.
Validation of the Analysis
The premarket analysis proved remarkably prescient in identifying the market's vulnerability below our critical 672 bias level, as SPY opened at $668.36 and immediately confirmed our warning that losing this support would trigger broader weakness. Our projection that "below 670 things become grim" materialized precisely as anticipated, with SPY breaking through this threshold early and cascading toward our downside target of 665, ultimately reaching a session low of $661.23 that exceeded even our most bearish scenario. The framework's accuracy shone through our expectation of "consolidation in the midrange" failing to hold, as the market's inability to reclaim 670 throughout the session validated our concern about structural weakness beneath key support levels. Traders following our guidance could have recognized the opening below 672 as an immediate warning signal, used our 670 breakdown level as a clear short entry point, and targeted our 665 objective for profit-taking as the decline accelerated. The elevated volume of 72.22 million shares above average confirmed our analysis that significant news catalysts would drive directional moves, though the outcome favored our bearish scenario rather than the upside potential we identified above 672. Our assessment that the market was "coiled to spring in either direction" proved accurate as the 1.37% decline and VIX surge to 24.46 demonstrated the explosive volatility we anticipated. The close at $661.61 validated our framework's ability to identify critical inflection points, as the failure to hold our clearly defined bias level triggered the exact downside progression we outlined, providing traders with both precise risk management levels and profit targets that the market honored throughout this challenging session.
Looking Ahead
Thursday's economic calendar centers on the weekly Unemployment Claims report, which will provide the first labor market reading following Wednesday's Federal Reserve decision and Chair Powell's press conference. While typically a secondary data point, jobless claims take on added significance as traders digest the Fed's updated guidance and look for confirmation that employment trends remain consistent with policymakers' economic projections and rate path expectations.
With the heavy lifting of Fed policy now behind us, Thursday's quieter calendar allows market participants to consolidate Wednesday's developments and position portfolios based on the central bank's latest signals. The unemployment data will serve as an early indicator of whether labor market conditions are tracking with the Fed's assessment, potentially reinforcing or challenging the policy narrative that emerges from this week's FOMC meeting as we move deeper into March 2026.
Market Sentiment and Key Levels
Bears seized firm control of market sentiment as SPY suffered a sharp 1.37% decline to $661.61, with the selling accelerating through the session and leaving bulls scrambling to defend key support levels. The VIX's surge of 9.34% to 24.46 signals a meaningful shift toward defensive positioning as fear levels climb back above the 24 threshold where institutional hedging typically intensifies. The $8.49 trading range between $669.72 and $661.23 demonstrates the severity of selling pressure that overwhelmed any attempts at buying interest, creating a decisive break below recent consolidation patterns that suggests bears have gained the upper hand in controlling near-term direction.
The $669.72 session high now represents critical resistance that bulls will need to reclaim with conviction to halt the current downtrend momentum, though this level appears increasingly distant given the closing weakness near session lows. More importantly, the $661.23 intraday low serves as immediate support that barely held during the final hour of selling, and any violation of this level could trigger accelerated losses toward the $655-$658 zone where more substantial support may emerge from previous trading ranges. A failure to hold $661.23 would likely invite algorithmic selling programs and force additional defensive positioning that could quickly extend losses.
Market dynamics present multiple headwinds that could drive continued selling pressure if current trends persist into upcoming sessions. The elevated trading volume accompanying today's decline suggests institutional distribution rather than retail panic, indicating more methodical selling that could prove sustainable. Rising commodity pressures and yield concerns continue creating a challenging backdrop for risk assets, while the broad market's inability to find meaningful buying interest at lower levels suggests underlying demand has weakened considerably. Any bounce from current levels would need to reclaim $665-$667 resistance with authority to shift the immediate bearish tone, while failure to defend $661.23 support could quickly accelerate losses toward the mid-$650s where more significant technical damage would occur.
Expected Price Action
Our actionable intelligence generated by our AI model projects SPY will trade in a $665-$678 range for Thursday, establishing a neutral to slightly bearish bias after Wednesday's sharp decline that closed at $661.61 near the session's lows. The $13 projected range indicates potential for trending action rather than sideways consolidation, suggesting directional movement could develop as traders react to the previous session's heavy selling pressure. Primary resistance emerges at the $672 bias level, where the model expects any sustained recovery attempt must hold to maintain constructive momentum toward the $675 initial target and potentially $678 if buyers can establish control.
Critical support appears at the $670 threshold, but the model warns that weakness below this level turns conditions grim with downside exposure extending toward $665 at the lower range boundary. Given that SPY closed well below the bias level at $661.61, the market structure favors sellers initially, though oversold conditions could spark bounce attempts toward the midrange. Traders should monitor the $670-$672 zone as the key battleground - sustained reclaim of this area shifts momentum back toward neutral while failure to mount meaningful recovery keeps bearish pressure intact. The elevated VIX reading of 24.46 combined with above-average volume suggests market stress remains elevated, making any rallies vulnerable to profit-taking unless accompanied by decisive buying conviction that can establish control above the critical bias threshold.
Trading Strategy
The sharp decline with elevated participation creates critical trading opportunities around the $661-$663 support zone that emerged from today's selling pressure. For bullish reversal scenarios where buyers step in at these levels, initiate long positions on any bounce above $663-$664 with profit targets at $667-$668 and extended objectives near $671 if recovery momentum develops through resistance areas. Place protective stops below $660 to limit downside exposure while allowing sufficient room for normal volatility around these technical boundaries, especially given the substantial volume that accompanied the breakdown through previous support levels.
In bearish continuation trades, short any failure to reclaim the $665-$667 zone with downside targets toward $657-$658 and stretch goals near $652 if selling pressure persists through the established breakdown framework. The VIX rose 9.34% to 24.46, indicating heightened fear levels that warrant reduced position sizing and tighter risk management discipline around key technical zones. Focus strategies on the $661-$667 range that developed from today's weakness, as decisive breaks beyond these parameters could trigger meaningful moves toward $671 upside or $655 downside objectives.
The coordinated weakness across indices suggests institutional distribution rather than mere profit-taking, favoring defensive approaches over aggressive accumulation strategies until this breakdown phase stabilizes clearly. Risk management should utilize 3-4 point stop distances from the $661-$667 decision range, which now serves as the critical battleground for determining whether recent weakness marks temporary consolidation or represents the beginning of deeper correction that could challenge foundational support levels. Position sizing should be conservative given elevated volatility readings while preparing for either technical bounce scenarios or possible acceleration of selling if market conditions continue deteriorating through established support zones.
Model’s Projected Range
SPY's projected maximum range for Thursday is $650 to $671, with the Put side dominating in an expanding band that suggests trending price action with intermittent chop. Tomorrow brings Unemployment Claims which are unlikely to move the market. SPY closed at $661.61, down 1.37%, falling back below the $685 level as bears battle the bulls for control in this two-way trading environment, with today's session seeing the index open at $668.36, reach a high of $669.72 before selling off to a low of $661.23 on lower than average volume while the VIX rose 9.34% to 24.46. SPY is trading below key support at $675 as geopolitical tensions continue to weigh on market sentiment. Looking ahead to Thursday's session, our model shows resistance at $665 with a break of this level targeting $669, while support below sits at $658 with a break of this level targeting $655. If support at $655 breaks there is little to keep price from falling toward $640. The long-term bull trend remains intact above $640, and now that we are out of February, the market should set up for a spring and summer rally to new highs. We have stated for some time, as long as price holds above key structural levels, this remains a broader dip-buying environment. Absent a catalyst, resistance sits at $665, $669, $670, $671, while support rests at $658, $655, $650, $645. We favor buying dips at $658 given the oversold conditions. Bitcoin dropped 4.01% to close above $70,959 while MAG stocks posted a mostly red day across the board led by Amazon down 2.48%, and sustained weakness across both leadership groups would be required to signal a deeper pullback. The VIX closed at 24.46, up 9.34%, suggesting elevated fear given the broader market selloff. SPY closed below the lower end of the bull trend channel from the April lows with structural resistance at $668.
Market State Indicator (MSI) Forecast
Current Market State Overview:
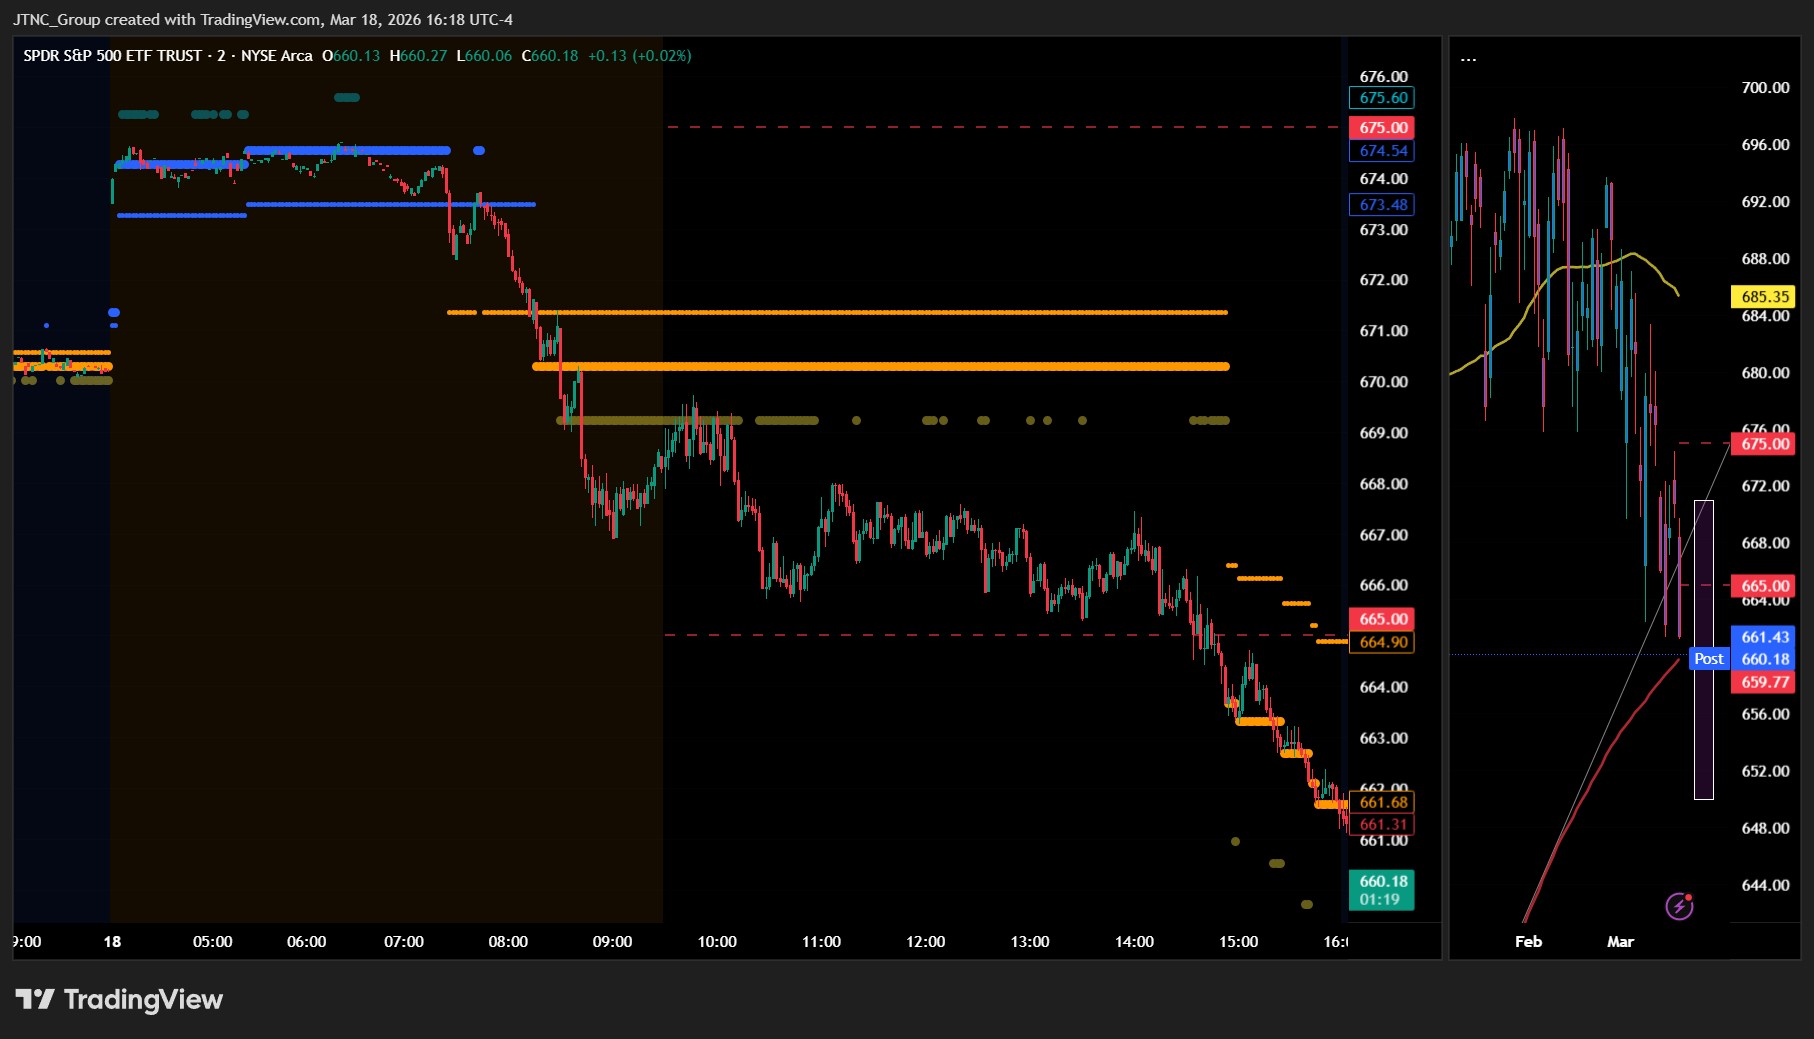
The MSI ended Wednesday in a Bearish Trending Market State with SPY closing at $661.61. Extended targets were printing below at the close, having been visible above and below in premarket before extended targets printed below during the AM session and PM session as selling pressure accelerated. The MSI rescaled lower multiple times during the session as price declined sharply, indicating strong bearish momentum and transitioning from an initial Bullish Trending state in premarket to the current Bearish Trending state with a wide $3.22 spread. The session began with strength in premarket but bears seized control as the day progressed, forcing the MSI to expand dramatically as selling cascaded through multiple support levels. The MSI forecast for Thursday calls for a strong continuation lower with the bears maintaining pressure and extended targets suggesting downside momentum will persist. Since SPY closed below MSI support, the former MSI support level of $661.68 now becomes resistance for Thursday's session with MSI resistance at $664.9.
Key Levels and Market Movements:
Tuesday we stated, "Bulls want to hold current levels overnight and push toward $672," and added, "bears want to see $670.57 fail to press price toward lower levels around $669," while also noting, "Given the Ranging Market State at close with today's modest 0.26% advance, Wednesday is likely to continue the sideways to slightly higher action from Tuesday's session." Wednesday's session started off as the MSI framework anticipated but quickly turned into a completely different outcome with the FOMC events providing the catalyst bears needed to break down key support levels. SPY opened at $668.36 and briefly touched $669.72 in early trading, giving bulls hope for the upward momentum they wanted from Tuesday's close. However, intense selling pressure emerged following the Fed's hawkish stance as the MSI rescaled lower several times, taking SPY from those morning highs down to a session low of $661.23 before closing at $661.61 with a devastating 1.37% decline. The session started with promise as premarket extended targets provided mixed signals, but the Fed's decision to maintain higher rates for longer quickly attracted aggressive sellers who maintained control throughout the afternoon. With the MSI transitioning from Bullish Trending in premarket to Bearish Trending as the day progressed, traders had clear directional signals as the framework expanded around accelerating price declines. The wide $3.22 MSI spread created multiple tactical opportunities where any rally to the former support-turned-resistance at $661.68 offered shorting opportunities targeting the extended levels below, while the breakdown below Tuesday's support at $670.57 provided the initial short setup that led to the session's substantial moves. At minimum it was a two-for-two session for traders following the framework as the MSI provided multiple clean setups with the rescaling lower creating fresh short opportunities at each new resistance level. It was an easy day to read and execute with substantial setups, all identified through proper context, patience, and flexibility while leveraging the MSI, premarket levels, and market structure rather than forcing trades. The MSI continues to prove its reliability as the cornerstone of our trading process.
Trading Strategy Based on MSI:
Thursday has light economic news with only Unemployment Claims so the market is likely to move more sideways to down than trend given the Bearish Trending at close. Bulls want to hold current levels overnight and push toward $664.9, while bears want to see the former support-turned-resistance at $661.68 fail to press price toward lower levels around $658. Given the Bearish Trending Market State at close with Wednesday's sharp 1.37% decline, Thursday is likely to continue the downward pressure from Wednesday's session. Any rally toward the $661.68 resistance level presents a potential shorting opportunity targeting lower levels given the strong bearish momentum, especially if the level that formerly provided support now acts as resistance. However, if bulls can successfully reclaim and hold above $661.68 with conviction, this would signal a potential shift back toward a more neutral stance and offer long setups back toward the $664.9 area. The current positioning below the MSI range creates a tactical setup where any bounce will likely find selling pressure at the former support level. A successful test and rejection at $661.68 would offer a clean short setup targeting the extended levels below, while any breakthrough and hold above $661.68 with volume presents a compelling long opportunity back toward $664.9 resistance. The Fed's hawkish stance has clearly shifted sentiment and the MSI's expansion into a wide Bearish Trending state suggests this move has more room to run. Failed rallies back to the $661.68 resistance are the highest probability setups given the current bearish momentum. If economic data provides any negative catalyst, watch for the MSI to continue expanding lower and maintain its Bearish Trending state. The long-term bull trend remains intact above $640 and failed breakouts and failed breakdowns continue to offer the highest-probability setups. Remain flexible, avoid trading during Ranging Market States unless a clear failed breakout or breakdown presents itself, and ensure all trades are fully aligned with MSI signals. Providing real-time insights into market control, momentum shifts, and actionable levels, the MSI when integrated with our Pre-Market and Post-Market Reports continues to sharpen execution precision and elevate trade quality. If you haven't yet integrated MSI and our model levels into your process, now is the time. Contact your representative to get started as these tools are designed to support consistency and enhance performance.
Dealer Positioning Analysis
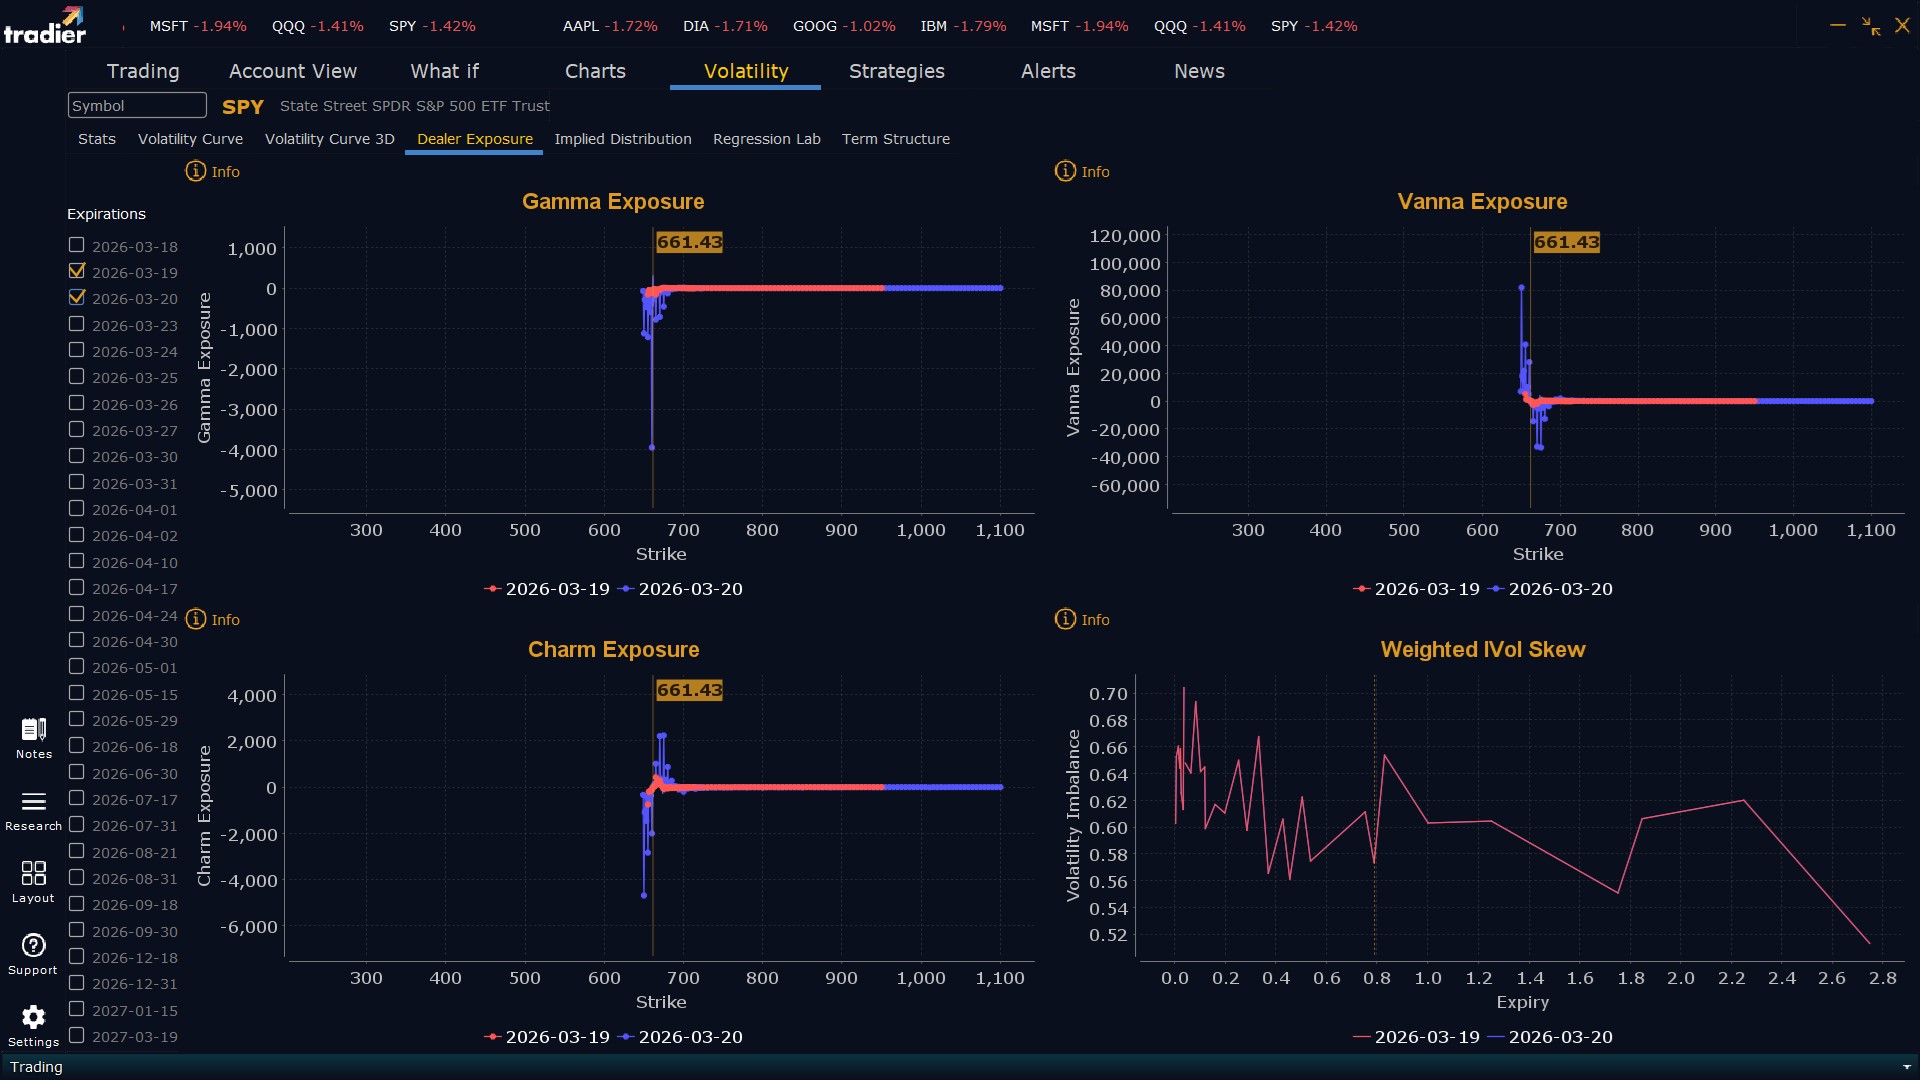
Dealers are selling SPY $673 to $700 and higher strike Calls while buying $662 to $672 Calls, indicating the Dealers' desire to participate in any rally on Thursday. The ceiling for Thursday appears to be $675. To the downside, Dealers are buying $661 to $575 and lower strike Puts in a 4:1 ratio to the Calls they're selling/buying displaying moderate concern that prices could move lower. Dealer positioning is unchanged at bearish.
Looking Ahead to Next Friday:
Dealers are selling SPY $682 to $710 and higher strike Calls while buying $662 to $681 Calls, indicating the Dealers' desire to participate in any rally this week. The ceiling for the week appears to be $676. To the downside, Dealers are buying $661 to $520 and lower strike Puts in a 5:1 ratio to the Calls they're selling/buying displaying heightened concern that prices could move lower. For the week Dealer positioning is unchanged at bearish. We advise reviewing Dealer positioning daily for directional clues. These positions evolve quickly and tracking them is essential for staying ahead of shifting market sentiment.
Recommendation for Traders
With SPY closing at $661.61 after a sharp 1.37% decline, traders should favor short positions or stay defensive around any bounces toward the $665-668 resistance zone. The VIX surge of 9.34% to 24.46 signals increased fear, making long entries risky without clear support confirmation. Consider tight stops above $669 for short positions and wait for sustained breaks below $661 for additional downside momentum. Keep position sizes modest given the elevated volatility environment and heavy trading volume. Risk management remains paramount with the VIX above 24 and broad market weakness across all major indices. Be sure to review the premarket analysis posted before 9 AM ET for any changes in the model's outlook and Dealer Positioning.
Good luck and good trading!
