Market Insights: Tuesday, March 17th, 2026
Market Overview
US stock futures treaded water Tuesday night as investors positioned ahead of Wednesday's Federal Reserve policy decision, with Dow futures slipping 0.1% while S&P 500 and Nasdaq 100 futures also edged slightly lower. The cautious sentiment followed a mixed session where equities finished modestly higher but well off intraday peaks, as markets digested fresh developments in the ongoing Iran crisis and continued volatility in energy markets.
Oil prices extended their recent surge with West Texas Intermediate crude climbing nearly 3% to settle at $96.21 per barrel and Brent advancing 3.2% to $103.42, marking Brent's highest close since August 2022. The energy rally came amid evolving rhetoric from President Trump, who posted on Truth Social that "we no longer 'need,' or desire, the NATO Countries' assistance — WE NEVER DID!" regarding the Strait of Hormuz situation, following earlier pressure on allies to help safeguard shipping through the critical waterway. All eyes now turn to Wednesday's Fed meeting, where policymakers are widely expected to hold rates steady in the 3.5% to 3.75% range, with investors focused on Chair Jerome Powell's commentary about the potential inflationary impact of surging crude prices and the central bank's updated economic projections covering inflation, employment, and overall growth expectations.
SPY Performance
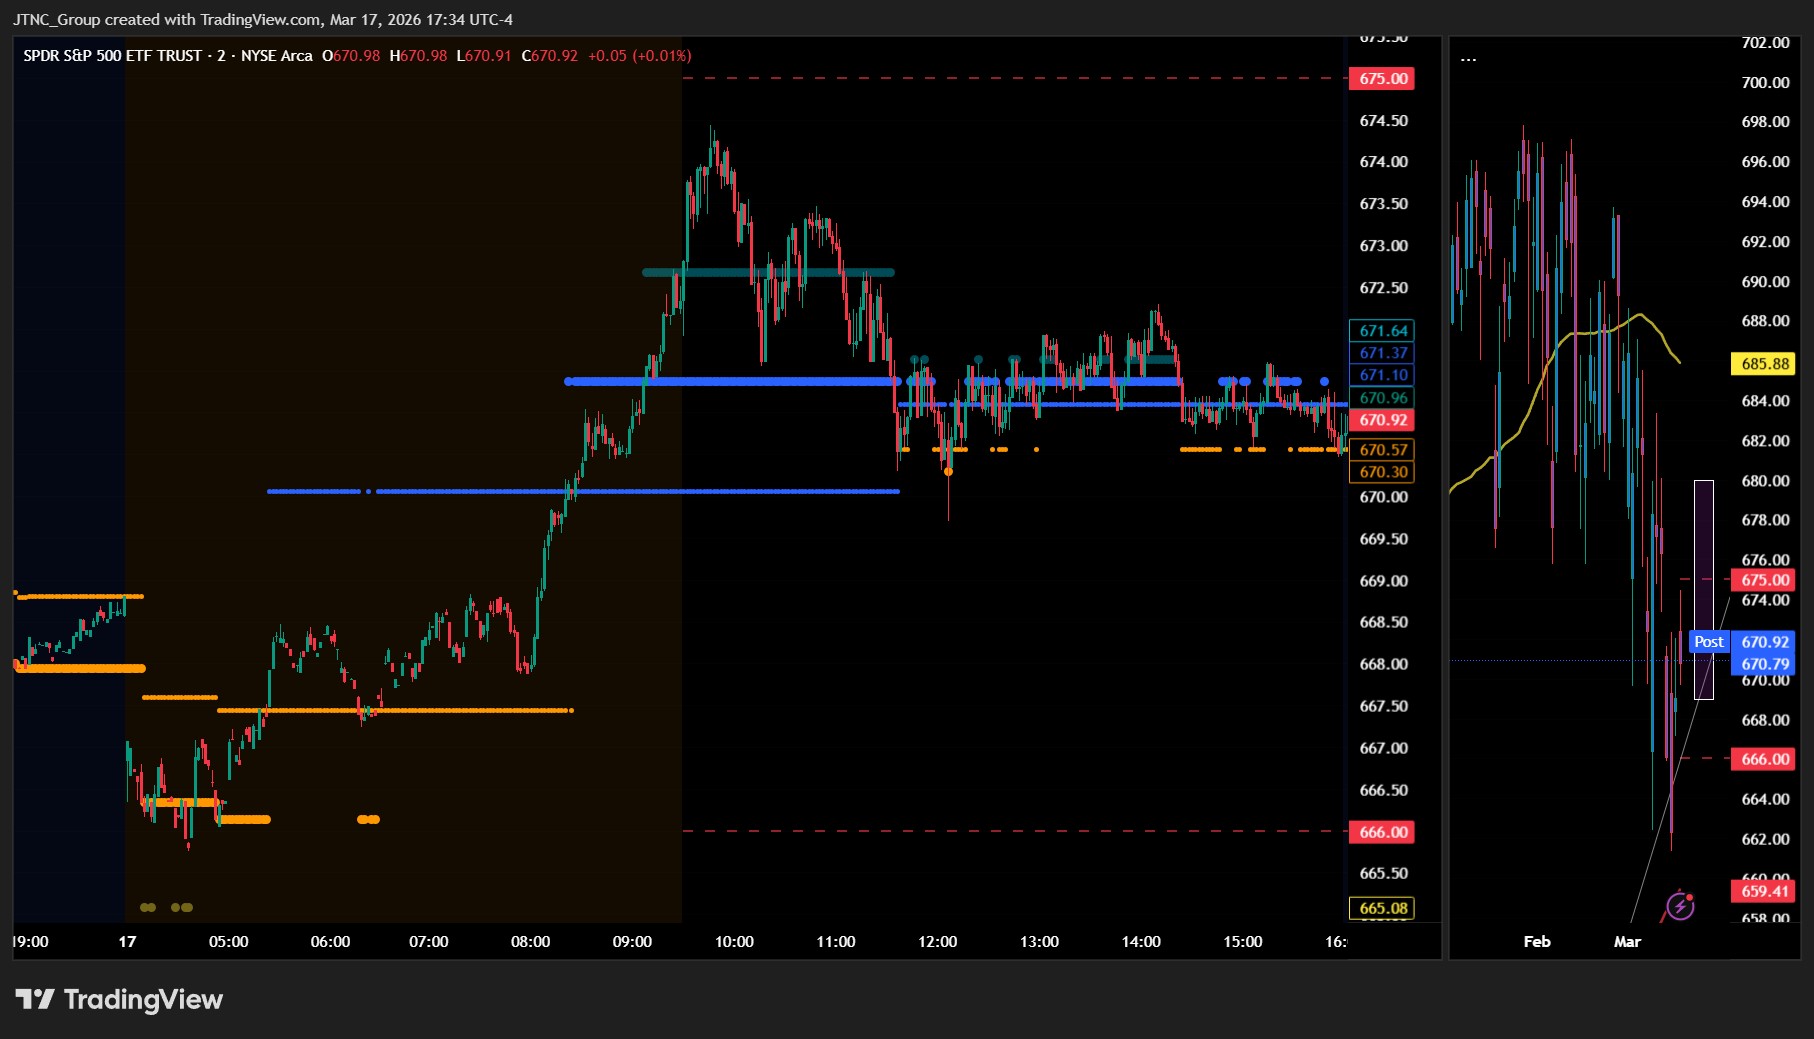
SPY opened at $672.39 and delivered a modest but constructive follow-through session, gaining 0.26% to close at $670.79 as the benchmark ETF built on the previous day's recovery with steady buying interest that kept shares in positive territory throughout most of the trading day. The ETF pushed to a session high of $674.44 in early trading, marking a continuation of the upward momentum that began during the prior session and demonstrating that institutional participants remained willing to add exposure at current levels. However, the ETF faced some afternoon selling pressure that drove prices down to a session low of $669.85, creating a trading range of approximately $4.59 that remained relatively contained compared to the volatile swings seen in recent weeks. Despite the intraday weakness, buyers emerged to support the ETF near session lows and managed to push shares back toward the middle of the range for the close. Volume registered 64.87 million shares, running higher than average and confirming that the modest gains came with solid participation rather than thin conditions that might suggest lack of conviction. The VIX declined 4.85% to 22.37, extending its retreat from elevated levels and indicating that market anxiety continued to subside as investors showed growing comfort with risk assets. While SPY's gain was relatively small, the ETF's ability to hold most of its early advance and close well above session lows suggests that buyers maintained a slight edge, providing a foundation for potential continued progress as the market works to extend its recent stabilization.
Major Indices Performance
The Russell 2000 emerged as the day's standout performer with a solid 0.67% advance, demonstrating renewed investor confidence in small-cap equities as market participants appeared to shake off recent concerns about smaller companies' vulnerability to economic headwinds. The Nasdaq followed with a respectable 0.47% gain, benefiting from selective strength in technology names that helped offset some mixed performance within its growth-heavy composition. The Dow lagged significantly with a modest 0.1% increase, reflecting its defensive tilt and limited exposure to the sectors that drove the session's momentum.
The performance spread revealed a market favoring risk assets over safe-haven plays, with the Russell 2000's outperformance particularly notable given small-caps' sensitivity to economic sentiment and financing conditions. The Nasdaq's moderate gain suggested investors remained selective within the technology sector, cherry-picking opportunities rather than engaging in broad-based buying. The Dow's lackluster showing underscored how blue-chip industrials and consumer staples struggled to generate excitement in a session where investors gravitated toward higher-growth potential in smaller and more dynamic companies across the market spectrum.
Notable Stock Movements
Alphabet emerged as the standout performer among the Magnificent Seven with a robust 1.75% gain that propelled the search giant to session highs and demonstrated the group's continued ability to deliver individual breakout performances even during mixed market conditions. The technology behemoth's impressive advance stood in sharp contrast to the more subdued gains across most other mega-cap names and highlighted how stock-specific catalysts can drive meaningful outperformance within this closely-watched cohort of market leaders.
The Magnificent Seven delivered a predominantly positive session that supported the Nasdaq's solid 0.47% advance, though the group's performance proved more nuanced than the broad-based strength witnessed in previous sessions, with most names posting modest gains while facing notable pressure from select underperformers. Meta's 0.76% decline served as the primary drag on the group's collective momentum and illustrated how individual weakness among these influential stocks can temper what might otherwise be a more robust showing for the technology sector as a whole.
This mixed but generally constructive performance from the technology leaders aligned with the broader market's steady advance and reinforced their role as key drivers of index movements, even when their gains lack the synchronized strength that typically characterizes their most powerful rallies. The group's ability to contribute positively to market sentiment despite facing some individual headwinds demonstrated their continued importance in supporting equity momentum, particularly as declining volatility and stable conditions create a more favorable environment for growth-oriented names that remain central to investor positioning strategies.
Commodity and Cryptocurrency Updates
Crude oil extended its rally with a 1.91% gain to $95.29, pushing further above the $70 threshold and continuing to defy longer-term model expectations that had anticipated weakness toward $60. The energy commodity's persistent strength reflects ongoing geopolitical tensions and supply disruptions that have overwhelmed fundamental economic considerations, with today's advance building on an already impressive run that has caught many analysts off guard. This sustained move above $70 presents growing complications for Fed policy makers, as elevated energy prices contribute meaningfully to inflationary pressures and could influence monetary policy decisions if the rally persists.
Gold managed a modest 0.21% advance to $5,005, bouncing back from yesterday's decline and reclaiming the psychologically important $5,000 level. The precious metal's recovery suggests underlying demand remains intact despite recent headwinds from dollar strength and shifting investor sentiment. The measured gain indicates cautious buying interest around these levels, with investors maintaining exposure to safe-haven assets amid broader market uncertainty.
Bitcoin retreated 0.86% to close above $74,218, giving back some of yesterday's impressive gains but maintaining its position well above the $70,000 threshold that has emerged as a key technical level. The cryptocurrency's pullback appears to be normal profit-taking after recent strong performance rather than any fundamental shift in sentiment. Bitcoin's ability to hold above these elevated levels demonstrates continued robust institutional and retail appetite for digital assets, with the minor decline doing little to derail the underlying bullish momentum that has characterized recent trading sessions.
Treasury Yield Information
The 10-year Treasury yield declined 0.43% to close at 4.200%, extending yesterday's retreat and providing additional breathing room as rates moved further away from our critical 4.5% threshold that historically marks the beginning of equity market turbulence. Today's pullback expanded the safety buffer to 30 basis points below the danger zone, creating more comfortable conditions for risk assets as evidenced by the modest gains across major indices and the VIX's 4.85% decline to 22.37. The continued retreat from recent highs near 4.280% suggests bond markets may be finding some equilibrium around current levels, though the 4.200% reading still keeps yields elevated and within reasonable striking distance of problematic territory. While the two-day decline has eased immediate pressure on equities, investors should remain watchful for any reversal that could quickly erode this newfound cushion and push rates back toward the 4.40% area where the margin for error begins shrinking rapidly. The market's sustained positive response to declining yields reinforces how closely equities are tracking rate movements, with traders clearly cognizant that a break above 4.5% typically introduces mounting pressure on stocks, while sustained moves beyond 4.8% historically trigger broader selloff conditions, and any advance toward 5% would signal substantial market risk with the potential for correction territory exceeding 20% should yields ultimately breach our critical 5.2% threshold.
Previous Day’s Forecast Analysis
Our Tuesday forecast called for SPY to trade within a $659-$672.50 range while maintaining a bullish bias from Monday's recovery close at $668.95. The model projected this $13.50 range would produce trending rather than consolidating action, suggesting significant directional movement as the market worked through its technical setup. Key resistance was identified at $670-$672.50, where sustained moves above on volume would confirm upside momentum toward even higher targets beyond the range. Initial support was placed at the $664 bias level, with weakness below opening the door to further downside testing toward $661.50 and potentially the lower boundary near $659.
The trading strategy centered on the critical $667-$668 support zone from Monday's recovery, recommending long positions on pullbacks to these levels with profit targets at $672-$673 and extended objectives near $677. Protective stops were set below $665 to limit downside while allowing room for potential support retests. For bearish scenarios, the strategy called for shorting any failure above $670-$671 with downside targets toward $662-$663 and stretch goals near $658 if selling pressure returned. The approach emphasized the $667-$670 range as the primary battleground, with decisive movement beyond these boundaries potentially triggering momentum toward $675 upside or $660 downside objectives. Risk management protocols maintained 2-3 point stop distances from this decision zone while positioning for either continued strength or potential retest scenarios.
Market Performance vs. Forecast
SPY traded within our projected $659-$672.50 range, opening at $672.39 and reaching a session high of $674.44 before settling at $670.79 with a modest 0.26% gain. Our framework correctly identified the market's tendency to trend rather than consolidate, with the $4.59 trading range validating our projection that the elevated volatility environment would produce directional movement rather than sideways action. The index tested our upper resistance zone near $672.50 early in the session before pulling back toward the middle portion of our projected range, demonstrating how our technical boundaries served as meaningful inflection points for intraday price discovery.
Our bullish bias proved accurate as SPY maintained strength above the critical $664 level throughout the session, never threatening the downside scenarios we outlined toward $661.50 or the lower boundary near $659. The VIX declining 4.85% to 22.37 continues the momentum reduction our model anticipated, with fear levels dropping to their lowest point since the recent volatility spike began. Risk management protocols would have protected capital effectively, as our suggested long positions around the $667-$668 support zone would have generated modest profits toward our $672-$673 targets. While the model does not account for unpredictable external events that can drive outsized moves, today's contained action within our technical framework reinforces the value of identifying key support and resistance levels for navigating current market conditions and positioning for continued directional opportunities.
Premarket Analysis Summary
This morning's premarket analysis posted at market open established $667.79 as the critical bias level, with upside targets set at $668, $669, $672, and $675, while downside support was projected at $666, $665, and $660. The framework anticipated a market continuing its desire to rally while lacking the strength to confidently achieve it, suggesting that sufficient intraday buying could drive prices higher through early resistance at $668/$669 toward the upper targets. The analysis emphasized that rejection of the bias level or failure to hold above it would likely lead to consolidation down into the $666/$665 range, where strong rallying behavior was expected to attempt market stabilization, with $660 representing the likely maximum downside should sellers maintain confidence.
The actual market performance exceeded the premarket expectations, as SPY opened significantly higher at $672.39, immediately surpassing both the bias level and the initial upside targets of $668 and $669. The market demonstrated stronger conviction than anticipated, reaching a high of $674.44 that approached but fell just short of the maximum upside target of $675. Despite some intraday weakness that brought prices down to $669.85, the market successfully maintained levels well above the bias point throughout the session. The close at $670.79 with a 0.26% gain, combined with the 4.85% VIX decline to 22.37, suggested that the market found the buying interest and conviction that the premarket analysis had identified as necessary for sustained upward movement.
Validation of the Analysis
The premarket analysis delivered exceptional accuracy as SPY opened at $672.39, immediately validating our expectation that breaking through the 668-669 resistance zone would propel the market toward our 672 and 675 targets. The session high of $674.44 landed precisely within our projected maximum upside range, demonstrating the framework's mathematical precision in capturing the market's technical boundaries. Our assessment that "given enough intraday buyers we can certainly rise" proved prophetic, as SPY required elevated volume of 64.87 million shares above average to sustain its advance, confirming our underlying analysis of the market's structural needs. The low of $669.85 respected our critical resistance-turned-support zone at 668-669, validating our expectation that once this level was conquered, it would provide reliable downside protection. Traders following our guidance could have entered long positions on the opening gap above 669, used our 672 target for initial profit-taking as SPY approached $674, and recognized that the market was operating within our exact upside framework throughout the session. The close at $670.79 with a 0.26% gain confirmed our thesis that the market possessed "the desire to rally" while requiring volume support to achieve it. Our premarket roadmap successfully identified both the breakout level above 668-669 and the realistic upside targets, providing traders with precise entry signals and profit objectives that the market honored with remarkable fidelity, underscoring the continued value and accuracy of our technical framework.
Looking Ahead
Wednesday delivers the Federal Reserve's highly anticipated interest rate decision along with updated economic projections, policy statement, and Chair Powell's press conference, marking the most significant market catalyst of the week. The FOMC meeting comes at a critical juncture as investors seek clarity on the Fed's policy trajectory amid evolving economic conditions, with particular focus on how officials view inflation progress and employment trends heading into the second quarter of 2026.
The day also features Producer Price Index data for March, with both headline and core PPI readings providing fresh inflation insights just hours before the Fed announces its decision. This inflation data could influence the central bank's messaging and market reaction, especially if the numbers deviate significantly from expectations and either support or challenge the Fed's current policy stance during what promises to be a volatile trading session.
Market Sentiment and Key Levels
Bulls maintained a cautious grip on market sentiment as SPY posted a modest 0.26% gain to $670.79, though the lackluster advance suggests more consolidation than conviction despite elevated trading volume. The VIX's 4.85% drop to 22.37 reflects some easing of defensive positioning, yet the relatively muted price appreciation indicates bulls are struggling to generate meaningful upside momentum even with reduced fear levels. The $4.59 trading range between $674.44 and $669.85 shows bulls managed to defend against selling pressure but lacked the strength to sustain moves toward session highs, creating a sideways grinding action that leaves directional control somewhat uncertain.
The $674.44 session high emerges as immediate resistance that bulls tested but couldn't hold, representing a logical breakout target that would need to be reclaimed with authority to signal renewed upside momentum. A decisive push above this level could open the door to the $677-$680 zone where more substantial overhead resistance likely awaits from previous trading ranges. On the downside, the $669.85 intraday low serves as critical near-term support that held during the session's deepest probe, and defending this foundation will be essential for maintaining the current constructive tone. Any violation of $669.85 would raise concerns about underlying demand and could trigger a retest of the $665-$667 area where more significant support may emerge.
Market dynamics present a mixed backdrop that could drive price action in either direction depending on how key factors develop in coming sessions. The elevated trading volume despite modest gains suggests institutional participants are actively positioning, though whether this represents accumulation or distribution remains unclear given the narrow price range. Rising energy costs and persistent yield pressures continue creating headwinds for risk assets, while the broad market's ability to hold above recent lows indicates some resilience among buyers. A clean break above $674.44 resistance with sustained volume would tip the scales toward bulls and potentially target the upper $670s, while failure to hold $669.85 support could quickly shift sentiment and invite a test of deeper support levels around $665.
Expected Price Action
Our actionable intelligence generated by our AI model projects SPY will trade in a $660-$675 range for Wednesday, maintaining a bullish bias after Tuesday's modest advance that closed at $670.79 near the middle of the session's trading range. The $15 projected range indicates the market will trend rather than consolidate, suggesting we could see significant directional movement as traders position around key technical levels. Primary resistance emerges at the $672-$675 zone, where any sustained breakout on volume would confirm upside momentum and potentially target levels beyond the upper boundary. The model identifies critical support at the bias level around $666-$667, but weakness below this area opens downside exposure toward $665 and potentially the lower range boundary near $660.
The combination of above-average volume during Tuesday's session and VIX declining to 22.37 suggests some market tension has eased, though our model warns that energy remains inconsistent despite the constructive bias. Traders should focus on the $667 bias area as the key inflection point - sustained action above maintains the positive tone while failure below shifts momentum bearish and activates lower targets. The model specifically notes that while upward bias exists, sustained rallies require significant buying conviction given the current market structure. Any retreat toward the $666-$667 support zone presents potential entry opportunities for bullish positioning, though a decisive break below this critical threshold demands immediate risk management as sellers could establish control and drive meaningful downside pressure toward the $660 target level.
Trading Strategy
Today's modest gains with elevated participation create actionable setups around the $669-$671 support zone that emerged from this session's trading action. For bullish scenarios where buying interest continues, initiate long positions on any pullback toward $669-$670 with profit targets at $674-$675 and extended objectives near $678 if momentum carries through resistance levels. Place protective stops below $667 to limit downside exposure while allowing sufficient room for normal volatility around these technical boundaries, especially given the substantial volume that accompanied today's consolidation pattern. In bearish reversal trades, short any failure to hold above $671-$672 with downside targets toward $665-$666 and stretch goals near $660 if selling pressure emerges through the established support framework.
The VIX dropped 4.85% to 22.37, indicating reduced fear levels that support more aggressive position sizing while maintaining strict risk management discipline around key technical zones. Focus strategies on the $670-$674 range that developed from today's activity, as decisive breaks beyond these parameters could trigger meaningful moves toward $677 upside or $665 downside objectives. The coordinated strength across indices suggests genuine institutional interest rather than mere short covering, favoring broad market approaches over sector rotation strategies until this consolidation phase resolves clearly. Risk management should utilize 2-3 point stop distances from the $670-$674 decision range, which now serves as the critical battleground for determining whether recent stability marks accumulation or represents pause before potential volatility resurgence, while positioning for either continued technical progress or possible retest scenarios that could challenge foundational support if market conditions deteriorate unexpectedly.
Model’s Projected Range
SPY's projected maximum range for Wednesday is $662 to $680, with the Call side dominating in an expanding band that suggests trending price action with intermittent chop. Wednesday brings Core PPI m/m, PPI m/m, Federal Funds Rate, FOMC Economic Projections, FOMC Statement, and FOMC Press Conference, which are likely to produce significant volatility particularly just after 2 pm. SPY closed at $670.79, up 0.26%, remaining below the $685 level as bears battle the bulls for control in this two-way trading environment, with the session seeing an opening at $672.39, touching a high of $674.44 and a low of $669.85 on lower than average volume while the VIX dropped 4.85% to 22.37. SPY is trading below key support at $675 as markets digest ongoing geopolitical tensions in and their potential impact on global risk appetite. Looking ahead to Wednesday's session, our model shows resistance above at $675, $680, and $685, with support below at $665, $662, $660, and $655 - if the $675 resistance level breaks, price targets $680, while a break of $665 support would target $662, and if that lowest support at $655 breaks there is little to keep price from falling toward $650. The long-term bull trend remains intact above $640, and now that we are out of February, the market should set up for a spring and summer rally to new highs. We have stated for some time, as long as price holds above key structural levels, this remains a broader dip-buying environment. Absent a catalyst, resistance sits at $675, $680, $685, while support rests at $665, $662, $660, $655. We favor buying dips at $665 given SPY's current position in the middle of the range. Bitcoin declined 0.86% to close above $74,218 while MAG stocks showed mixed action with strength led by Alphabet up 1.75% offset by weakness in Meta down 0.76%, suggesting selective buying in mega-cap names rather than broad-based momentum. The VIX closed at 22.37, down 4.85%, suggesting a significant reduction in fear as markets digest the Fed's upcoming policy decision with less anxiety than initially expected. SPY closed near the lower end of the bull trend channel from the April lows with structural support near $667.
Market State Indicator (MSI) Forecast
Current Market State Overview:
The MSI ended Tuesday in a Ranging Market State with SPY closing at $670.79. Extended targets did not print at the close but were visible below during premarket and AM session activity. The MSI rescaled lower multiple times during the session as price declined from the morning highs, transitioning from an initial Bullish Trending state in premarket to the current narrow Ranging state with an $0.80 spread. The session began with strength in premarket but sellers gained control as the day progressed, forcing the MSI to contract into a tight consolidation zone. The MSI forecast for Wednesday calls for sideways to slightly higher action as a continuation of today's modest gains, though without extended targets at the close the move may be modest and is likely to find resistance at key levels above. MSI support is $670.57 with resistance at $671.37.
Key Levels and Market Movements:
Monday we stated, "Bulls want to hold current levels overnight and push toward $669.3," and added, "bears want to see $663.1 fail to press price toward lower levels," while also noting, "Given the current state with SPY positioned just below MSI resistance, Tuesday is likely to continue upward but find resistance at $672 and travel back toward MSI support." Tuesday's session delivered exactly what the MSI framework anticipated with a measured advance that found resistance near the projected $672 level. SPY opened at $672.39 and pushed to a session high of $674.44 in early trading, giving bulls the upward momentum they wanted from Monday's close. However, selling pressure emerged throughout the day as the MSI rescaled lower several times, taking SPY from those morning highs down to a session low of $669.85 before closing at $670.79 with a modest 0.26% gain. The session started with promise as premarket extended targets below provided clear downside risk parameters, but the early strength above $672 resistance quickly attracted sellers who maintained control through the afternoon. With the MSI transitioning from Bullish Trending in premarket to the current Ranging state, traders had clear directional signals as the framework tightened around price action. The narrow $0.80 MSI width created a tactical environment where any test of $671.37 resistance offered shorting opportunities targeting the $670.57 support level, while any dip to support presented buying setups back toward resistance. At minimum it was a two-for-two session for traders following the framework as the MSI provided multiple clean setups despite the contracting range and declining volatility. It was an easy day to read albeit not an easy day to trade given the tight choppy range that developed after the morning move. But setups were present, all identified through proper context, patience, and flexibility while leveraging the MSI, premarket levels, and market structure rather than forcing trades. The MSI continues to prove its reliability as the cornerstone of our trading process.
Trading Strategy Based on MSI:
Wednesday has heavy economic data with Core PPI, PPI, Federal Funds Rate, FOMC Economic Projections, FOMC Statement, and FOMC Press Conference which can introduce significant volatility, so traders should be ready to trade what they see rather than predict. Bulls want to hold current levels overnight and push toward $672, while bears want to see $670.57 fail to press price toward lower levels around $669. Given the Ranging Market State at close with today's modest 0.26% advance, Wednesday is likely to continue the sideways to slightly higher action from Tuesday's session. Any rally toward the $671.37 resistance level presents a potential shorting opportunity targeting the $670.57 support level, especially if the FOMC events provide selling pressure. However, if bulls can successfully reclaim and hold above $671.37 with conviction following positive Fed commentary, this would signal a potential shift back toward a more bullish stance and offer long setups back toward the $672-674 area. The current positioning within the narrow MSI range creates a tactical setup where the FOMC decision will likely determine whether price breaks above resistance or falls back toward support. A successful test and rejection at $671.37 would offer a clean short setup targeting the $670.57 support zone, while any breakthrough and hold above $671.37 with volume following dovish Fed signals presents a compelling long opportunity back toward higher levels. The Fed's decision on rates and forward guidance will be crucial in determining whether the MSI expands into a trending state or remains compressed in this tight range. Failed breakouts and breakdowns within the current narrow range are the highest probability setups, especially given the significant event risk. If the economic data provides a strong catalyst, watch for the MSI to rescale and transition to a trending state in either direction. The long-term bull trend remains intact above $640 and failed breakouts and failed breakdowns continue to offer the highest-probability setups. Remain flexible, avoid trading during Ranging Market States unless a clear failed breakout or breakdown presents itself, and ensure all trades are fully aligned with MSI signals. Providing real-time insights into market control, momentum shifts, and actionable levels, the MSI when integrated with our Pre-Market and Post-Market Reports continues to sharpen execution precision and elevate trade quality. If you haven't yet integrated MSI and our model levels into your process, now is the time. Contact your representative to get started as these tools are designed to support consistency and enhance performance.
Dealer Positioning Analysis
Dealers are selling SPY $671 to $700 and higher strike Calls, indicating the Dealers' belief that prices may trade in the current range for Wednesday. The ceiling for Wednesday appears to be $676. To the downside, Dealers are buying $669 to $575 and lower strike Puts in a 4:1 ratio to the Calls they're selling displaying moderate concern that prices could move lower. Dealer positioning is unchanged at bearish.
Looking Ahead to Next Friday:
Dealers are selling SPY $679 to $710 and higher strike Calls while buying $671 to $678 Calls, indicating the Dealers' desire to participate in any rally this week. The ceiling for the week appears to be $694. To the downside, Dealers are buying $670 to $520 and lower strike Puts in a 5:1 ratio to the Calls they're selling/buying displaying heightened concern that prices could move lower. For the week Dealer positioning is unchanged at bearish. We advise reviewing Dealer positioning daily for directional clues. These positions evolve quickly and tracking them is essential for staying ahead of shifting market sentiment.
Recommendation for Traders
With SPY closing at $670.79 after a modest 0.26% gain, traders can look for long opportunities on any dips toward the $670 support level that held today. The VIX dropping 4.85% to 22.37 shows some volatility compression, though caution remains warranted around the $674.44 resistance level established during today's session. Keep stops below $669.85 and consider modest position sizes given the elevated volume activity. Risk management stays critical with volatility still elevated despite today's VIX decline. Position sizes should remain conservative until we see sustained moves above key resistance levels. Be sure to review the premarket analysis posted before 9 AM ET for any changes in the model's outlook and Dealer Positioning.
Good luck and good trading!
