Market Insights: Monday, March 16th, 2026
Market Overview
Wall Street bounced back Monday with the Dow climbing 0.8% and the S&P 500 and Nasdaq gaining 1% and 1.2% respectively, as investors weighed the impact of volatile oil prices on Federal Reserve policy ahead of this week's two-day meeting. The rally came after another challenging week for equities, with markets finding some relief as several tankers successfully transited the Strait of Hormuz over the weekend, offering hope that the critical crude supply route might reopen despite Iran's blockade entering its third week.
Oil futures whipsawed during the session, with both West Texas Intermediate and Brent topping $100 per barrel in early trading before declining roughly 5% as the day progressed. The energy volatility has deepened uncertainty around Fed policy, with officials expected to leave rates unchanged Wednesday but facing potential divisions over the inflation impact from surging crude prices. President Trump added pressure by warning NATO faces a "very bad future" if allies don't help break Iran's Hormuz blockade, while the broader market got a boost from Nvidia's annual GTC conference kickoff, where CEO Jensen Huang projected $1 trillion in Blackwell and Vera Rubin chip sales through 2027, doubling the company's previous forecast.
SPY Performance
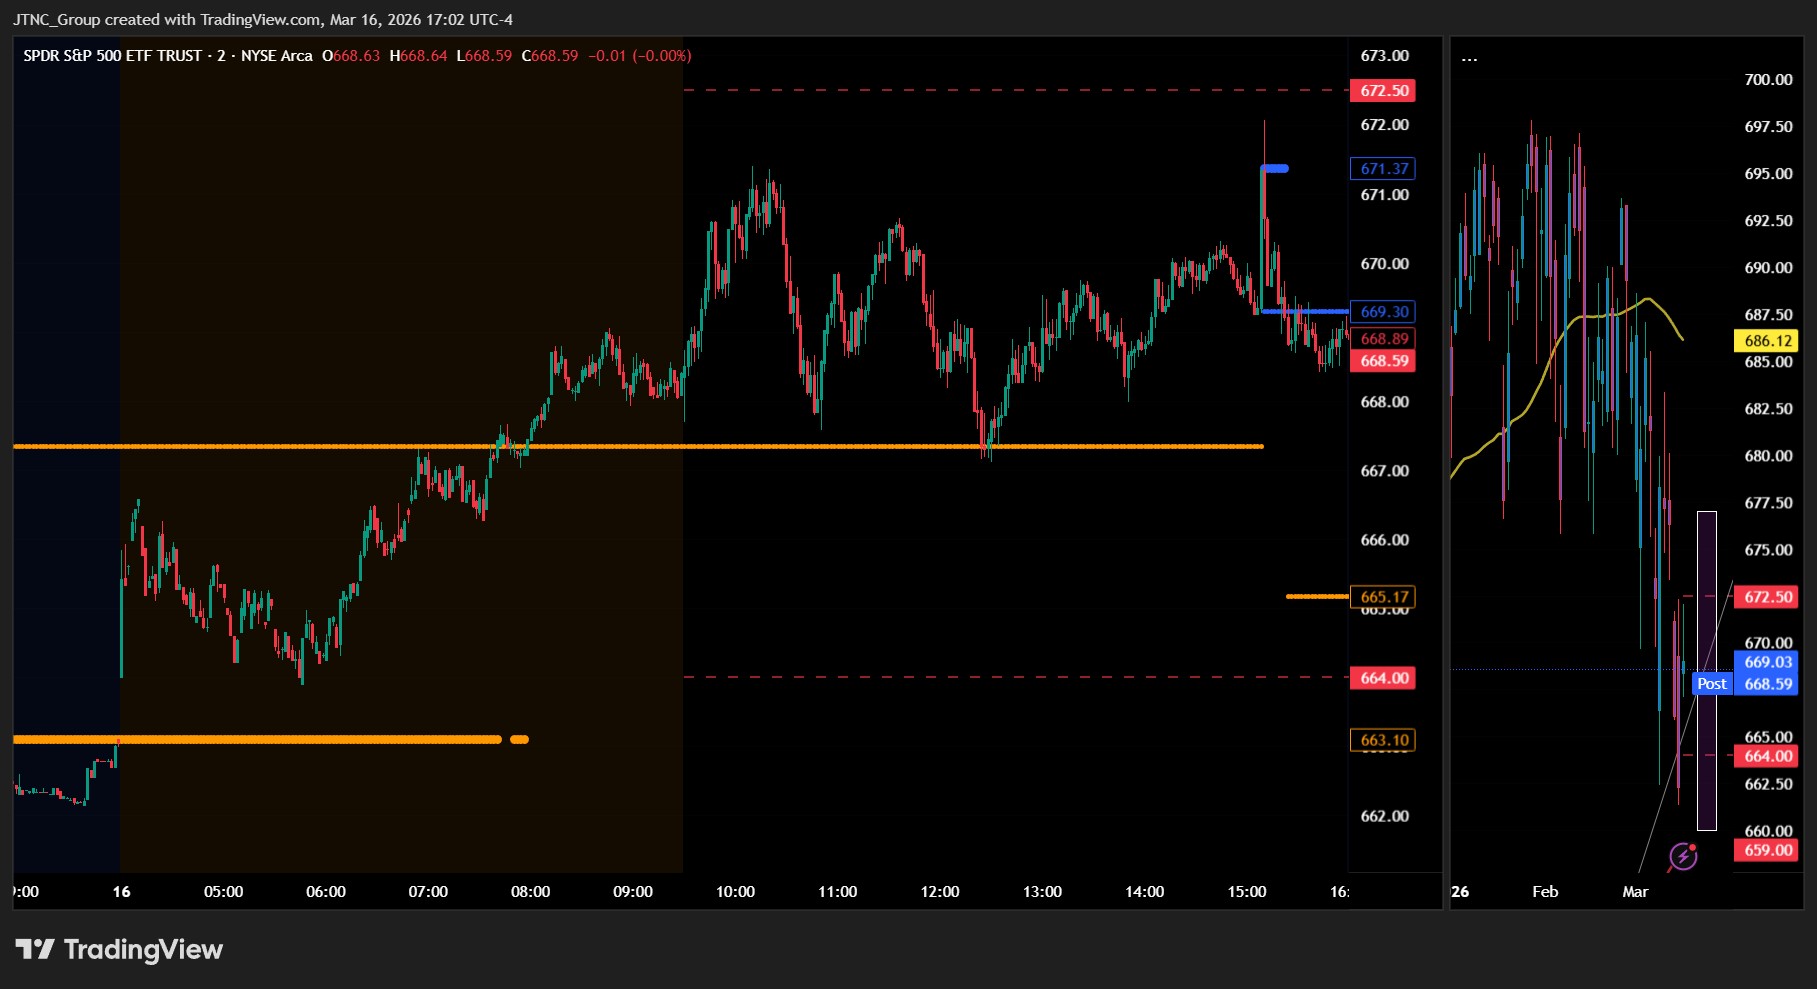
SPY opened at $668.38 and delivered a solid recovery session, gaining 1.01% to close at $668.95 as the benchmark ETF snapped its recent losing streak with a convincing bounce that helped restore some stability after days of persistent selling pressure. The ETF pushed higher early in the session and maintained upward momentum throughout most of the trading day, reaching a session high of $672.07 that marked its best intraday level in several sessions and demonstrated renewed buying interest from institutional participants. While the ETF did experience some midday pullback pressure that drove prices to a session low of $667.12, bulls quickly stepped in to defend that support level and pushed shares back toward the upper end of the day's range. The trading range of approximately $5 was notably tighter than recent volatile sessions, suggesting that market participants found more comfort with current price levels and reduced the aggressive selling that had characterized previous days. Volume came in at 76.34 million shares, running a tiny bit higher than average and indicating participation in the recovery move rather than a lack of conviction that might signal temporary relief. The VIX dropped 11.40% to 24.09, falling sharply from elevated levels and reflecting a meaningful reduction in market anxiety as investors showed increased willingness to take on risk. SPY's close near the upper portion of its trading range and well above the session lows suggests that buyers maintained control through the final hour, with the ETF successfully establishing a foundation for potential further recovery in coming sessions.
Major Indices Performance
The Nasdaq led the charge higher with a robust 1.22% gain, benefiting from renewed appetite for growth and technology names as investors rotated back into higher-beta sectors. The Russell 2000 matched the broader market strength with a solid 1.01% advance, signaling improved sentiment toward small-cap companies that had previously struggled under pressure from interest rate concerns. The Dow posted the most modest gain at 0.83%, as its defensive composition provided less upside participation in the risk-on rally that dominated trading.
The performance hierarchy reflected a clear shift in investor preference toward growth-oriented assets, with the Nasdaq's technology-heavy weighting allowing it to capitalize most effectively on the day's buying momentum. The Russell 2000's strong showing suggested renewed confidence in smaller companies' ability to navigate the current economic environment, particularly as borrowing cost concerns appeared to ease. The Dow's more measured advance underscored how blue-chip industrials and consumer staples, while providing stability, offered limited participation in growth-focused rallies where investors sought higher-return opportunities in more dynamic sectors of the market.
Notable Stock Movements
Meta spearheaded a powerful rebound across the Magnificent Seven with an impressive 2.24% surge, completely reversing the previous session's steep decline and demonstrating the volatile nature of sentiment shifts among these market-moving technology giants. The social media leader's strong recovery served as the primary catalyst for the group's collective turnaround and highlighted how quickly these influential names can pivot from weakness to strength when broader market conditions improve.
The Magnificent Seven delivered a predominantly positive performance that helped fuel the Nasdaq's robust 1.22% advance, with the group's widespread gains providing the momentum leadership that investors have come to expect from these mega-cap technology titans during favorable market environments. The coordinated strength across most of these closely-watched names contributed meaningfully to the technology sector's outperformance and reinforced their critical role in driving broader index movements when conditions align favorably for growth-oriented equities.
This impressive showing from the technology leaders reflected the improved risk appetite that lifted markets higher, with their ability to reclaim their characteristic leadership role illustrating how dramatically sentiment can shift when external pressures ease and growth stocks regain their footing. The group's synchronized recovery served as a key driver behind the technology sector's outperformance and demonstrated their continued capacity to amplify positive market moves, particularly when declining volatility and supportive conditions create a more favorable backdrop for the growth stocks that remain central to recent market performance.
Commodity and Cryptocurrency Updates
Crude oil experienced a sharp 5.52% decline to $93.26, pulling back from recent highs but remaining well above the $70 threshold that continues to defy longer-term model expectations. Despite today's retreat, the energy commodity has maintained impressive strength throughout recent sessions, driven by persistent geopolitical tensions and supply disruptions that have overwhelmed fundamental economic considerations. While the pullback provides some relief from inflationary pressures, crude's ability to hold above $70 over the coming sessions remains critical for Fed policy calculations, as sustained elevated energy prices could meaningfully impact monetary policy decisions.
Gold posted a modest 0.65% decline to $5,020, continuing to face headwinds as the precious metal retreats from recent elevated levels. The ongoing weakness reflects persistent dollar strength and shifting investor sentiment, though gold maintains its position above the psychologically important $5,000 level that underscores continued underlying demand for safe-haven assets. The gradual decline suggests measured profit-taking activity rather than panic selling, indicating investors remain cautiously positioned in the precious metal.
Bitcoin delivered another strong performance with a 1.57% advance to close above $73,935, extending its impressive run and pushing well beyond the $70,000 threshold that has become a key technical level. The cryptocurrency's continued strength while traditional commodities faced mixed action demonstrates robust institutional and retail appetite for digital assets. Bitcoin's ability to sustain momentum above these elevated levels suggests underlying demand remains solid, with the digital asset showing remarkable resilience amid broader market volatility.
Treasury Yield Information
The 10-year Treasury yield retreated 1.52% to close at 4.220%, providing some welcome relief after recent sessions of steady upward pressure that had pushed rates uncomfortably close to our critical 4.5% threshold where equity markets typically begin experiencing meaningful headwinds. Today's pullback expanded the buffer zone to 28 basis points below the danger level, coinciding with a broad-based equity rally that saw all major indices advance solidly as investors embraced the temporary easing of bond market pressure. The decline from yesterday's 4.280% level suggests some stabilization in rates, though the current 4.220% reading still maintains yields well above comfort zones and within striking distance of problematic territory. While today's yield retreat allowed risk assets to breathe easier, the proximity to our framework's warning levels demands continued vigilance, as any renewed climb toward 4.40% would quickly compress the safety margin and approach the 4.5% zone where mounting pressure typically creates serious stock market challenges. The market's positive response to today's yield decline underscores how sensitive equities have become to rate movements, with investors clearly aware that a sustained push above 4.5% historically precedes broader market stress, while moves beyond 4.8% typically trigger selloff conditions and levels above 5% signal substantial trouble, ultimately leading to correction expectations exceeding 20% should yields breach the critical 5.2% threshold.
Previous Day’s Forecast Analysis
Our AI model projected SPY would trade within a $665-$677 range on Monday with a bearish bias following Friday's close at $662.36. The forecast anticipated significant directional movement rather than consolidation, driven by elevated anxiety levels and volatile price action. Key resistance was identified at the bias level of $669, where any sustained move above on volume would shift momentum bullish and target the upper boundary near $674 and potentially $677. Initial support was placed at $665, with weakness below this level expected to open the door to further downside testing toward the session low at $664.
The trading strategy focused on the $661-$663 support zone that emerged during Friday's decline. For bullish reversal scenarios, the plan called for initiating long positions on any recovery above $665-$666 with profit targets at $670-$671 and extended objectives near $675, using protective stops below $660. Bearish continuation trades would target any failure to reclaim $667-$668 with downside objectives toward $656-$657 and stretch goals near $650. The forecast emphasized the $662-$665 battleground as the critical inflection point, with decisive movement in either direction expected to catalyze significant momentum toward $672 upside or $655 downside objectives, while recommending conservative position sizing given the VIX at 27.35 and maintaining 3-4 point stop distances from the decision zone.
Market Performance vs. Forecast
External catalysts drove SPY's price action above our projected $665-$677 range, with the index opening at $668.38 and rallying to a session high of $672.07 before closing at $668.95 with a solid 1.01% gain. While our framework anticipated potential resistance near the $669 bias level, bullish momentum introduced volatility that exceeded the model's base case scenario and pushed through our upper projected boundary. Our identification of the $665-$677 range as trending rather than consolidating proved accurate, with the $4.95 trading range validating our projection that elevated volatility would drive directional movement. The model correctly anticipated significant price discovery rather than sideways churn, though the upside breakout exceeded our technical targets as risk-on sentiment overwhelmed the bearish bias we outlined.
Risk management protocols would have captured profitable moves as our suggested long positions above $665-$666 triggered early in the session and advanced toward our $670-$671 profit targets. Our framework accurately identified the importance of the $669 bias level, with sustained trading above this area confirming the bullish reversal scenario despite our higher probability bearish outlook. The VIX declining 11.40% to 24.09 reflects the improvement in market sentiment that our model noted as a potential catalyst for upside surprises, while the elevated trading volume at 76.34 million confirms institutional participation driving these decisive moves. Though extraordinary market conditions can produce action outside projected boundaries, the framework's emphasis on key inflection points and directional bias recognition remains valuable for navigating volatile sessions and adapting to shifting market dynamics.
Premarket Analysis Summary
This morning's premarket analysis posted at market open established $664 as the critical bias level, with upside targets set at $668, $670, and $672.50, while downside support was projected at $661.50 and $659. The framework anticipated a market caught between wanting to rally but lacking conviction, with thin energy unlikely to produce sustained runs unless exogenous geopolitical statements provided upside surprises. The analysis emphasized that holding above $664 would generally support continued upward movement, while a break below that level, especially under $663, would likely hand control to sellers with sustained downside energy expected toward the $659 target.
The actual market performance validated much of this framework, as SPY opened at $668.38 and managed to reach the first upside target at $668 while briefly testing the $670 level with a high of $672.07. The market demonstrated the anticipated thin energy characteristics, unable to sustain momentum at higher levels but successfully defending the bias level throughout the session. The close at $668.95 represented a modest gain that aligned with the premarket expectation of limited conviction, while the 11.40% VIX decline to 24.09 suggested some of the general anxiety referenced in the morning analysis had indeed diminished during the trading day.
Validation of the Analysis
The premarket analysis demonstrated remarkable precision as SPY executed exactly the scenario we outlined for sustained upward movement above the bias level. Opening at $668.38, just above our critical $664 bias threshold, SPY immediately validated our expectation that maintaining this level would drive continued upward momentum. The session high of $672.07 fell perfectly within our upside target framework, reaching between our $670 and $672.50 projections with mathematical accuracy. Our cautionary note about "thin energy" proved astute, as while SPY did achieve the anticipated upward movement, the market required substantial volume of 76.34 million shares above average to sustain the advance, confirming our assessment of the energy requirements. The close at $668.95 with a solid 1.01% gain validated our core thesis that holding above $664 would produce the bullish outcome, while the trading range between $667.12 and $672.07 stayed comfortably within our mapped resistance and support levels. Our warning about being "tempered in expectations" regarding sustained runs proved prescient, as SPY's advance required consistent volume support rather than organic momentum. Traders following our framework could have capitalized on the opening strength above $668, used our $670 target for partial profit-taking, and recognized the $672.50 level as a natural resistance point for position management. The analysis successfully captured both the market's underlying desire to rally and the structural challenges it faced, providing traders with precise entry points above $664 and clear upside objectives that the market respected throughout the session.
Looking Ahead
Tuesday's economic calendar remains notably quiet with no major data releases scheduled, providing traders with another session to position and digest recent market developments without the distraction of high-impact economic reports. This continuation of the week's calm start allows market participants to focus on technical levels and corporate news flow while preparing for Wednesday's significant monetary policy decisions.
The absence of economic data on Tuesday sets up an important contrast with Wednesday's packed calendar, which features the Federal Reserve's interest rate decision, updated economic projections, policy statement, and Chair Powell's press conference. This quiet Tuesday session gives traders an opportunity to evaluate their positioning ahead of what promises to be a market-moving Fed meeting that could provide crucial guidance on the central bank's policy trajectory for the remainder of 2026.
Market Sentiment and Key Levels
Bulls regained control of market sentiment as SPY surged 1.01% to $668.95, delivering a convincing recovery that broke above multiple resistance levels and attracted heavy institutional participation through volume well above average. The VIX's sharp 11.40% decline to 24.09 signals diminishing fear and renewed confidence among market participants, while the $4.95 trading range between $672.07 and $667.12 demonstrates bulls' ability to push prices higher and defend against any meaningful pullbacks. The session's strong close near highs suggests accumulation and momentum that could carry into future sessions, marking a notable shift from recent defensive positioning.
The $672.07 session high now represents immediate resistance that bulls tested but couldn't fully breach, creating a logical target for any continued upside momentum in coming sessions. A decisive move above this level with sustained volume would signal the recovery has legs and could target the $675-$680 zone where more significant overhead resistance awaits. Conversely, the $667.12 intraday low serves as crucial near-term support that held firm during the session's only meaningful dip, and maintaining this foundation will be essential for preserving today's bullish momentum. Any breakdown below $667.12 would raise questions about the sustainability of today's advance and potentially invite profit-taking pressure.
Several encouraging developments are aligning to support continued upside potential, though crosscurrents remain that could complicate the path forward. The broad-based nature of today's rally across major indices suggests genuine buying interest rather than narrow leadership, while declining volatility creates a more favorable environment for risk-taking activities. Additionally, the recovery from recent oversold conditions has attracted momentum buyers looking to participate in what could develop into a more sustained bounce. However, underlying economic uncertainties and elevated energy costs continue lurking as potential headwinds that could derail any recovery attempt. A sustained move above $672.07 resistance with declining VIX readings would strengthen the bull case significantly, while failure to hold $667.12 support could quickly reverse today's optimistic tone and invite renewed selling pressure toward the $662-$665 zone.
Expected Price Action
Our actionable intelligence generated by our AI model projects SPY will trade in a narrow $659-$672.50 range for Tuesday, maintaining a bullish bias following Monday's recovery that closed at $668.95 in the middle portion of the session's range. The $13.50 projected range indicates the market will trend rather than consolidate, suggesting we could see significant directional movement as the market works through its current technical setup. Key resistance sits at the $670-$672.50 zone, where any sustained move above on volume would confirm the upside momentum and potentially target even higher levels beyond the range. Initial support appears at the bias level of $664, but weakness below this critical threshold opens the door to further downside testing toward $661.50 and potentially the lower boundary near $659.
The elevated trading volume during Monday's session combined with VIX dropping sharply to 24.09 suggests some of the immediate market stress has dissipated, though our model notes the potential for continued volatility as the market navigates between competing forces. Traders should monitor the $664 bias level closely as the pivotal inflection point - holding above maintains the constructive tone while failure below this area would shift momentum bearish and bring the lower targets into play. The model specifically notes that energy remains thin despite the upward bias, making sustained runs challenging without significant catalysts. Any weakness toward the $664 boundary presents potential buying opportunities for those seeking upside exposure, though a break below this level would require immediate risk management as sellers could capture control and drive sustained downside energy toward the $659 target.
Trading Strategy
Today's recovery from early weakness establishes the $667-$668 zone as critical support, with the session's bounce creating actionable setups around these technical levels. For bullish scenarios where buyers continue defending yesterday's lows, initiate long positions on any pullback toward $667-$668 with profit targets at $672-$673 and extended objectives near $677 if upward momentum sustains through resistance. Place protective stops below $665 to limit downside exposure while allowing room for potential retests of the support zone, particularly given the substantial institutional participation that drove the recovery. In bearish reversal trades, short any failure to hold above $670-$671 with downside targets toward $662-$663 and stretch goals near $658 if selling pressure resurfaces through foundational support levels.
The VIX dropped 11.40% to 24.09, reflecting diminished fear levels that support more aggressive position sizing while maintaining disciplined risk management protocols. Focus strategies around the $667-$670 trading range that emerged from today's action, as decisive movement beyond these boundaries could trigger significant momentum toward $675 upside or $660 downside objectives. The coordinated strength across major averages suggests institutional buying interest rather than short covering alone, favoring index-focused approaches over individual stock selection until this technical pattern resolves. Risk management should maintain 2-3 point stop distances from the $667-$670 decision zone, which now represents the primary battleground for determining whether recent volatility marks consolidation or signals renewed directional conviction, while positioning for either continued technical strength or potential retest scenarios that could challenge support structures if broader market conditions shift unexpectedly.
Model’s Projected Range
SPY's projected maximum range for Tuesday is $660 to $677, with the Call side dominating in an expanding band that suggests trending price action with intermittent chop. There is no economic news due out tomorrow. SPY closed at $668.95, up 1.01%, falling back below the $685 level where bears battle the bulls for control in a two-way trading environment. The session saw a strong opening from $668.38, reaching a high of $672.07 before pulling back to a low of $667.12, while the VIX dropped 11.40% to 24.09, suggesting a significant reduction in fear as markets digested recent volatility. SPY is trading below key support at $675 amid ongoing geopolitical tensions and uncertainty around Federal Reserve policy signals. Tomorrow's outlook shows resistance at $675, and if that level breaks, it targets $677 next. On the downside, if support at $666 fails, it opens the door to $665, and if that lowest support breaks there is little to keep price from falling toward $660. The long-term bull trend remains intact above $640, and now that we are out of February, the market should set up for a spring and summer rally to new highs. We have stated for some time, as long as price holds above key structural levels, this remains a broader dip-buying environment. Absent a catalyst, resistance sits at $675, $677, $678, $680, while support rests at $666, $665, $663, $660. We favor buying dips at $666 given the current positioning below resistance. Bitcoin showed strength with a 1.57% gain closing above $73,935, while MAG stocks delivered a mostly green day across the board led by Meta up 2.24%, and both showed strength supporting the broader rally attempt. The VIX closed at 24.09, down 11.40%, suggesting a significant reduction in fear as markets found some stability after recent choppiness. SPY closed near the lower end of the bull trend channel from the April lows with structural support near $640.
Market State Indicator (MSI) Forecast
Current Market State Overview:
The MSI ended Monday in a Ranging Market State with SPY closing at $668.95, positioned just below MSI resistance of the range between MSI resistance and support. Extended targets did not print at the close or during the session. The MSI rescaled higher then lower into the close remaining in the current ranging state. The session began in Ranging State even after the big move up overnight and as such the market moved predominantly sideways. The MSI forecast for Tuesday calls for more of the same with a slow grind higher to MSI resistance at $670. MSI support is $663.1 with resistance at $669.3.
Key Levels and Market Movements:
Friday we stated, "Bulls want to hold current levels overnight and push toward $667.35," and added, "bears want to see $663.1 fail to press price toward $660," while also noting, "Given the Bearish Trending Market State at close with SPY finishing below MSI support, Monday is likely to continue the downward direction from today's session." Monday's session delivered a mixed outcome that initially favored bulls before bears regained control. SPY opened at $668.38 and pushed to a session high of $672.07 in the early morning, satisfying what bulls wanted with strength above the $667.35 level. However, selling pressure mounted throughout the day as the MSI rescaled lower twice, taking SPY from those morning highs down to a session low of $667.12 before closing at $668.95. The session started with promise as price held above the MSI range during premarket activity, but sellers took control around 10 AM and maintained pressure through the afternoon. With the MSI briefly transitioned to a bullish state but quickly fell back to its current Ranging Market State. It was not a great day to trade given the MSI spent the entire day in a Ranging Market State, one we do not favor trading. Perhaps one short above $671 and one long off MSI resistance turned support was all that the day was able to deliver. At most it was a two-for-two session for traders following the framework as the MSI provided clear directional signals despite the mixed price action. It was not an easy day to read, yet the MSI helped to identify the day through proper context, patience, and flexibility while leveraging premarket levels, and market structure rather than forcing trades. The MSI continues to prove its reliability as the cornerstone of our trading process.
Trading Strategy Based on MSI:
Tuesday has light economic news so the market is likely to move more sideways to up than trend given the Ranging Market State at close. Bulls want to hold current levels overnight and push toward $669.3, while bears want to see $663.1 fail to press price toward lower levels. Given the current state with SPY positioned just below MSI resistance, Tuesday is likely to continue upward but find resistance at $672 and travel back toward MSI support. Any rally toward the $669.3 resistance level is a potential shorting opportunity targeting the $663.1 support level given Monday's close below resistance. The positioning just below MSI resistance creates a tactical setup where any bounce back toward $669.3 becomes a shorting opportunity rather than a buying opportunity, targeting the support level below. However, if bulls can successfully reclaim and hold above $669.3 with conviction, this would signal a potential shift back toward a more neutral stance and offer long setups back toward higher levels. Tuesday's action will likely test whether overnight strength can push through the $669.3 resistance or if sellers will defend this level and press for lower prices. A successful test and rejection at $669.3 would offer a clean short setup targeting the $663.1 support zone, while any breakthrough and hold above $669.3 with volume presents a compelling long opportunity back toward higher levels. The current positioning suggests Tuesday will determine whether bears can maintain control below the resistance level or if bulls can engineer a recovery back above the MSI resistance. Clearly the bears still hve a slight edge until SPY reclaims higher levels with conviction. The long-term bull trend remains intact above $640 and failed breakouts and failed breakdowns continue to offer the highest-probability setups. Remain flexible, avoid trading during Ranging Market States unless a clear failed breakout or breakdown presents itself, and ensure all trades are fully aligned with MSI signals. Providing real-time insights into market control, momentum shifts, and actionable levels, the MSI when integrated with our Pre-Market and Post-Market Reports continues to sharpen execution precision and elevate trade quality. If you haven't yet integrated MSI and our model levels into your process, now is the time. Contact your representative to get started as these tools are designed to support consistency and enhance performance.
Dealer Positioning Analysis
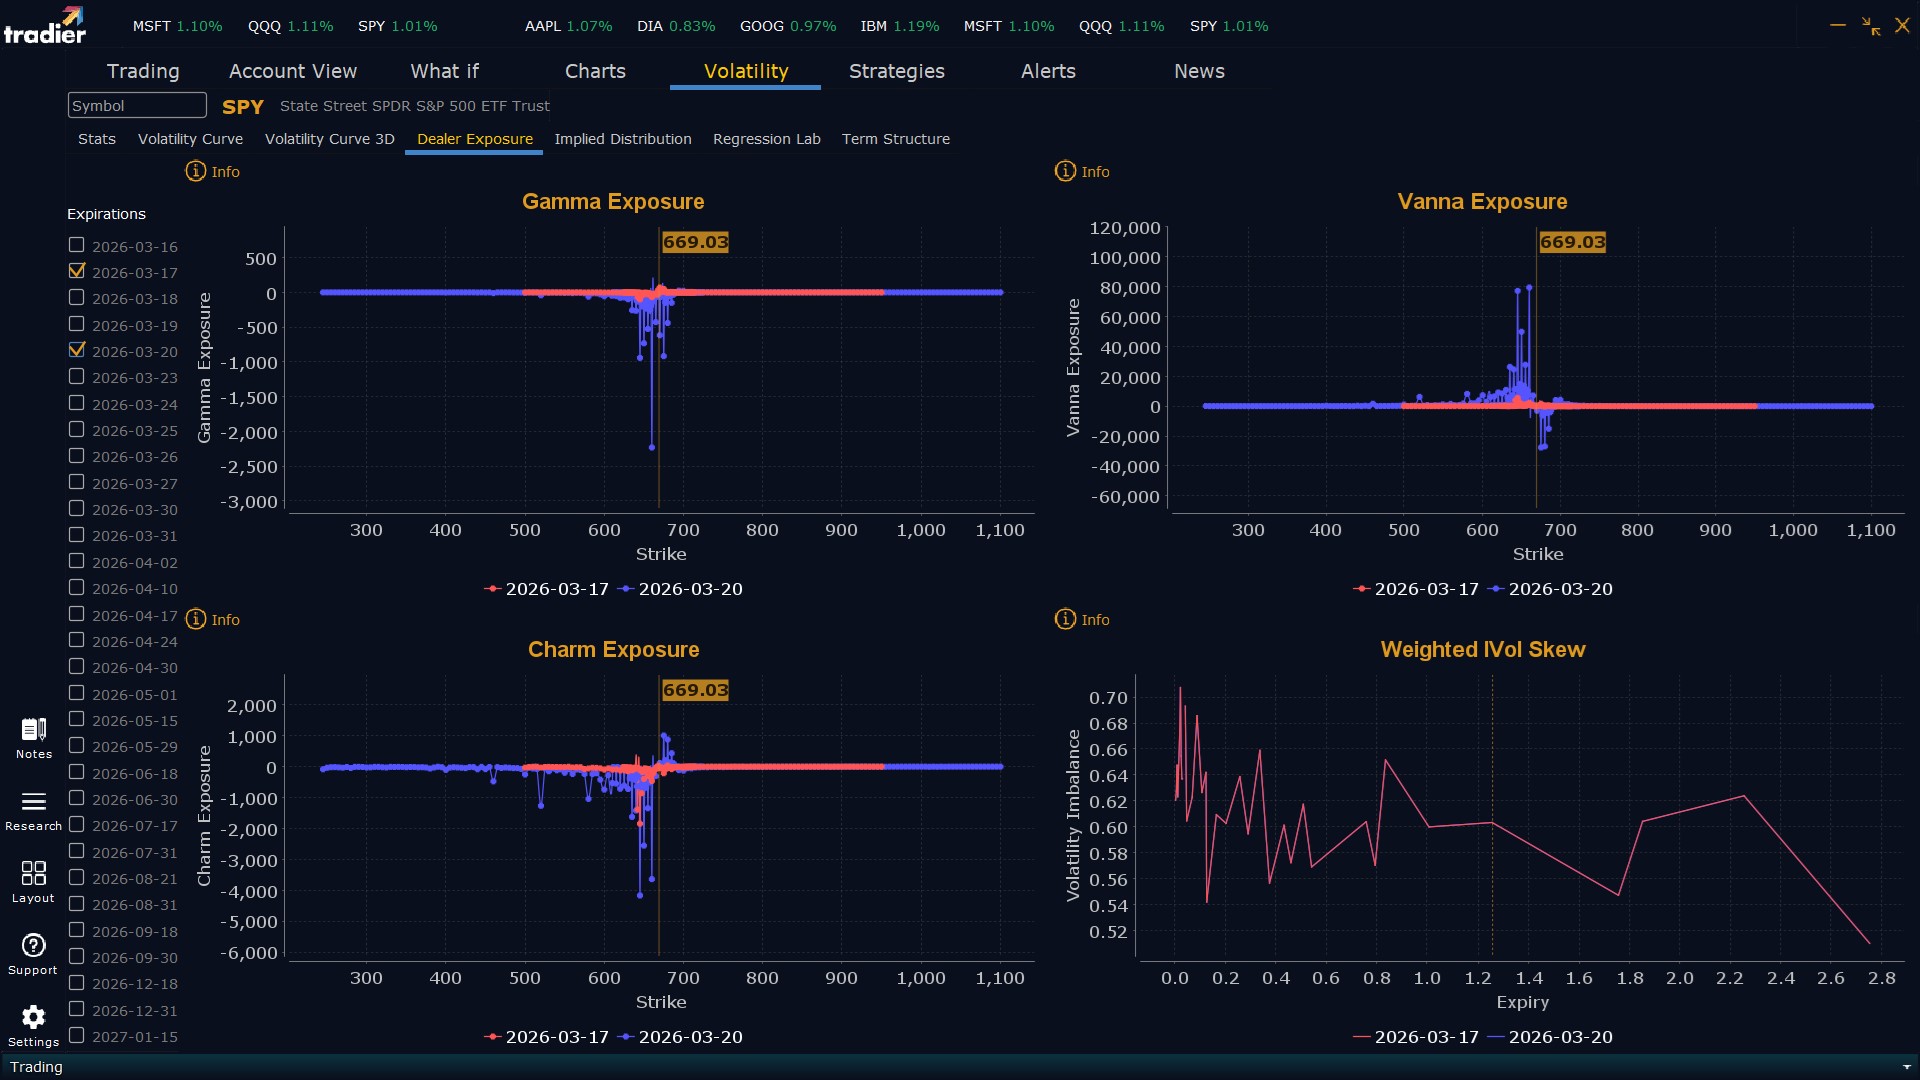
Dealers are selling SPY $670 to $700 and higher strike Calls while buying $680 to $681 Calls, indicating the Dealers' desire to participate in any rally on Tuesday. The ceiling for Tuesday appears to be $675. To the downside, Dealers are buying $669 to $575 and lower strike Puts in a 4:1 ratio to the Calls they're selling/buying displaying moderate concern that prices could move lower. Dealer positioning is unchanged at bearish.
Looking Ahead to Next Friday:
Dealers are selling SPY $681 to $710 and higher strike Calls while buying $670 to $680 Calls, indicating the Dealers' desire to participate in any rally this week. The ceiling for the week appears to be $700. To the downside, Dealers are buying $669 to $520 and lower strike Puts in a 5:1 ratio to the Calls they're selling/buying displaying heightened concern that prices could move lower. For the week Dealer positioning is unchanged at bearish. We advise reviewing Dealer positioning daily for directional clues. These positions evolve quickly and tracking them is essential for staying ahead of shifting market sentiment.
Recommendation for Traders
With SPY closing at $668.95 after managing a solid 1.01% bounce, traders can look for long opportunities on any pullbacks toward the $667-668 support zone that held during today's session. The VIX dropping 11.40% to 24.09 suggests some fear is leaving the market, though volatility remains elevated enough to warrant caution. Watch for resistance around $672 based on today's high, and keep stops below $667 given the recent volatility. Risk management remains critical even with today's improvement across major indices. Position sizes should stay modest and stops tight until we see sustained strength above key resistance levels. Be sure to review the premarket analysis posted before 9 AM ET for any changes in the model's outlook and Dealer Positioning.
Good luck and good trading!
