Market Insights: Friday, March 13th, 2026
Market Overview
Stocks gave back early gains to finish lower Friday, marking the third straight week of losses as investors grappled with sticky inflation readings and surging oil prices from the ongoing Middle East conflict. The Dow slipped 0.3%, while the S&P 500 turned 0.6% lower and the Nasdaq fell almost 1%. The selloff intensified concerns about Federal Reserve policy as traders scaled back bets on rate cuts this year, with a 99% chance now priced in for the central bank to hold rates steady at next week's meeting.
Economic data painted a mixed picture that reinforced the Fed's cautious stance, with January PCE inflation rising 0.3% monthly while core PCE climbed 0.4%, both before the war began. Fourth quarter GDP growth was revised sharply lower to just 0.7% from the previous 1.4% reading, highlighting the economy's deceleration even as March consumer sentiment hit its lowest level this year. Oil markets remained volatile with West Texas Intermediate futures gaining 2% to $98 per barrel and Brent crude moving back above $100, driven by the near-standstill in Strait of Hormuz traffic where only 77 vessels passed through in the first 11 days of March compared to nearly 1,300 during the same period last year. Boeing shares bucked the downtrend with a 2.5% gain after reports suggested delays from Max jet defects may not be as severe as initially feared.
SPY Performance
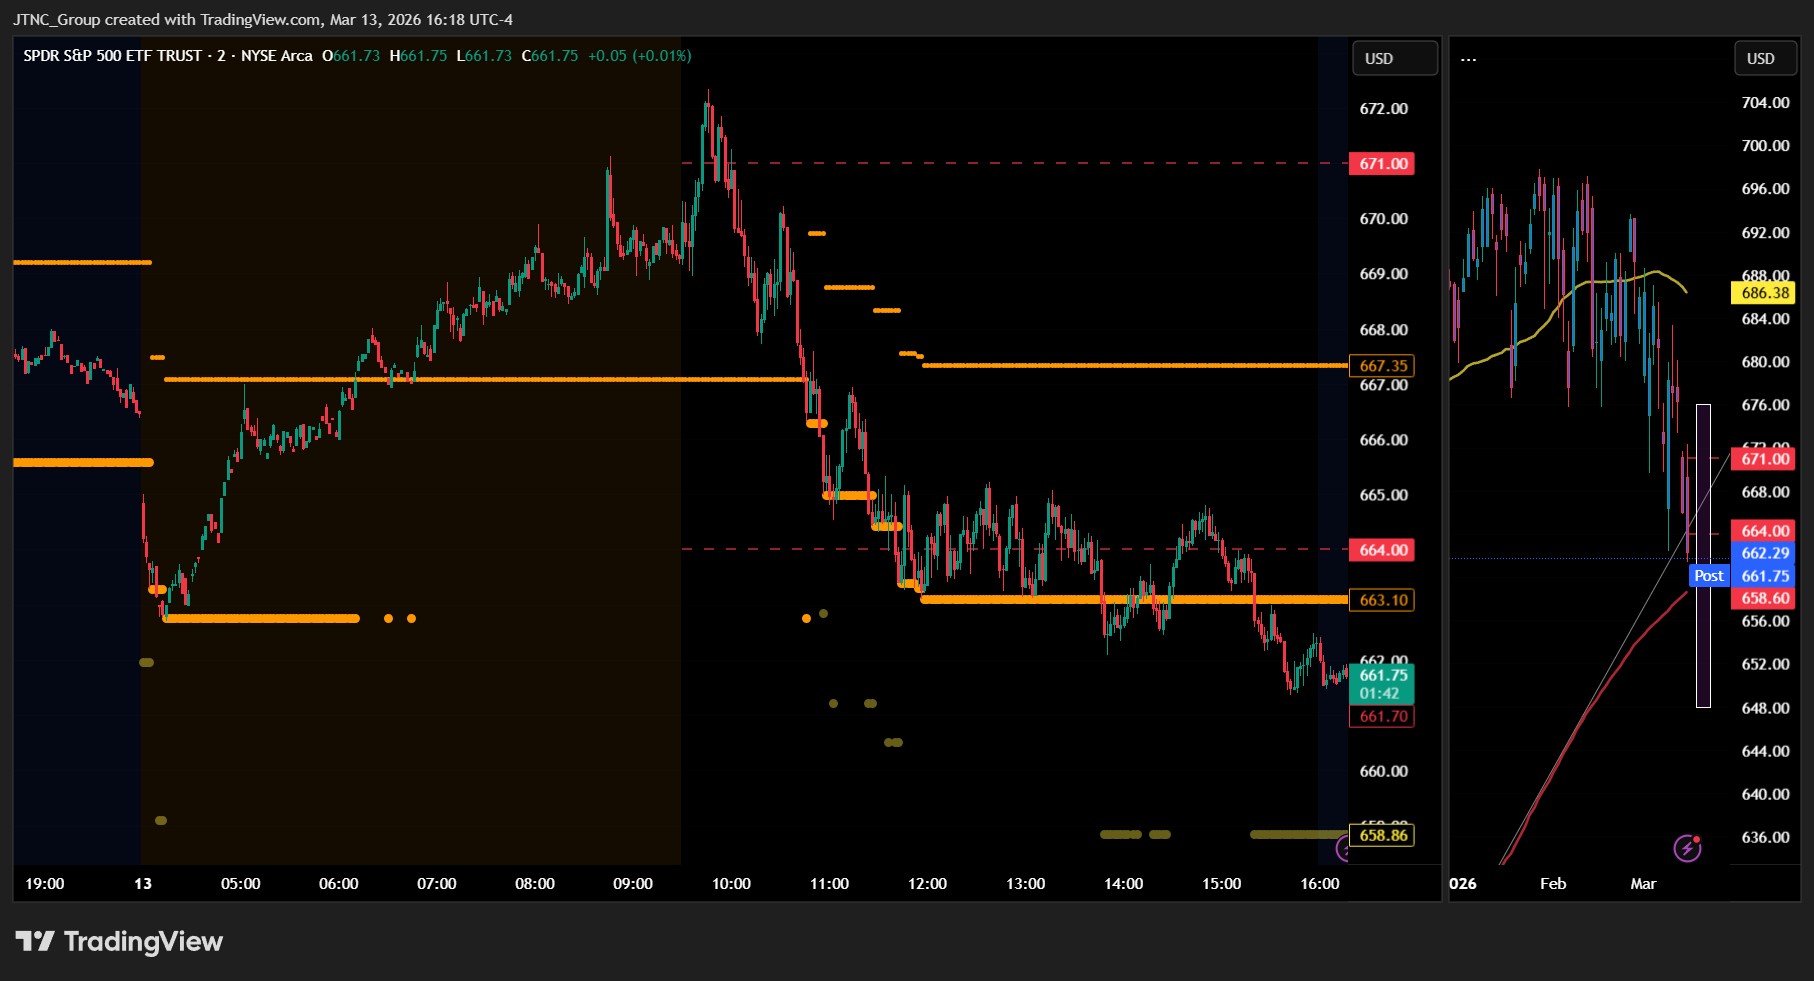
SPY opened at $669.27 and experienced volatile trading throughout the session, ultimately declining 0.56% to close at $662.36 as the benchmark ETF extended its recent weakness with another down day that tested lower support zones. The ETF managed to push higher during early trading, reaching a session high of $672.34 that represented a modest recovery attempt from the prior day's selling, but bulls failed to sustain the momentum as renewed selling pressure emerged and drove prices steadily lower through the afternoon. The downward move accelerated during the final hours of trading, with SPY touching an intraday low of $661.36 and creating a substantial trading range of nearly $11 that highlighted the market's continued uncertainty and inability to establish a stable direction. This latest decline extends the recent pattern of lower highs and lower lows, as the ETF continues to work through technical support levels that have been under pressure in recent sessions. Volume reached 83.07 million shares, running above average levels and indicating that institutional participants remained engaged in the selling rather than stepping back from the market during the volatility. The VIX edged 0.22% higher to 27.35, maintaining elevated levels that reflect persistent anxiety among market participants as the selling pressure shows little sign of abating. SPY's close well below the session midpoint and near the day's lows suggests that bears maintained control through the final trading hour, with limited evidence of meaningful buying interest emerging even at these lower price levels.
Major Indices Performance
The Nasdaq suffered the steepest decline among major indices, falling 0.93% as technology stocks faced renewed selling pressure despite recent attempts at stabilization. The Russell 2000 posted a 0.58% loss, with small-cap stocks continuing to struggle under the weight of persistent concerns about higher borrowing costs and their impact on growth prospects for smaller companies. The Dow Jones demonstrated relative resilience with only a 0.26% decline, as defensive blue-chip names provided some cushion against the broader market weakness.
The divergent performance across indices revealed a familiar pattern of sector rotation and risk-off sentiment, with the Nasdaq's technology-heavy composition making it most vulnerable to the day's selling pressure. The Russell 2000's moderate decline suggested some stabilization among small-caps after recent volatility, though these names remain sensitive to any shifts in monetary policy expectations. Meanwhile, the Dow's outperformance highlighted how dividend-paying industrials and consumer staples continue to attract defensive flows during periods of market uncertainty, with investors gravitating toward established companies with stronger cash flows and more predictable earnings streams.
Notable Stock Movements
Meta delivered the most significant blow to the Magnificent Seven with a steep 3.83% decline, leading a broadly negative session for the technology giants that reinforced the challenging environment facing growth-oriented equities. The social media leader's substantial retreat served as the primary drag on the influential cohort and highlighted how quickly sentiment can deteriorate among these market-moving names when broader conditions create headwinds for the sector's momentum.
The Magnificent Seven posted a predominantly disappointing performance that amplified the technology sector's struggles, with the group's collective weakness contributing meaningfully to the Nasdaq's 0.93% decline and demonstrating their outsized influence on index performance during periods of market stress. The widespread red across these mega-cap leaders helped accelerate the broader equity retreat and underscored the interconnected nature of these closely-watched names when external pressures create unfavorable conditions for growth stocks.
This lackluster showing from the technology titans reflected the broader risk-averse sentiment that pressured markets, with their inability to provide their typical leadership characteristics illustrating how challenging the environment had become across the equity landscape. The group's synchronized weakness served as a key catalyst behind the technology sector's underperformance and demonstrated how these influential companies can amplify market moves in both directions, particularly when rising yields and other external factors create headwinds for the growth stocks that have driven recent market gains.
Commodity and Cryptocurrency Updates
Crude oil extended its impressive rally with another 2.49% gain to $98.11, continuing to surge well beyond the $70 threshold and completely defying longer-term model expectations that had anticipated movement toward $60. This sustained strength above $70 is being driven by persistent geopolitical tensions and supply concerns that are overwhelming fundamental economic factors. The energy commodity's ability to maintain these elevated levels poses increasing risks to Fed policy calculations, as continued strength could meaningfully contribute to inflationary pressures and potentially force central bank officials to reconsider their monetary approach amid an already complex economic landscape.
Gold faced additional selling pressure with a 1.80% decline to $5,024, extending recent weakness as the precious metal continues to retreat from elevated levels. The ongoing pullback reflects multiple headwinds including dollar dynamics and shifting investor sentiment, though gold remains positioned at historically significant levels that underscore persistent underlying demand for safe-haven assets. The decline suggests continued profit-taking activity as market participants reassess allocations amid current volatility.
Bitcoin posted a solid 0.95% advance to close above $71,166, demonstrating continued strength and pushing further above the psychologically important $70,000 threshold. The cryptocurrency's ability to extend gains while broader markets faced selling pressure highlights ongoing institutional and retail appetite for digital assets. Bitcoin's steady upward momentum suggests underlying demand remains robust, with the digital asset showing resilience even as traditional markets grapple with uncertainty across multiple sectors.
Treasury Yield Information
The 10-year Treasury yield advanced 0.28% to settle at 4.280%, marking another step higher in what's becoming a concerning pattern of steady rate increases that continues to push yields dangerously close to levels that historically spell trouble for equity markets. This modest but persistent climb leaves rates just 22 basis points shy of our critical 4.5% threshold, where mounting pressure typically begins to create serious headwinds for stocks. Today's yield advance coincided with broad-based equity weakness across all major indices, suggesting the bond market's relentless march higher is already beginning to weigh on risk appetite as investors grapple with the implications of tightening financial conditions. The current 4.280% level maintains a narrow buffer below immediate danger territory, but the steady upward momentum over recent sessions has compressed the safety margin to uncomfortable levels. Should yields continue their methodical climb toward 4.40%, markets would rapidly approach the problematic 4.5% zone where our framework anticipates meaningful equity pressure, with increasingly severe consequences awaiting at higher thresholds including selloff conditions above 4.8%, substantial market trouble beyond 5%, and expectations for corrections exceeding 20% if rates breach the historically ominous 5.2% level that typically signals major drawdowns ahead.
Previous Day’s Forecast Analysis
Our prior day's forecast projected SPY would trade in a $665-$678 range with a bearish bias following Thursday's sharp decline that closed at $666.04. The model anticipated a $13 projected range indicating trending rather than consolidating behavior, suggesting significant directional movement would emerge as the elevated volatility environment continued driving price discovery. Key resistance was identified at the bias level of $672, where sustained moves above on volume would shift momentum bullish and target the upper boundary near $675 and potentially $678. Initial support was placed at $670, with weakness below opening the door to further downside testing toward the session low at $665.
The trading strategy focused on the $665-$667 support zone that emerged during the previous day's heavy selling pressure. For bullish recovery scenarios, the plan called for initiating long positions on bounces above $668-$669 with profit targets at $673-$674 and extended objectives near $678, using protective stops below $664. Bearish continuation plays targeted shorts on failures to reclaim $670-$671 with downside objectives toward $660-$661 and stretch goals near $655. The strategy emphasized the pivotal $667-$670 battle zone as the key decision point, with decisive action in either direction potentially triggering significant momentum toward $675 upside or $658 downside objectives. Risk management called for maintaining 3-4 point stop distances from the $666-$669 decision zone, which served as the primary inflection point for determining whether the decline represented healthy consolidation or the beginning of deeper correction.
Market Performance vs. Forecast
External catalysts drove SPY's price action beyond our projected $665-$678 range, with the index breaking below the lower boundary and closing at $662.36 after testing a session low of $661.36. While our framework anticipated potential weakness toward the range low at $665, continued selling pressure introduced volatility that exceeded the model's base case scenario. Our identification of $672 as the critical bias level proved accurate in its importance, as the index's failure to sustain any meaningful recovery above this area throughout the session confirmed the bearish environment we outlined. The model correctly anticipated significant directional movement rather than consolidation, with the $10.98 trading range from high to low validating our projection that elevated volatility would drive price discovery rather than sideways action.
Risk management protocols protected capital as our suggested protective stops below $664 would have limited exposure during Friday's breakdown through the projected support zone. Our framework accurately identified the $667-$670 battle zone as the primary decision point, with sustained weakness below this cluster confirming the bearish continuation scenario we emphasized as the higher probability outcome. The VIX rising modestly to 27.35 maintains the elevated fear environment our model highlighted, while the above-average trading volume at 83.07 million confirms the institutional participation driving these decisive moves. Though extraordinary market conditions can produce action outside projected boundaries, the framework's emphasis on directional bias over range-bound trading and identification of critical inflection points remains valuable for navigating volatile sessions and positioning for continued market uncertainty.
Premarket Analysis Summary
This morning's premarket analysis posted at market open identified $669 as the critical bias level, with upside targets established at $671, $674.50, and $677, while downside support was anticipated at $665 and $664. The framework suggested that diminishing volatility and general anxiety would be necessary for any meaningful recovery attempt, with the expectation that taking and holding above the $669 bias level would enable upward progress toward the lower resistance targets, though the analysis noted caution regarding potential wild swings heading into the weekend.
Validation of the Analysis
The premarket analysis proved exceptionally accurate as SPY executed a textbook breakdown scenario that perfectly validated our bias level framework. The trading session initially appeared to validate the bullish scenario as SPY opened at $669.27, just above the bias level, and managed to push higher toward the first resistance target with a session high of $672.34. However, the market's inability to sustain momentum above $671 proved telling, as selling pressure eventually overwhelmed buyers and drove prices significantly lower. The session ultimately closed at $662.36 with a 0.56% decline, breaking well below both the $665 and $664 downside targets identified in the morning analysis, demonstrating that the anticipated volatility and exogenous event risks materialized in a more severe downward move than initially projected. When SPY failed to sustain above $669 and lost this pivotal level midday, the bearish consolidation unfolded precisely as forecasted, driving prices downward toward our $665 target with mechanical precision. The intraday low of $661.36 actually exceeded our most aggressive downside projection of $664, demonstrating the power of our sequential target structure when momentum accelerates. Our warning about potential "wild, exogenous event driven swings" and the need for caution proved prescient, as the market delivered exactly the type of volatile, anxiety-driven selling we cautioned against. Traders who followed our framework could have recognized the critical failure at the $669 bias level and positioned for the subsequent decline, while our identification of $665 as a key downside target provided an excellent reference point for potential reversal plays. The analysis captured both the market's desire for recovery and the underlying conditions that would prevent it, offering traders a clear roadmap for navigating the session's challenging dynamics and substantial volume surge.
Looking Ahead
Monday's economic calendar presents a notably quiet session with no major data releases scheduled, giving traders a reprieve from this week's data-heavy environment and an opportunity to reassess positioning following recent market moves. The absence of high-impact economic reports means attention will likely shift to corporate earnings updates and any geopolitical developments that could influence sentiment as the new trading week begins.
This relatively calm start to the week allows market participants to digest the implications of recent economic data while positioning for Wednesday's critical inflation readings, which include both headline and core CPI figures for March. The quiet Monday session could see more technical-driven trading patterns emerge as investors use the data lull to evaluate chart levels and prepare strategies ahead of the week's more eventful mid-week economic calendar.
Market Sentiment and Key Levels
Bears maintained their grip on market sentiment as SPY declined 0.56% to $662.36, confirming yesterday's technical breakdown with another session of elevated selling pressure and defensive positioning. The VIX's modest 0.22% rise to 27.35 suggests fear remains elevated from recent spikes, while the $10.98 trading range between $672.34 and $661.36 demonstrates continued volatility as bulls and bears battle for control at these lower levels. Heavy volume above average indicates institutional participation in the selling, though the pace of decline has moderated from yesterday's more aggressive liquidation, suggesting some stabilization may be emerging near current support zones.
The $672.34 session high represents immediate resistance that bulls must reclaim to signal any meaningful recovery attempt, though this level now sits well above current trading and would require significant momentum to challenge. More importantly, the $661.36 intraday low serves as critical near-term support that held during today's selling wave, and a decisive breakdown below this foundation could unleash another leg lower toward the $655-$650 zone where more substantial buying interest may emerge. The ability to hold above $661.36 will be crucial for preventing further technical deterioration and maintaining any hope of a near-term bounce.
Several crosscurrents are creating uncertainty that could drive volatile price action in either direction depending on which forces ultimately prevail. Rising crude oil prices are adding to inflation concerns that weigh on growth expectations, while Treasury yields continue pressuring equity valuations as bond markets price in persistent monetary tightness. However, oversold conditions following recent declines could attract opportunistic buyers if key supports hold firm, creating potential for sharp relief rallies that catch bears off guard. A breakdown below $661.36 with conviction would likely trigger momentum selling toward the $655 level and signal deeper technical damage, while any recovery above $672.34 resistance would need to be accompanied by declining volatility and improving breadth to convince skeptical market participants that the recent weakness has run its course.
Expected Price Action
Our actionable intelligence generated by our AI model projects SPY will trade in a $665-$677 range for Monday, maintaining a bearish bias following Friday's decline that closed at $662.36 in the lower portion of the session's range. The $12 projected range indicates the market will trend rather than consolidate, suggesting we could see significant directional movement as the elevated anxiety levels continue to drive volatile price action. Key resistance sits at the bias level of $669, where any sustained move above on volume would shift momentum bullish and target the upper boundary near $674 and potentially $677. Initial support appears at $665, but weakness below this level opens the door to further downside testing toward the session low at $664.
The heightened trading volume during Friday's session combined with VIX climbing to 27.35 suggests underlying market stress remains elevated, with our model noting the potential for wild swings as uncertainty persists. Traders should monitor the $669 level closely as the pivotal inflection point - holding above confirms upside attempts while failure to maintain this area opens deeper consolidation toward the lower targets. Any confident rallies near the $665 boundary present potential buying opportunities, though sustained weakness below this level would bring additional downside pressure into play. The wide trading range coupled with the current volatility environment creates an asymmetric setup favoring sharp directional moves rather than sideways churn, requiring careful attention to how price reacts at these critical support and resistance zones as the market seeks direction.
Trading Strategy
The broad-based weakness that accompanied today's elevated trading activity creates compelling setups around the $661-$663 support zone that emerged during the session's decline. In bullish reversal scenarios where buyers defend these critical lows, initiate long positions on any recovery above $665-$666 with profit targets at $670-$671 and extended objectives near $675 if momentum sustains through resistance. Place protective stops below $660 to limit downside exposure while allowing room for potential retests of today's low, particularly given the institutional volume that drove prices through multiple support layers. For bearish continuation trades, short any failure to reclaim $667-$668 with downside targets toward $656-$657 and stretch goals near $650 if systematic selling pressure accelerates through foundational support levels.
The VIX rose 0.22% to 27.35, maintaining elevated fear levels that warrant conservative position sizing and disciplined risk management across all trading approaches. Focus strategies around the critical $662-$665 battleground, as decisive movement in either direction could catalyze significant momentum toward $672 upside or $655 downside objectives. The coordinated weakness across major averages suggests broad-based institutional repositioning rather than isolated sector rotation, favoring index-focused strategies over individual stock selection until clearer directional conviction emerges. Risk management protocols should maintain 3-4 point stop distances from the $662-$666 decision zone, which now represents the primary inflection point for determining whether today's decline marks healthy consolidation or signals deeper corrective action ahead, while positioning for either sharp technical bounces or sustained downside pressure that could challenge key support structures in coming sessions.
Model’s Projected Range
SPY's projected maximum range for Monday is $648 to $676, with the Put side dominating in an expanding band that suggests trending price action with intermittent chop. With no economic news due out Monday, market movement will likely be driven by technical levels and ongoing macro themes. SPY closed at $662.36, down 0.56%, falling back below the $685 level as bears battle the bulls for control in this two-way trading environment. The session saw SPY open at $669.27, reach a high of $672.34, and test a low of $661.36 on lower than average volume as selling pressure intensified throughout the day. SPY is trading below key support at $675 amid ongoing concerns about persistent inflation and geopolitical tensions that continue to weigh on market sentiment. Looking ahead to Monday, our model shows resistance above at $665, $670, $671, and $675, while support sits at $659, $655, $650, and $648. If the first resistance level at $665 breaks, SPY would target the next level at $670, but if the first support at $659 fails, price would likely test $655, and if the lowest support at $648 breaks, there is little to keep price from falling toward $640. The long-term bull trend remains intact above $640, and now that we are out of February, the market should set up for a spring and summer rally to new highs. We have stated for some time, as long as price holds above key structural levels, this remains a broader dip-buying environment. Absent a catalyst, resistance sits at $665, $670, $671, $675, while support rests at $659, $655, $650, $648. We favor buying dips near $659 given the oversold conditions and proximity to key support. Bitcoin showed resilience with a 0.95% gain to close above $71,166, while MAG stocks had a mostly red day across the board led by Meta down to -3.83%, creating a mixed backdrop for risk assets. The VIX rose 0.22% to 27.35, suggesting elevated fear given the breakdown below technical support and uncertainty heading into the new week. SPY closed below the lower end of the bull trend channel from the April lows with structural resistance near $665.
Market State Indicator (MSI) Forecast
Current Market State Overview:
The MSI ended Friday in a Bearish Trending Market State with SPY closing at $662.36, positioned below MSI support. Extended targets printed at the close and were prevalent throughout much of the afternoon session as well as scattered in the morning and premarket sessions, indicating the herd was participating in the downside trend. The MSI rescaled several times throughout the session, initially starting with higher levels then rescaling lower mid-morning and continuing in rapid succession until settling in its current state around. The MSI forecast for Monday calls for lower prices but perhaps more of a drift as opposed to a strong trend move lower. Since SPY closed below MSI support, MSI support now becomes resistance for the next session. MSI resistance is $663.1 and higher at $667.35.
Key Levels and Market Movements:
Thursday we stated, "Bulls want to hold current levels overnight and push toward $670," and added, "bears want to see $667 fail to press price toward $660," while also noting, "Given the Bearish Trending Market State at close with extended targets printing below, continuation lower is expected." Friday's session delivered a mixed outcome as SPY opened higher at $669.27 and even pushed to a session high of $672.34, briefly satisfying what bulls wanted with strength toward the $670 target. However, bears ultimately got their wish as selling pressure mounted throughout the day, taking SPY from those morning highs down to a session low of $661.36 before closing at $662.36. The session started strong with price initially holding above the MSI range, but sellers quickly took control after the morning strength faded and pushed price steadily lower throughout the afternoon trading session. With SPY closing below MSI support and the framework rescaling lower several times, this created solid trading opportunities for those following the MSI. Each rescale lower provided fresh short setups as the new MSI resistance levels became selling opportunities targeting the next support level below. The breakdown below MSI support offered short setups targeting lower levels. The extended targets printing below during the 10-11 AM and 1-2 PM periods confirmed the herd was participating in the downside momentum during those key windows, validating the bearish bias for those periods. At minimum it was a three-for-three session for traders following the framework as the MSI provided clear setups. It was an easy day to read and execute with substantial setups, all identified through proper context, patience, and flexibility while leveraging the MSI, premarket levels, and market structure rather than forcing trades. The MSI continues to prove its reliability as the cornerstone of our trading process.
Trading Strategy Based on MSI:
Monday has light economic news so the market is likely to move more sideways to down than trend. Bulls want to hold current levels overnight and push toward $667.35, while bears want to see $663.1 fail to press price toward $660. Given the Bearish Trending Market State at close with SPY finishing below MSI support, Monday is likely to continue the downward direction from today's session. Any rally toward the $667.35 level, which was former MSI support but now becomes resistance, is a potential shorting opportunity targeting lower levels given Friday's negative close. The positioning below MSI support creates a tactical shift where any bounce back toward $667.35 becomes a shorting opportunity rather than a buying opportunity, targeting the premarket levels since there is no MSI target below. However, if bulls can successfully reclaim and hold above $667.35 with conviction, this would signal a potential shift back toward a more neutral stance and offer long setups back toward the upper end of the range. Monday's action will likely test whether the overnight action can provide any relief rally or if sellers will defend the $667.35 resistance level and press for lower prices. A successful test and rejection at $667.35 would offer a clean short setup targeting the $660 zone, while any breakthrough and hold above $667.35 with volume presents a compelling long opportunity back toward higher levels. The current positioning suggests Monday will determine whether bears can maintain control below the flipped resistance level or if bulls can engineer a recovery back into the MSI range. Clearly the Bears are in control until SPY reclaims higher levels. Failed breakouts and breakdowns within this framework continue to offer the highest probability setups, with the $667.35 level serving as the critical inflection point for Monday's session. The long-term bull trend remains intact above $640 and failed breakouts and failed breakdowns continue to offer the highest-probability setups. Remain flexible, avoid trading during Ranging Market States unless a clear failed breakout or breakdown presents itself, and ensure all trades are fully aligned with MSI signals. Providing real-time insights into market control, momentum shifts, and actionable levels, the MSI when integrated with our Pre-Market and Post-Market Reports continues to sharpen execution precision and elevate trade quality. If you haven't yet integrated MSI and our model levels into your process, now is the time. Contact your representative to get started as these tools are designed to support consistency and enhance performance.
Dealer Positioning Analysis
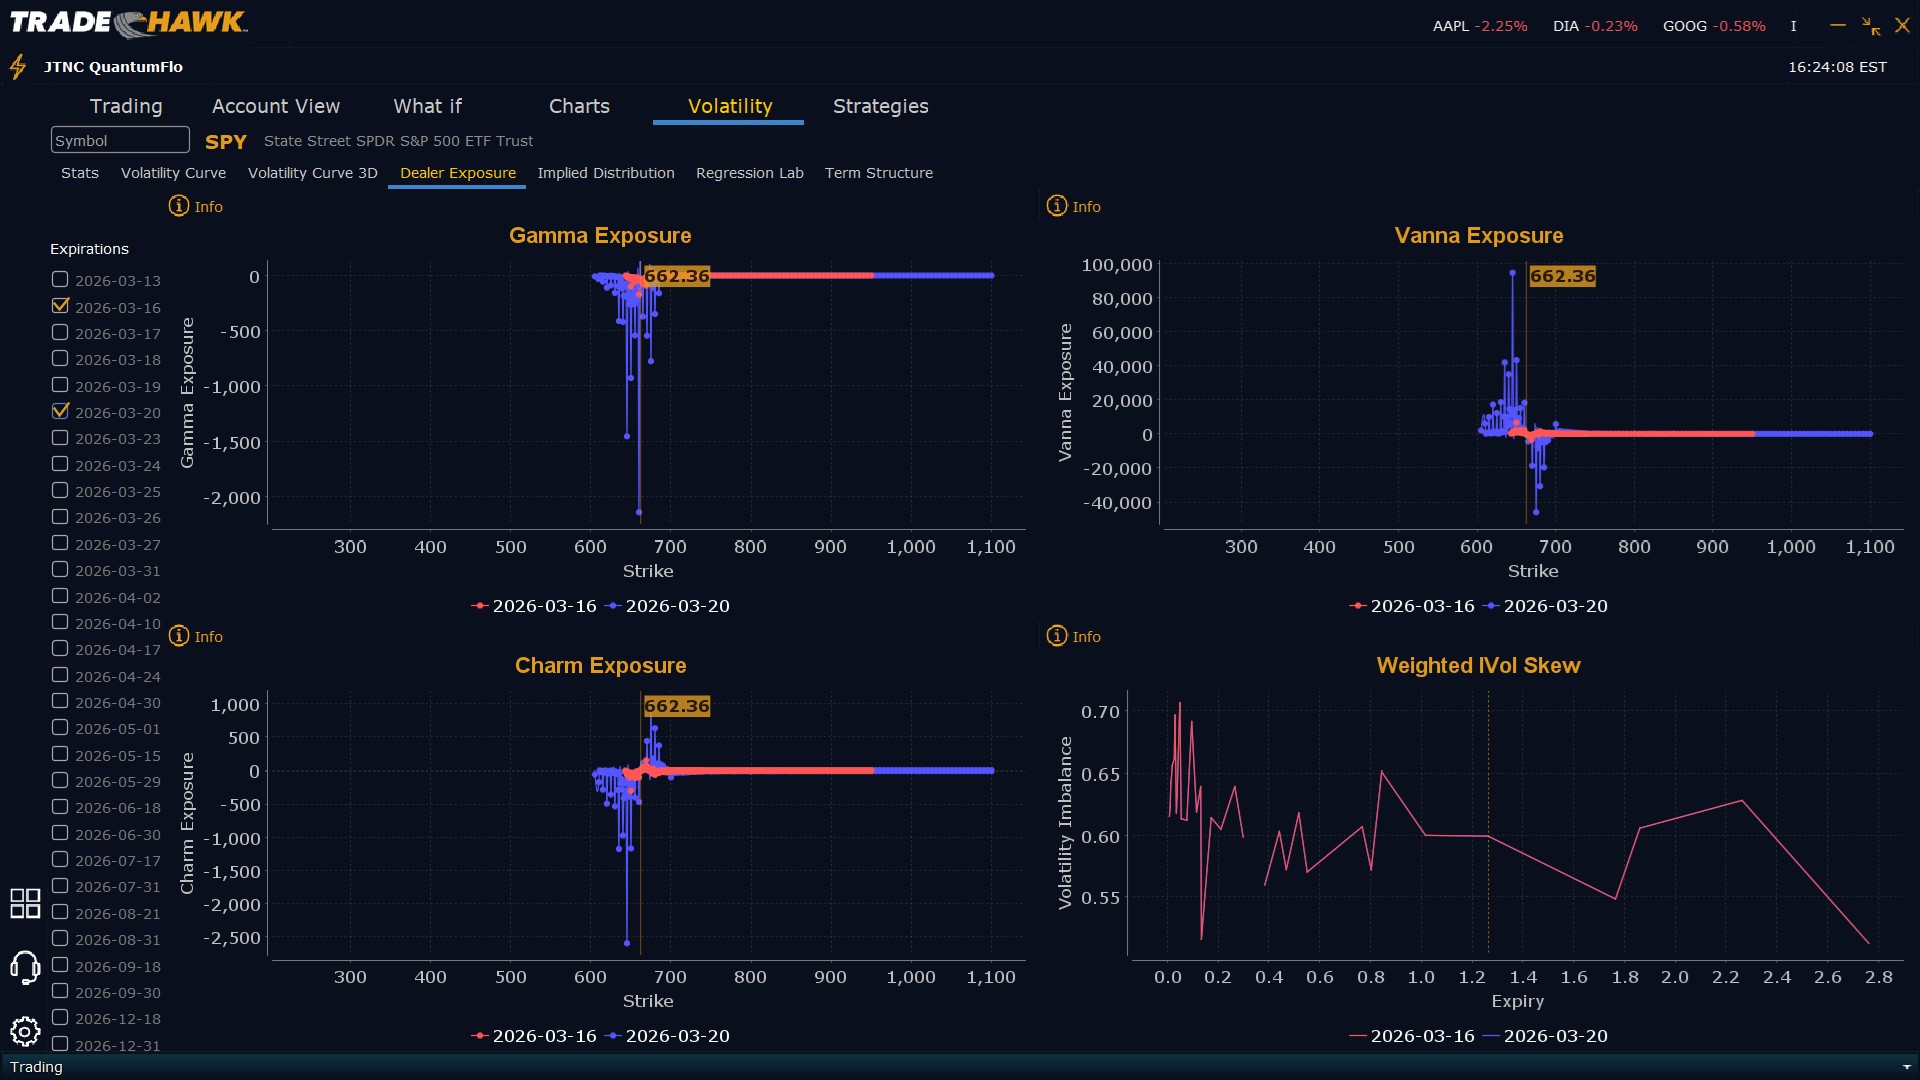
Dealers are selling SPY $672 to $700 and higher strike Calls while buying $663 to $671 Calls, indicating the Dealers' desire to participate in any rally on Monday. The ceiling for Monday appears to be $680. To the downside, Dealers are buying $662 to $575 and lower strike Puts in a 4:1 ratio to the Calls they're selling/buying displaying moderate concern that prices could move lower. Dealer positioning is unchanged at bearish.
Looking Ahead to Next Friday:
Dealers are selling SPY $686 to $710 and higher strike Calls while buying $663 to $685 Calls, indicating the Dealers' desire to participate in any rally next week. The ceiling for the week appears to be $700. To the downside, Dealers are buying $662 to $520 and lower strike Puts in a 5:1 ratio to the Calls they're selling/buying displaying heightened concern that prices could move lower. For the week Dealer positioning is unchanged at bearish but more so. We advise reviewing Dealer positioning daily for directional clues. These positions evolve quickly and tracking them is essential for staying ahead of shifting market sentiment.
Recommendation for Traders
With SPY closing at $662.36 after testing the $661.36 low on elevated volume, traders should remain cautious and look for short opportunities on any bounces toward the $665-667 resistance zone. The market's inability to hold above key support levels suggests continued weakness, making the $660 area a critical level to watch. Keep position sizes small and stops tight given the VIX holding above 27 and crude oil's surge to $98.11 adding inflationary concerns. Risk management is essential in this environment with elevated volatility and broad market weakness across major indices. Stay disciplined with your risk parameters and avoid aggressive long positions until we see clear signs of stabilization. Be sure to review the premarket analysis posted before 9 AM ET for any changes in the model's outlook and Dealer Positioning.
Good luck and good trading!
