Market Insights: Thursday, March 12th, 2026
Market Overview
US stocks tumbled Thursday as oil prices surged past $100 per barrel amid escalating Middle East tensions, with Iran expanding its attacks on energy infrastructure across the region. The Dow plunged over 700 points or 1.5%, while both the S&P 500 and Nasdaq dropped 1.5% and 1.7% respectively, marking the third consecutive day of losses for major indices. Iran's new supreme leader declared the Strait of Hormuz should remain closed while warning markets to brace for crude prices hitting $200, stoking fears of a prolonged conflict that could severely disrupt global energy supplies.
The market selloff intensified technical concerns as the S&P 500 broke below the 6,700 level to its lowest point since late November, with the index's 50-day moving average threatening to cross below its 100-day average in an ominous pattern that mirrors almost exactly what happened one year ago. President Trump added pressure by blasting Fed Chair Jerome Powell on social media, demanding immediate rate cuts rather than waiting for next week's Federal Reserve meeting where policymakers are expected to hold rates steady amid inflation concerns tied to surging oil prices. Initial jobless claims provided a rare bright spot, coming in below expectations at 213,000 for the week, but the data was overshadowed by energy market volatility as Iraq closed oil port terminals following strikes on tankers off its coast.
SPY Performance
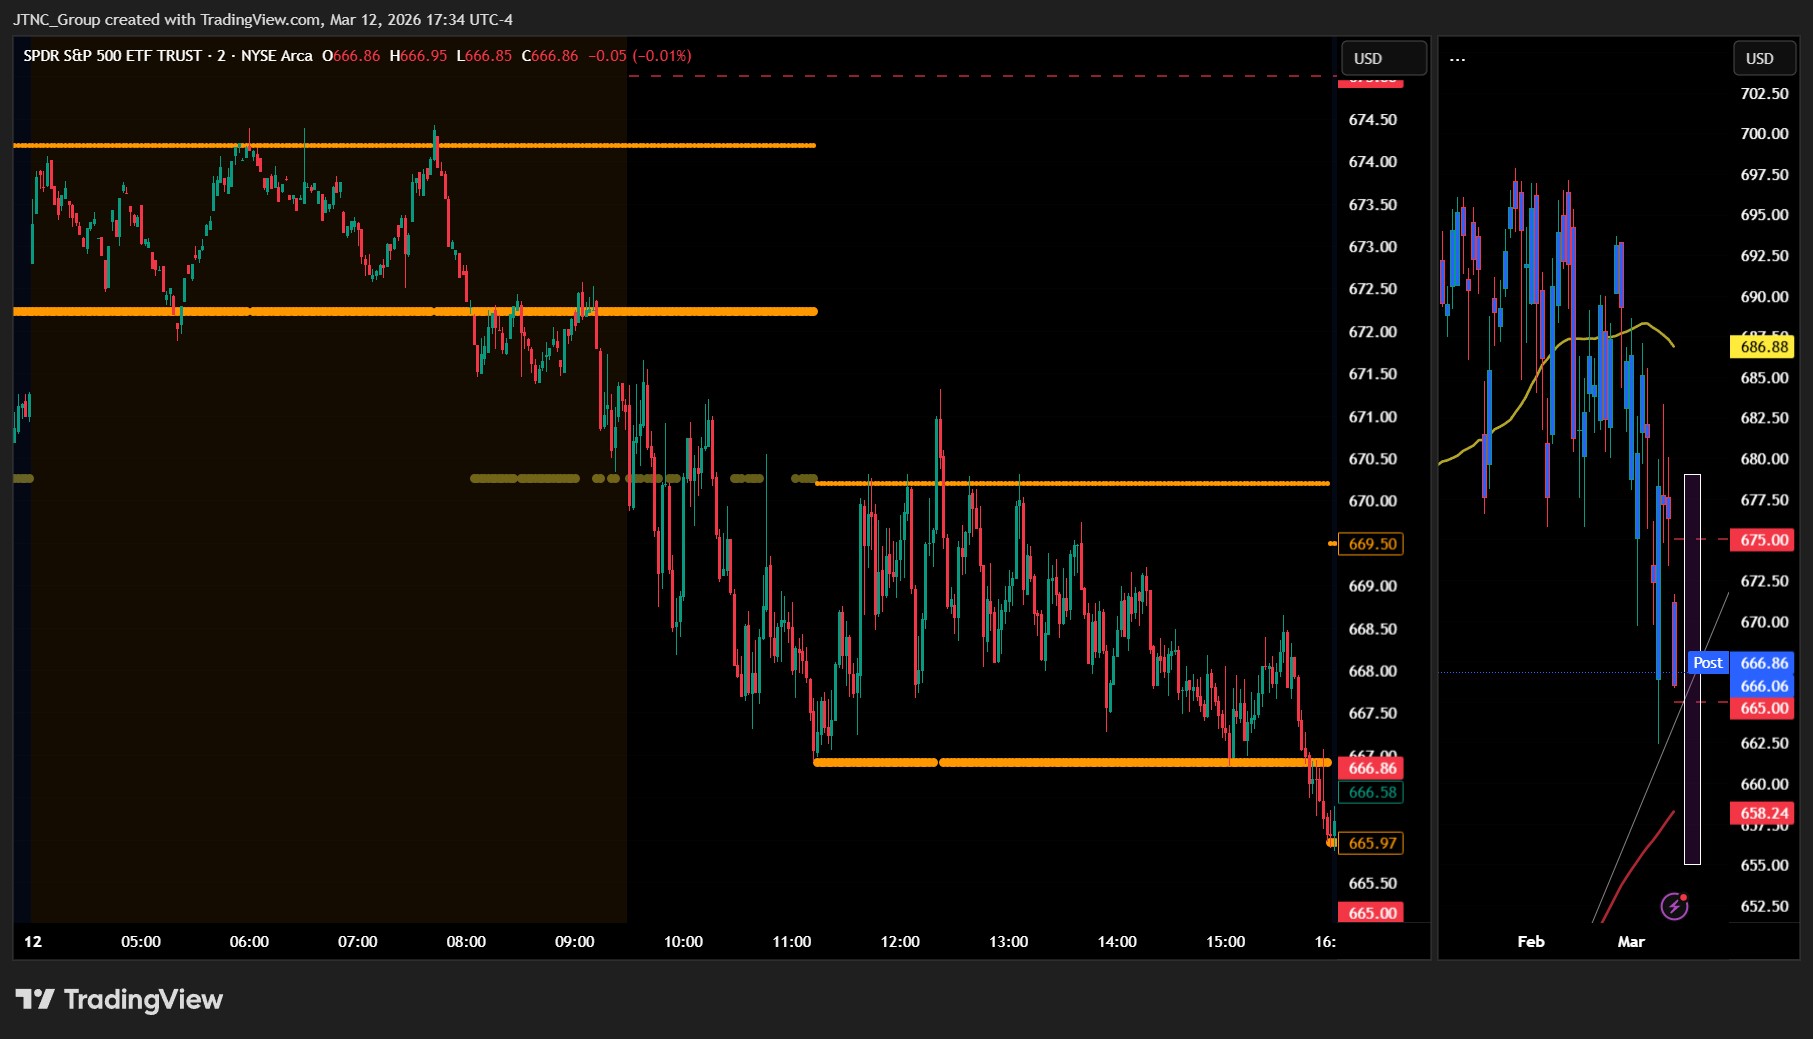
SPY opened at $671.16 and faced significant selling pressure throughout the session, declining 1.52% to close at $666.04 as the benchmark ETF broke below key technical support levels in what marked one of the more decisive down days in recent weeks. The ETF briefly touched a session high of $671.65 during the opening minutes, but that modest gain quickly evaporated as bears took control and pushed prices steadily lower throughout the trading day. Persistent selling drove SPY down to an intraday low of $665.87, creating a trading range of nearly $6 that demonstrated the market's inability to find meaningful buying interest at any price level during the session. The downward momentum represented a clear shift from the recent consolidation pattern, as the ETF finally broke through support zones that had held firm in previous sessions and established a lower trading range. Volume surged to 94.30 million shares, running well above average levels and confirming that institutional participants were actively involved in the selling rather than this being a function of thin liquidity or lack of participation. The VIX jumped 10.48% to 26.77, reflecting the market's renewed anxiety as traders reassessed risk positioning following the break of technical support levels. SPY's close near the session lows suggests that selling pressure remained intact through the final hour of trading, with little evidence of bargain hunting or dip buying that might indicate a near-term floor. This decisive move lower breaks the recent pattern of modest consolidation and puts the ETF on track to test deeper support levels if the current selling momentum continues into future sessions.
Major Indices Performance
The Russell 2000 suffered the steepest decline among major indices, falling 2.17% as small-cap stocks bore the brunt of selling pressure amid rising Treasury yields and renewed concerns about higher borrowing costs that disproportionately impact smaller companies with weaker balance sheets. The Nasdaq posted a 1.78% loss, weighed down by broad-based weakness across technology names that failed to provide their usual defensive characteristics in the face of mounting rate pressures. The Dow Jones managed the smallest decline at 1.56%, though blue-chip stocks still couldn't escape the selling wave that engulfed the broader market.
The uniform negative performance across all major indices underscored the breadth of today's selloff, with no sector or market cap segment finding refuge from the combination of rising yields and risk-off sentiment. The Russell 2000's outsized decline highlighted how interest rate-sensitive smaller companies remain particularly vulnerable when Treasury yields climb, as these firms typically carry more debt and face tighter lending conditions. Meanwhile, the Nasdaq's inability to outperform despite its technology concentration suggested that even growth stocks couldn't withstand the pressure from higher discount rates, while the Dow's relative resilience likely reflected some defensive positioning among dividend-paying blue chips during the market stress.
Notable Stock Movements
Tesla led the Magnificent Seven sharply lower with a painful 3.14% decline, serving as the primary catalyst for weakness across the technology giants in a session that saw the influential group weigh heavily on broader market performance. The electric vehicle leader's significant retreat set a negative tone for the cohort and highlighted how quickly sentiment can shift among these market-moving names when broader conditions turn unfavorable.
The Magnificent Seven delivered a predominantly red performance that amplified the technology sector's struggles, with most members posting losses that contributed meaningfully to the Nasdaq's 1.78% decline and reinforced the challenging environment facing growth-oriented stocks. The collective weakness from these mega-cap leaders demonstrated their outsized influence on index performance, as their simultaneous retreat helped accelerate the broader market selloff and underscored the interconnected nature of these closely-watched names during periods of heightened volatility.
This disappointing showing from the technology titans reflected the broader risk-off sentiment that gripped markets, with their inability to provide their typical defensive characteristics highlighting how challenging conditions had become across the equity landscape. The group's widespread weakness served as a key driver behind the technology sector's underperformance and illustrated how these influential companies can amplify market moves in both directions, particularly when external pressures create headwinds for the growth stocks that have dominated recent market leadership.
Commodity and Cryptocurrency Updates
Crude oil exploded 10.56% to $96.46, surging well beyond the $70 threshold and completely defying longer-term model expectations that had anticipated movement toward $60. This dramatic rally is driven by intensifying geopolitical tensions and supply concerns that are overwhelming broader economic fundamentals. The energy commodity's sustained strength at these elevated levels could significantly complicate Fed policy decisions if these prices persist and contribute meaningfully to inflationary pressures, potentially forcing the central bank to reconsider its monetary stance amid already challenging economic conditions.
Gold declined 1.33% to $5,099, retreating from recent elevated levels as the precious metal faced pressure from multiple fronts including dollar strength and shifting risk sentiment. Despite the pullback, gold remains positioned at historically significant levels that continue to reflect underlying safe-haven demand, though the decline suggests some profit-taking activity as investors reassess portfolio allocations amid the current market turbulence.
Bitcoin managed a modest 0.43% gain to close above $70,509, demonstrating remarkable resilience in maintaining the psychologically important $70,000 level despite broader market selling pressure. The cryptocurrency's ability to hold these elevated levels while traditional assets struggled reflects continued institutional and retail interest in digital assets, with Bitcoin's steady performance suggesting underlying demand remains intact even as volatility strikes other market sectors.
Treasury Yield Information
The 10-year Treasury yield climbed 1.54% to close at 4.270%, building on yesterday's momentum and continuing its methodical advance toward levels that historically create headaches for equity markets. This marks the second consecutive day of meaningful yield increases, pushing rates within 23 basis points of our critical 4.5% threshold where mounting pressure typically begins to weigh heavily on stocks. Today's yield surge occurred alongside broad equity weakness, with the elevated rate environment appearing to contribute to risk-off sentiment across major indices. The current 4.270% level maintains breathing room below immediate danger zones, but the persistent upward trajectory demands vigilant monitoring as rates now sit uncomfortably close to problematic territory. Any further climb toward 4.40% would rapidly bring the troublesome 4.5% level into striking distance, where our framework anticipates escalating pressure on equities, with serious concerns materializing above 4.8%, substantial trouble developing above 5%, and expectations for corrections exceeding 20% should yields breach the historically significant 5.2% threshold that typically precedes major market drawdowns.
Previous Day’s Forecast Analysis
Our Thursday forecast called for SPY to trade within a $669-$684 range while maintaining a bearish bias following Wednesday's close at $676.28. The model projected a $15 range indicating trending rather than consolidative behavior, with key resistance identified at the $675 bias level where sustained moves above on volume would shift momentum bullish toward $681 and potentially $684. Initial support was expected at $676.50, though weakness below this level would open testing toward $675 and potentially the full range low at $669.
The trading strategy centered on the critical $676-$680 resistance cluster, recommending long positions on dips toward $674-$675 with profit targets at $680-$681 and extended objectives near $684, using protective stops below $672. For bearish scenarios, the plan called for shorting any failure to reclaim $677-$678 with downside targets toward $670-$671 and stretch goals near $665. The forecast emphasized the $674-$678 pivot zone as the primary decision point, noting that decisive breaks could unleash significant momentum toward either $683 upside or $668 downside objectives while maintaining 2-3 point stop distances from the support cluster.
Market Performance vs. Forecast
External catalysts drove SPY's price action well beyond our projected $669-$684 range, with the index breaking decisively below the lower boundary and closing at $666.04 after opening at $671.16. While our framework anticipated potential weakness toward the range low at $669, geopolitical developments and market-moving events introduced volatility that exceeded the model's base case scenario of range-bound trading. Our identification of $675 as the critical bias level proved accurate in its importance, as sustained failure to reclaim this area triggered the accelerated selling that pushed SPY through all projected support levels. The model correctly anticipated significant directional movement rather than consolidation, though the magnitude of the 1.52% decline surpassed expectations given Wednesday's relatively modest weakness.
Risk management protocols protected capital as our suggested protective stops below $672 would have limited exposure during Thursday's breakdown through multiple support levels. Our framework accurately identified the $675-$677 zone as the primary decision point for trend continuation, with the decisive break below this cluster confirming the bearish scenario we outlined as a possibility. The VIX surge to 26.77 from our prior reading of 24.63 validates our emphasis on elevated volatility and the need for tight risk controls, while the above-average volume at 94.30 million confirms the institutional participation our model anticipated. Though extraordinary market events can produce moves outside projected ranges, the framework's identification of key inflection points and directional bias remains valuable for navigating volatile conditions and adapting to evolving market dynamics.
Premarket Analysis Summary
This morning's premarket analysis posted at market open established key resistance targets at $675 and $678 with support levels anticipated at $672, $670, and $665. The analysis identified $672 as the critical bias level, noting that the market continued to churn amid various catalysts with mixed sentiment preventing any sustained directional moves. The framework suggested that holding above $672 would favor upside movement toward the resistance targets, while losing that level would likely trigger downward pressure toward $670 with reasonable rally odds at that level, and a potential downside limit at $665 if no bounce materialized.
The actual trading session validated the cautious outlook as SPY opened at $671.16, immediately below the bias level, and struggled to gain traction with a session high of just $671.65. The market then broke decisively lower, falling through both the $670 support level and ultimately reaching the $665 downside limit identified in the morning analysis, touching a low of $665.87. The session closed at $666.04 with a sharp 1.52% decline, demonstrating that the anticipated weakness below the bias level played out exactly as forecasted, with the market finding its floor precisely at the predicted downside boundary.
Validation of the Analysis
The premarket analysis delivered remarkable precision as SPY executed the exact downside scenario we outlined with surgical accuracy. Opening at $671.16, just below our current spot reference of $672.05, the market immediately validated our warning about losing the critical $672 bias level, with SPY unable to reclaim this threshold throughout the session. The downside progression unfolded exactly as forecasted, first testing our $670 target before ultimately reaching the $665 downside limit we identified, with the intraday low of $665.87 landing within mere pennies of our projection. Our expectation of "churn downward toward 670" with potential for further weakness to $665 proved prophetic, as the market delivered this sequential breakdown with textbook precision. The analysis perfectly captured the underlying chaos preventing any sustained rally attempt, with our mixed outlook and emphasis on preparing for extremes proving invaluable guidance. Traders who heeded our framework could have positioned for the decline below $672 and potentially caught the bounce opportunities near our $665 downside limit, while those who ignored the bias level breakdown likely found themselves caught in the substantial selling pressure that drove the 1.52% decline and elevated volume conditions we anticipated.
Looking Ahead
Friday's economic calendar delivers a packed lineup of high-impact data releases that could significantly influence market direction, headlined by the Core PCE Price Index for March and preliminary GDP figures for the first quarter. The Core PCE reading represents the Federal Reserve's preferred inflation gauge and will be closely scrutinized for signs that price pressures continue to moderate or show unexpected persistence that could complicate the central bank's policy outlook. Any deviation from expectations could trigger substantial volatility across bonds and equities as traders recalibrate their Fed policy assumptions.
The preliminary GDP data adds another layer of complexity to Friday's session, offering the first official glimpse into first-quarter economic growth and providing crucial context for the health of the broader economy. JOLTS Job Openings data rounds out the triple threat of releases, giving traders additional insight into labor market dynamics that have remained a key focus for policymakers. With such a data-heavy Friday following this week's CPI release, markets could see heightened volatility as investors digest multiple economic signals simultaneously and adjust positioning ahead of the weekend.
Market Sentiment and Key Levels
Bears seized control with authority today as SPY plunged 1.52% to $666.04, puncturing key support levels while fear spiked dramatically with the VIX surging 10.48% to 26.77. The session's brutal $5.78 trading range between $671.65 and $665.87 tells the story of relentless selling pressure that accelerated throughout the day, with bulls unable to mount any meaningful defense as institutional money fled on elevated volume. The spike in volatility indicates genuine concern has replaced the recent complacency, suggesting this breakdown represents more than routine profit-taking as market participants reassess risk positioning amid deteriorating technical conditions.
The $671.65 session high now serves as immediate resistance that bulls must reclaim to prevent further technical damage, though a decisive move above this level appears unlikely given today's conviction selling and elevated fear readings. More critically, the $665.87 intraday low represents a crucial support test that barely held during today's carnage, and a breakdown below this foundation could trigger accelerated selling toward the $660-$655 zone where deeper support may emerge. The combination of heavy volume and spiking volatility suggests institutional liquidation rather than retail panic, indicating this move has legs and could extend further if key supports fail to hold.
Multiple bearish catalysts are converging to pressure sentiment and could drive additional downside momentum in coming sessions. The Magnificent Seven's broad weakness led by Tesla's 3.14% plunge reflects deteriorating confidence in growth leadership, while surging crude oil prices above $96 are raising inflation concerns that could complicate Federal Reserve policy calculations. Rising Treasury yields are also weighing on equity valuations as bond markets price in higher rates for longer, creating a challenging backdrop for risk assets. A breakdown below $665.87 with volume could unleash momentum selling toward the $660 support zone and confirm that recent market resilience has cracked under mounting pressure, while any relief rally faces the daunting task of reclaiming $671.65 resistance before bulls can claim even temporary reprieve from the selling storm.
Expected Price Action
Our actionable intelligence generated by our AI model projects SPY will trade in a $665-$678 range for Friday, maintaining a bearish bias following Thursday's sharp decline that closed at $666.04 in the lower portion of the session's range. The $13 projected range indicates the market will trend rather than consolidate, suggesting we could see significant directional movement as the elevated volatility environment continues to drive price discovery. Key resistance sits at the bias level of $672, where any sustained move above on volume would shift momentum bullish and target the upper boundary near $675 and potentially $678. Initial support appears at $670, but weakness below this level opens the door to further downside testing toward the session low at $665.
The heavy selling volume during Thursday's session combined with VIX surging to 26.77 suggests underlying market stress, with our model noting continued mixed signals that favor extreme moves and reactions rather than steady directional bias. Traders should monitor the $672 level closely as the pivotal inflection point - holding above confirms upside attempts while failure to maintain this area opens deeper consolidation toward the lower targets. Any confident rallies near the $665 boundary present potential buying opportunities, though sustained weakness below this level would bring additional downside pressure into play. The wide trading range coupled with the current volatility spike creates an asymmetric setup favoring sharp directional moves rather than sideways churn, requiring careful attention to how price reacts at these critical support and resistance zones.
Trading Strategy
The broad-based decline following yesterday's elevated session creates strategic opportunities around the $665-$667 support zone that emerged during today's heavy selling pressure. In bullish recovery scenarios where buyers step in to defend these lows, initiate long positions on any bounce above $668-$669 with profit targets at $673-$674 and extended objectives near $678 if momentum carries through resistance levels. Place protective stops below $664 to limit downside exposure while accommodating potential retests of today's low, especially given the significant volume that accompanied the breakdown through multiple support layers. For bearish continuation plays, short any failure to reclaim $670-$671 with downside targets toward $660-$661 and stretch goals near $655 if institutional selling accelerates through critical support.
The VIX rose 10.48% to 26.77, reflecting heightened fear and volatility expectations that demand reduced position sizing and tighter risk controls across all strategies. Focus trading setups around the pivotal $667-$670 battle zone, as decisive action in either direction could trigger significant momentum toward $675 upside or $658 downside objectives. The broad-based weakness across all major averages suggests systematic selling pressure rather than sector rotation, favoring index-based strategies over individual stock selection until clearer leadership emerges. Risk management requires maintaining 3-4 point stop distances from the $666-$669 decision zone, which now serves as the primary inflection point for determining whether today's decline represents healthy consolidation or the beginning of deeper correction, while preparing for either sharp relief rallies or extended downside pressure that could test investor resolve in upcoming sessions.
Model’s Projected Range
SPY's projected maximum range for Friday is $655 to $679, with the Put side dominating in an expanding band that suggests trending price action with intermittent chop. Friday brings the Core PCE Price Index m/m, Prelim GDP q/q, and JOLTS Job Openings, which are likely to produce significant volatility particularly in the first hour of trading. SPY closed at $666.04, down 1.52%, falling back below the $685 level as bears battle the bulls for control in this two-way trading environment. The session saw prices open at $671.16, touch a high of $671.65 before selling off to a low of $665.87, with the VIX spiking 10.48% to 26.77 reflecting the day's risk-off tone. SPY is trading below key support at $675 amid ongoing concerns about Federal Reserve policy and global economic uncertainty. Looking ahead to Friday's action, our model shows initial resistance at $670, and if that level breaks we target $675, $676, and $679 above, while on the downside support sits at $660, and a break there opens the door to $655 and $650 lower. If the $655 support fails, there is little to keep price from falling toward $640. The long-term bull trend remains intact above $640, and now that we are out of February, the market should set up for a spring and summer rally to new highs. We have stated for some time, as long as price holds above key structural levels, this remains a broader dip-buying environment. Absent a catalyst, resistance sits at $670, $675, $676, $679, while support rests at $660, $655, $650. We favor buying dips at $660 given the oversold bounce potential from these levels. Bitcoin managed a modest 0.43% gain to close above $70,509 while MAG stocks showed mostly red action across the board led by Tesla down 3.14%, and sustained weakness across both leadership groups would be required to signal a deeper pullback. The VIX closed at 26.77, up 10.48%, suggesting elevated fear given the broad-based selling pressure and uncertainty heading into key economic data. SPY closed near the lower end of the bull trend channel from the April lows with structural support near $640.
Market State Indicator (MSI) Forecast
Current Market State Overview:
The MSI ended Thursday in a Bearish Trending Market State with SPY closing at $666.06, positioned below MSI support of the range between MSI resistance and support. Extended targets were printing below at the close around 15:45-16:00, indicating the herd was participating in the downside trend. Extended targets were also visible in premarket forecasting the day’s declines. The MSI rescaled times throughout the session, moving from higher levels around 674/672 in early morning down to final levels of 670/667 as the session continued to move the Bearish Trending State lower, with multiple rescales lower during the session as price declined. The MSI forecast for Friday calls for a strong continuation lower with the bears maintaining pressure and extended targets suggesting downside momentum will persist. Since SPY closed below MSI support, MSI support now becomes resistance for the next session at $667 with new MSI resistance at $670.
Key Levels and Market Movements:
Wednesday we stated, "Bulls want to hold current levels overnight and push toward $680," and added, "bears want to see $675.72 fail to press price toward $670," while also noting, "The positioning in MSI range creates a tactical shift where any rally back toward $678.52 becomes a shorting opportunity rather than a buying opportunity, targeting lower levels." Thursday's session delivered exactly what bears wanted as selling pressure accelerated throughout the day, taking SPY from its opening at $671.16 down to a session low of $665.87. The session started with brief strength as price initially held above $671, even touching the session high of $671.65, but sellers quickly took control and pushed price steadily lower throughout the entire trading session. With SPY closing well below the previous MSI support levels and the framework rescaling lower multiple times, this created exceptional trading opportunities for those following the MSI. Each rescale lower provided fresh short setups as the new MSI resistance levels became selling opportunities targeting the next support level below. As price broke below each successive MSI support level and held, this offered continuation short setups targeting even lower levels. The extended targets printing below throughout the afternoon confirmed the herd was participating in the downside momentum, validating the bearish bias. At minimum it was a three-for-three session for traders following the framework as the MSI rescaled lower providing a clear short setup at the new resistance level. It was a clear day to read and execute with substantial setups, all identified through proper context, patience, and flexibility while leveraging the MSI, premarket levels, and market structure rather than forcing trades. The MSI continues to prove its reliability as the cornerstone of our trading process.
Trading Strategy Based on MSI:
Friday has heavy economic data with Core PCE Price Index m/m, Prelim GDP q/q, and JOLTS Job Openings which can introduce significant volatility, so traders should be ready to trade what they see rather than predict. Bulls want to hold current levels overnight and push toward $670, while bears want to see $667 fail to press price toward $660. Given the Bearish Trending Market State at close with extended targets printing below, continuation lower is expected. Bears have control and any rally to the $667 level, which was former MSI support but now becomes resistance, is a shorting opportunity targeting lower levels. The positioning below MSI support creates a tactical shift where any bounce back toward $667 becomes a shorting opportunity rather than a buying opportunity, targeting the premarket levels since there is no MSI target below. However, if bulls can successfully reclaim and hold above $667 with conviction, this would signal a potential shift back toward the $670 resistance level and offer long setups. Friday's action is likely to see continued selling pressure, making the $667 level critical. A successful test and rejection at $667 would offer a clean short setup back toward the $665 zone, while any breakthrough and hold above $667 would present a compelling long opportunity back toward resistance at $670. The current positioning suggests Friday will test whether the overnight action can provide any relief rally or if sellers will defend the $667 resistance level and press for lower prices. A failed rally to $667 would offer a clean short setup targeting new lows, while any successful break above $667 with volume presents a compelling long opportunity toward higher levels. The long-term bull trend remains intact above $640 and failed breakouts and failed breakdowns continue to offer the highest-probability setups. Remain flexible, avoid trading during Ranging Market States unless a clear failed breakout or breakdown presents itself, and ensure all trades are fully aligned with MSI signals. Providing real-time insights into market control, momentum shifts, and actionable levels, the MSI when integrated with our Pre-Market and Post-Market Reports continues to sharpen execution precision and elevate trade quality. If you haven't yet integrated MSI and our model levels into your process, now is the time. Contact your representative to get started as these tools are designed to support consistency and enhance performance.
Dealer Positioning Analysis
Dealers are selling SPY $680 to $710 and higher strike Calls while buying $667 to $679 Calls, indicating the Dealers' desire to participate in any rally on Friday. The ceiling for Friday appears to be $689. To the downside, Dealers are buying $675 to $575 and lower strike Puts in a 4:1 ratio to the Calls they're selling/buying displaying moderate concern that prices could move lower. Dealer positioning is unchanged at bearish.
Looking Ahead to Next Friday:
Dealers are selling SPY $692 to $715 and higher strike Calls while buying $667 to $691 Calls, indicating the Dealers' desire to participate in any rally next week. The ceiling for the week appears to be $700. To the downside, Dealers are buying $666 to $520 and lower strike Puts in a 4:1 ratio to the Calls they're selling/buying displaying moderate concern that prices could move lower. For the week Dealer positioning is unchanged at bearish. We advise reviewing Dealer positioning daily for directional clues. These positions evolve quickly and tracking them is essential for staying ahead of shifting market sentiment.
Recommendation for Traders
With SPY breaking below the $666 level on heavy selling and VIX spiking 10.48% to 26.77, traders should favor defensive positioning and look for short opportunities on any bounces toward the $669-671 resistance zone. The breakdown below $666 with elevated volume suggests further downside pressure, making $660-662 the next logical target. Keep stops tight and position sizes small given the elevated volatility environment. Risk management is paramount with markets showing clear weakness across all major indices and crude oil's surge above $96 adding inflationary pressure. Stay disciplined with your risk parameters and avoid catching falling knives in this environment. Be sure to review the premarket analysis posted before 9 AM ET for any changes in the model's outlook and Dealer Positioning.
Good luck and good trading!
