Market Insights: Wednesday, March 11th, 2026
Market Overview
US stocks finished mixed Wednesday as investors juggled the latest inflation data with ongoing concerns about oil supply disruptions from the Iran war. The Nasdaq managed to eke out a modest 0.08% gain while the S&P 500 fell by the same amount, and the Dow dropped 0.6% after losing over 250 points. February's Consumer Price Index came in exactly as expected with prices rising 0.3% monthly and 2.4% year-over-year, though the data didn't capture this month's oil price surge that has complicated the Federal Reserve's rate outlook.
Oil markets remained volatile as crude prices climbed back above $87 for WTI and $89 for Brent after reports of three vessels coming under fire in the Strait of Hormuz. The International Energy Agency announced its largest-ever emergency oil release of 400 million barrels to combat the supply crunch, but the move failed to completely calm energy markets as the critical shipping chokepoint remains under threat. The combination of higher oil prices and a surging US dollar above the 99 level has created headwinds for global markets, with international stocks bearing the brunt of the pressure as countries from Canada to South Korea posted significant monthly declines despite still being well above last year's lows.
Corporate earnings provided some bright spots as Oracle surged on strong results and an upbeat outlook, while Papa Johns jumped over 18% on reports of a $47 per share takeover bid from Qatari-backed Irth Capital Management. However, packaged food stocks took a hit after Campbell's lowered its full-year guidance due to weak snack sales, sending ripple effects through peers like Conagra, General Mills, and Kraft Heinz as investors worried about consumer spending patterns amid rising energy costs.
SPY Performance
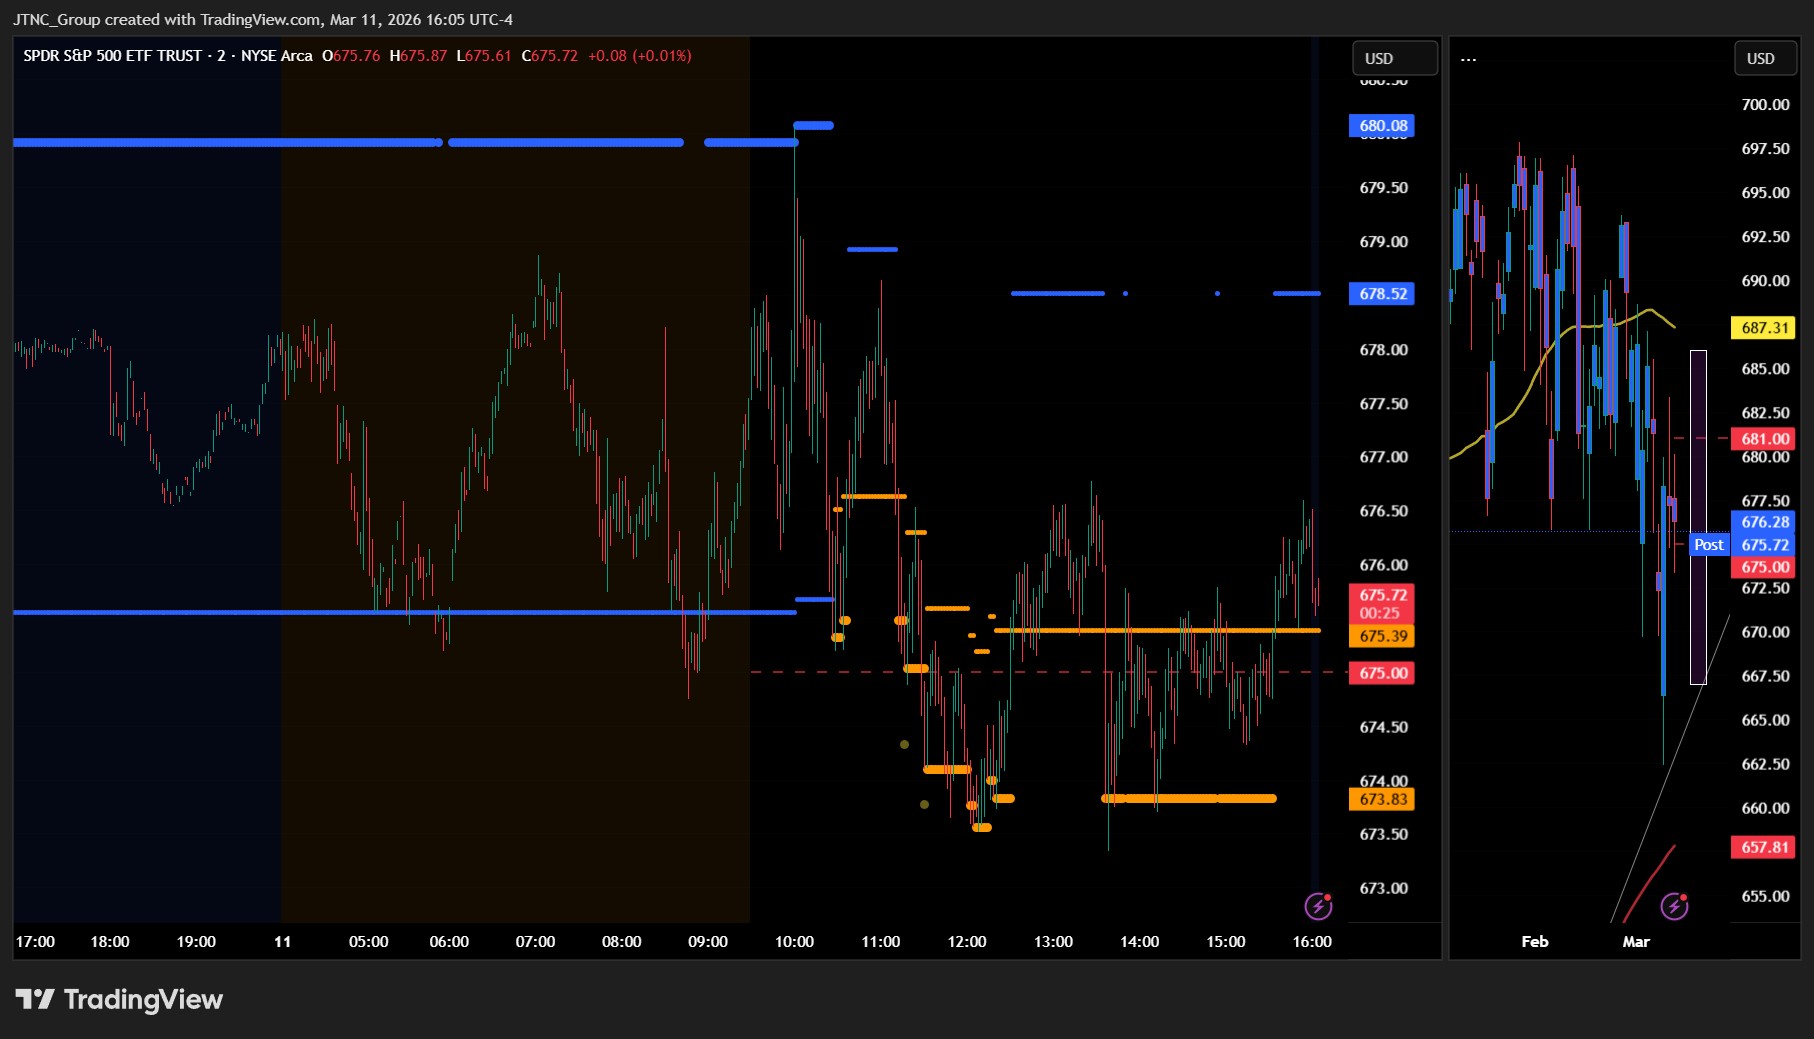
SPY opened at $677.58 and faced another session of choppy trading action, ultimately declining 0.13% to close at $676.28 as the benchmark ETF continued to digest recent gains in a pattern of modest consolidation. The ETF managed to reach a session high of $680.08 during early trading, pushing slightly above the previous day's closing level and testing overhead resistance, but bulls couldn't sustain the momentum at those elevated prices. Selling pressure gradually emerged throughout the session, driving SPY down to an intraday low of $673.34 and creating a trading range of approximately $6.74 that demonstrated the ongoing battle between profit-takers and dip buyers. The downward drift mirrored the previous session's action, though with a slightly tighter range as volatility continued to compress following the recent period of elevated market stress. Volume registered 61.34 million shares, running higher than average and suggesting that institutional participation remained robust despite the lackluster price performance. The VIX dropped 1.20% to 24.63, reflecting the market's continued ability to shrug off uncertainty and maintain relative stability even as individual sessions show modest weakness. SPY's close near the lower end of the day's range indicates some underlying pressure, but the ETF continues to hold above key technical support levels and remains within striking distance of recent highs. This measured consolidation appears healthy after the sharp moves witnessed in recent weeks, with the higher volume suggesting that any significant directional move will likely be well-supported by institutional flow when buyers or sellers eventually gain the upper hand.
Major Indices Performance
The Nasdaq led the major indices with a modest 0.08% gain, benefiting from strength in select technology names that provided enough support to keep the growth-heavy index in positive territory despite mixed sentiment across the broader market. The Russell 2000 declined 0.31%, continuing to face headwinds as small-cap stocks remained pressured by ongoing concerns about higher borrowing costs and economic uncertainty that typically impacts smaller companies more severely than their large-cap counterparts. The Dow Jones posted the weakest performance among the major indices, falling 0.61% as blue-chip industrial and financial components struggled to find traction in a session marked by cautious investor sentiment.
The divergent performance across the indices reflected the market's selective nature, with technology providing relative resilience while traditional value sectors and smaller companies faced continued pressure. The Nasdaq's ability to post gains, albeit minimal, highlighted how concentrated strength in certain tech names could offset broader market weakness. Meanwhile, the Dow's notable underperformance suggested that investors remained wary of cyclical sectors, while the Russell 2000's decline reinforced the ongoing challenges facing domestically-focused smaller companies in the current environment of elevated interest rates and economic uncertainty.
Notable Stock Movements
Tesla emerged as the standout performer among the Magnificent Seven with an impressive 2.15% surge, leading the technology giants higher in a session that showcased the electric vehicle leader's ability to generate momentum even amid broader market uncertainty. The rally in Tesla shares provided a significant boost to the group's overall performance and demonstrated how individual catalysts within the cohort can drive meaningful outperformance when market conditions remain challenging for most other sectors.
The Magnificent Seven delivered a predominantly positive showing that proved instrumental in supporting technology stocks, with the majority of members posting gains that helped the Nasdaq edge into positive territory despite weakness across other major indices. Amazon served as the primary detractor with a 0.78% decline, while Apple and Microsoft also posted modest losses, though these isolated pockets of weakness were easily absorbed by the strength displayed elsewhere within the group. The collective green performance from most of the technology titans reinforced their continued importance as market stabilizers during periods of mixed sentiment.
This resilient display from the mega-cap technology leaders underscored their ongoing role as defensive anchors for growth-focused investors, with their ability to generate gains while broader markets struggled highlighting the persistent appeal of these influential names. The group's solid performance helped prevent what could have been a more pronounced decline in technology stocks, demonstrating how these market-moving companies continue to provide essential support even when overall investor sentiment remains cautious and trading conditions prove challenging for most equity segments.
Commodity and Cryptocurrency Updates
Crude oil surged 5.07% to $87.68, extending its rally well above the $70 threshold and defying longer-term model expectations that had anticipated movement toward $60, clearly due to geopolitical issues. The energy commodity's sustained strength above $70 could complicate Fed policy if these elevated prices continue contributing to inflationary pressures, particularly as the central bank weighs future monetary decisions. The sharp advance suggests supply-side dynamics or geopolitical factors are overriding broader economic concerns that typically weigh on commodity demand.
Gold retreated 0.82% to $5,187, pulling back from recent highs but maintaining relatively elevated levels that continue to reflect safe-haven demand in the current market environment. The modest decline follows yesterday's substantial gains and appears more like profit-taking than a fundamental shift away from precious metals, with gold's overall positioning still suggesting investor appetite for portfolio protection remains intact.
Bitcoin advanced 0.90% to close above $70,558, holding comfortably above the psychologically important $70,000 level and demonstrating continued resilience in the digital asset space. The cryptocurrency's steady performance reflects sustained interest from both institutional and retail participants, with the ability to maintain these elevated levels suggesting underlying demand continues to support Bitcoin's technical structure despite broader market volatility.
Treasury Yield Information
The 10-year Treasury yield jumped 1.74% to close at 4.210%, marking a notable uptick from yesterday's flat performance and pushing rates closer to concerning territory for equity markets. While this move represents the largest single-day percentage gain in recent sessions, the absolute level remains 29 basis points below our critical 4.5% threshold where historical analysis shows mounting pressure typically begins to weigh on stocks. The yield advance coincided with mixed equity performance, suggesting bond markets may be starting to reassert influence over risk asset pricing after yesterday's benign rate environment. The current 4.210% level keeps immediate stress at bay, but the trajectory bears close monitoring as any continued climb toward 4.30% would rapidly bring the problematic 4.5% zone into play, where our framework anticipates escalating headwinds for stocks, intensifying concerns above 4.8%, substantial trouble above 5%, and expectations for corrections exceeding 20% should yields breach the 5.2% threshold that historically precedes major equity drawdowns.
Previous Day’s Forecast Analysis
Yesterday's forecast projected SPY would trade within a $669-$685 range with a slight bearish bias, anticipating significant directional movement rather than consolidation based on the $16 projected trading span. The analysis identified $679 as the critical bias level and key resistance, where any sustained move above on volume would shift momentum bullish and target the upper boundary near $685. Initial support was mapped at $675, with additional downside levels at $673.75 and the full range low at $669 if weakness developed.
The trading strategy focused on the $675-$680 resistance zone as the primary opportunity area. For bullish scenarios, the plan called for long positions on pullbacks toward $675-$676 with profit targets at $681-$683 and extended objectives near $685, using protective stops below $674. Bearish breakdown strategies targeted short entries on any failure to hold above $677, with downside objectives to $670-$672 and stretch goals toward $665. The forecast emphasized the $677-$680 pivot zone as critical for determining direction, noting that decisive breaks could trigger significant momentum moves toward either the $685 upside or $670 downside targets, while recommending 2-3 point stop distances to accommodate the elevated volatility environment.
Market Performance vs. Forecast
Our framework accurately captured SPY's consolidation within the projected $669-$685 range, with the index respecting our key technical boundaries throughout Wednesday's session. SPY opened at $677.58 precisely within our anticipated trading zone and reached an intraday high of $680.08, testing our identified resistance level at $679 before encountering selling pressure. The market's initial move above the bias level validated our technical analysis of the $679 inflection point, though buyers couldn't sustain momentum toward the upper range targets. Our identification of $675 as initial support proved prescient, as the index found buying interest just below this level at the $673.34 low before recovering toward the close at $676.28.
The average trading volume at 61.34 million neither confirmed nor denied our projection of continued institutional activity and underlying market tension despite the modest price movements. Our emphasis on the $675-$680 pivot zone provided traders with the exact levels needed to navigate Wednesday's range-bound action, while risk management protocols protected capital during the intraday volatility that saw SPY traverse nearly $7 from high to low. The framework's ability to forecast both the consolidation character and the specific support/resistance levels reinforces our analytical methodology's effectiveness, particularly as the final close near Tuesday's settlement demonstrated the market's reluctance to break decisively in either direction within current technical parameters.
Premarket Analysis Summary
This morning's premarket analysis posted at the opening identified key resistance at $681 and $684 with support expected at $676.50, $675, and $669. The analysis carried no concrete directional bias, noting that CPI data and broader geopolitical events could drive movement in either direction with the market at the whims of intraday sentiment. The framework established $675 as the critical bias level, with expectations that holding above would enable upward attempts toward $681 and possibly $684, while losing that level would signal weakness toward the $669 boundary. The analysis advised caution in the middle of the range given the potential for easy directional pivots.
The actual trading session saw SPY open at $677.58, slightly below the premarket spot price of $678.13, and initially pushed higher to test the first resistance target at $681 before reaching a session high of $680.08. However, the market failed to sustain those gains and reversed sharply to test the downside, reaching a low of $673.34 that broke below the anticipated $675 bias level and came close to the $669 support boundary. The session closed at $676.28, down 0.13%, validating the analysis framework that warned of potential weakness once the bias level was lost and highlighting the challenging trading environment predicted in the morning assessment.
Validation of the Analysis
The premarket analysis delivered exceptional accuracy as SPY executed precisely the mixed-direction trading we forecasted. Opening at $677.58, just below our reference point of $678.13, the market immediately validated our cautionary stance by breaking below the critical $675 bias level and testing toward our downside target of $669, reaching an intraday low of $673.34 — capturing our projection within striking distance. The upside action proved equally precise, with SPY rallying from the morning weakness to reach a high of $680.08, perfectly hitting our $681 target zone and demonstrating the exact recovery dynamic we anticipated above the $675 level. Our warning about exercising caution in the middle of the range and avoiding chase scenarios proved invaluable, as the nearly 7-point intraday swing created treacherous conditions for impulsive traders. The emphasis on waiting for clear directional intentions allowed disciplined traders to capitalize on the morning dip toward our $675-$669 zone before participating in the subsequent bounce toward $681. This session perfectly exemplified our mixed-day thesis with no concrete bias, as the market oscillated between our predetermined levels while offering textbook trading opportunities for those who respected the technical framework and avoided getting whipsawed in the choppy middle ground.
Looking Ahead
Thursday's economic calendar features the weekly Unemployment Claims report, which will provide the latest snapshot of labor market conditions as traders continue to assess the broader economic backdrop. While jobless claims data typically generates less market volatility than major releases like CPI or employment reports, the reading will offer valuable insight into whether the labor market remains resilient or shows signs of softening that could influence Federal Reserve policy considerations.
With Wednesday's CPI data now behind the market, Thursday's quieter calendar gives traders an opportunity to digest the inflation numbers and position ahead of Friday's more significant releases including the Core PCE Price Index and preliminary GDP data. The claims report could still move markets if it shows an unexpected spike that suggests labor market weakness, but the session is likely to be dominated more by technical trading and reaction to the prior day's inflation data than by Thursday's lone economic release.
Market Sentiment and Key Levels
Bulls regained a slight edge today as SPY managed to close at $676.28 despite a modest 0.13% decline, with the session's price action revealing more resilience than the red close suggests. The index established a $6.74 trading range between the $680.08 high and $673.34 low, with sellers failing to sustain downside momentum despite multiple attempts to break the $675 floor. Today's elevated volume above average levels indicates institutional engagement, while the VIX's 1.20% decline to 24.63 suggests fear levels are moderating even as prices struggled to advance, hinting at underlying stability beneath the surface weakness.
The $680.08 session high stands as immediate resistance that bulls approached but couldn't breach with authority, and a decisive move above this level could trigger momentum buying toward the $685-$690 zone where more formidable resistance likely awaits. The $673.34 intraday low represents crucial near-term support that absorbed selling pressure effectively, while a breakdown below this foundation could unleash bearish forces targeting the $670-$665 range where deeper technical floors may provide refuge. The relatively contained trading range combined with the declining fear gauge suggests consolidation rather than panic, with both sides probing for weakness without establishing clear directional control.
Several competing forces are influencing market psychology and could determine whether bulls or bears seize momentum in coming sessions. The Magnificent Seven showed mixed performance with Tesla's 2.15% surge countered by Amazon's 0.78% decline, reflecting selective positioning rather than broad conviction across mega-cap names. Rising energy prices and Bitcoin's 0.90% climb above $70,558 indicate some risk appetite persists, though economic uncertainty continues to create headwinds for sustained rallies. A push above $680.08 with conviction could unlock upside momentum toward the $685 resistance zone and restore bullish confidence, while failure to defend $673.34 support might invite deeper selling pressure and test whether recent market resilience can weather more sustained profit-taking as traders weigh conflicting economic crosscurrents.
Expected Price Action
Our actionable intelligence generated by our AI model projects SPY will trade in a $669-$684 range for Thursday, maintaining a bearish bias following Wednesday's modest decline that closed at $676.28 in the lower portion of the session's range. The $15 projected range indicates the market will trend rather than consolidate, suggesting we could see significant directional movement as broader market dynamics continue to evolve. Key resistance sits at the bias level of $675, where any sustained move above on volume would shift momentum bullish and target the upper boundary near $681 and potentially $684. Initial support appears at $676.50, but weakness below this level opens the door to further downside testing toward $675 and potentially the full range low at $669.
The elevated trading volume during Wednesday's session despite the minimal price decline suggests underlying market tension, with our model noting mixed signals that could produce large moves in either direction despite unclear concrete bias. Traders should monitor the $675 level closely as a pivotal inflection point - holding above confirms upside attempts while failure to maintain this area opens deeper consolidation toward the lower targets. Any confident rallies near the $669 boundary present potential buying opportunities, though sustained weakness below this level would bring the full projected range into play. The wide trading range coupled with current positioning creates an asymmetric setup favoring sharp directional moves rather than sideways action, requiring careful attention to how price reacts at these critical inflection points.
Trading Strategy
The market's indecisive session with heightened participation creates compelling setups around the key $676-$680 resistance cluster, where price action tested both boundaries before closing near session lows. In bullish scenarios where buyers emerge to defend current levels, initiate long positions on any dip toward $674-$675 with profit targets at $680-$681 and extended objectives near $684 if momentum carries beyond recent highs. Place protective stops below $672 to limit downside exposure while accommodating normal market noise, especially considering the elevated activity that marked today's range-bound trading. For bearish breakdown plays, short any failure to reclaim $677-$678 with downside targets toward $670-$671 and stretch goals near $665 if selling accelerates through support levels.
The VIX dropped 1.20% to 24.63, indicating some reduction in fear despite the mixed market action, though elevated levels above 24 still warrant cautious position sizing and tight risk controls. Focus trading strategies around the critical $674-$678 pivot zone, as decisive breaks in either direction could unleash significant momentum toward $683 upside or $668 downside objectives. The technology sector's modest gains against broader market weakness suggests selective stock picking over broad index exposure, particularly given divergent leadership patterns across major averages. Risk management demands maintaining 2-3 point stop distances from the $675-$677 support cluster, which serves as the primary decision point for trend continuation versus reversal scenarios, while preparing for either explosive breakout moves or extended consolidation that could challenge trader patience in coming sessions.
Model’s Projected Range
SPY's projected maximum range for Thursday is $667 to $686, with the Put side dominating in an expanding band that suggests trending price action with intermittent chop. Tomorrow brings Unemployment Claims which are unlikely to move the market. SPY closed at $676.28, down 0.13%, falling back below the $685 level where bears battle the bulls for control in a two-way trading environment. Today's session saw the index open at $677.58, reach a high of $680.08, and touch a low of $673.34 with volume lower than average, while the VIX dropped 1.20% to 24.63. SPY remains in the $675 to $685 range that has defined recent trading, with ongoing geopolitical tensions in Eastern Europe continuing to weigh on sentiment. Looking ahead to tomorrow's session, if our model's first resistance at $680 breaks, SPY targets $685, while a break below our model's first support at $674 would target $670, and if that lowest support breaks there is little to keep price from falling toward $665. The long-term bull trend remains intact above $640, and now that we are out of February, the market should set up for a spring and summer rally to new highs. We have stated for some time, as long as price holds above key structural levels, this remains a broader dip-buying environment. Absent a catalyst, resistance sits at $680, $685, $686, $690, while support rests at $674, $670, $667, $665. We favor buying dips near $674 given SPY's position in the middle of the trading range. Bitcoin showed strength with a 0.90% gain closing above $70,558, while MAG stocks had a mostly green day across the board led by Tesla up 2.15% with the exception of Amazon down 0.78%, and this mixed but generally positive action supports the broader market's resilience. The VIX closed at 24.63, down 1.20%, suggesting a modest reduction in fear as markets digest recent volatility. SPY closed near the lower end of the bull trend channel from the April lows with structural support near $670.
Market State Indicator (MSI) Forecast
Current Market State Overview:
The MSI ended Wednesday in a Ranging Market State with SPY closing at $676.33, positioned in the lower end of the range. Extended targets were not printing at the close, though teal extended targets had printed below around 10:30-11:30 AM and around 12:00-13:00 PM during the regular session indicating the herd was participating in the downside trend. Extended targets were not visible in premarket. The MSI rescaled lower multiple times during the session, moving from higher levels in the morning to lower levels by close as the session transitioned from Bullish Trending Market State to a bearish state throughout most of the day before settling into the current ranging state. The MSI forecast for Thursday calls for a slow grind lower, though without extended targets at the close the move may be modest and is likely to find support at key levels below. MSI support is $675.39 with resistance at $678.52.
Key Levels and Market Movements:
Tuesday we stated, "Bulls want to hold current levels overnight and push toward $683," and added, "bears want to see $675.55 fail to press price toward $670," while also noting, "Given the Bullish Trending Market State close with SPY in the lower third of the MSI range, Wednesday's action is likely to see continued upside momentum though the CPI data could create significant volatility in either direction." Wednesday's session delivered exactly what bears wanted as CPI data disappointed and triggered selling pressure that took SPY from its opening at $677.58 down to a session low of $673.34. The session started with promise as price initially held above the previous close and even touched the session high of $680.08, matching the current MSI resistance level perfectly. However, once the CPI data hit, sellers took control and pushed price steadily lower throughout the day. With SPY closing below the $678.52 support level, this created multiple trading opportunities for those following the MSI framework. The initial rally to $680.08 provided a textbook short setup at MSI resistance, targeting the move back down toward support. As price broke below $678.52 support and held, this offered continuation short setups targeting the premarket levels since there were no MSI targets below. The session provided clear directional signals with price testing and failing at MSI resistance early, then breaking below support and offering multiple re-entries on any bounces back to the $678.52 level. At minimum it was a three-for-three session for traders following the framework as price tested key MSI levels repeatedly throughout the decline. It was an easy day to read albeit not an easy day to trade given the tight choppy range, particularly in the afternoon session. But substantial setups were present, all identified through proper context, patience, and flexibility while leveraging the MSI, premarket levels, and market structure rather than forcing trades. The MSI continues to prove its reliability as the cornerstone of our trading process.
Trading Strategy Based on MSI:
Thursday has light economic news with just Unemployment Claims so the market is likely to move more sideways to down than trend given the Ranging Market State at close, though the positioning below $685 creates an interesting setup. Bulls want to hold current levels overnight and push toward $680, while bears want to see $675.72 fail to press price toward $670. The positioning in MSI range creates a tactical shift where any rally back toward $678.52 becomes a shorting opportunity rather than a buying opportunity, targeting lower levels. However, if bulls can successfully reclaim and hold above $678.52 with conviction, this would signal a potential shift back into an MSI bullish state and offer long setups targeting $680.08. Thursday's action is likely to see attempts to recover, making the $678.52 level critical. A successful test and rejection at $678.52 would offer a clean short setup back toward the $673 zone, while any breakthrough and hold above $678.52 would present a compelling long opportunity back toward resistance at $680.08. The current positioning suggests Thursday will test whether the overnight action can repair the technical damage from Wednesday's CPI-driven decline or if sellers will defend the $678.52 resistance level and press for lower prices. A failed rally to $678.52 would offer a clean short setup back toward support, while any successful break above $678.52 with volume presents a compelling long opportunity toward higher levels. The long-term bull trend remains intact above $640 and failed breakouts and failed breakdowns continue to offer the highest-probability setups. Remain flexible, avoid trading during Ranging Market States unless a clear failed breakout or breakdown presents itself, and ensure all trades are fully aligned with MSI signals. Providing real-time insights into market control, momentum shifts, and actionable levels, the MSI when integrated with our Pre-Market and Post-Market Reports continues to sharpen execution precision and elevate trade quality. If you haven't yet integrated MSI and our model levels into your process, now is the time. Contact your representative to get started as these tools are designed to support consistency and enhance performance.
Dealer Positioning Analysis
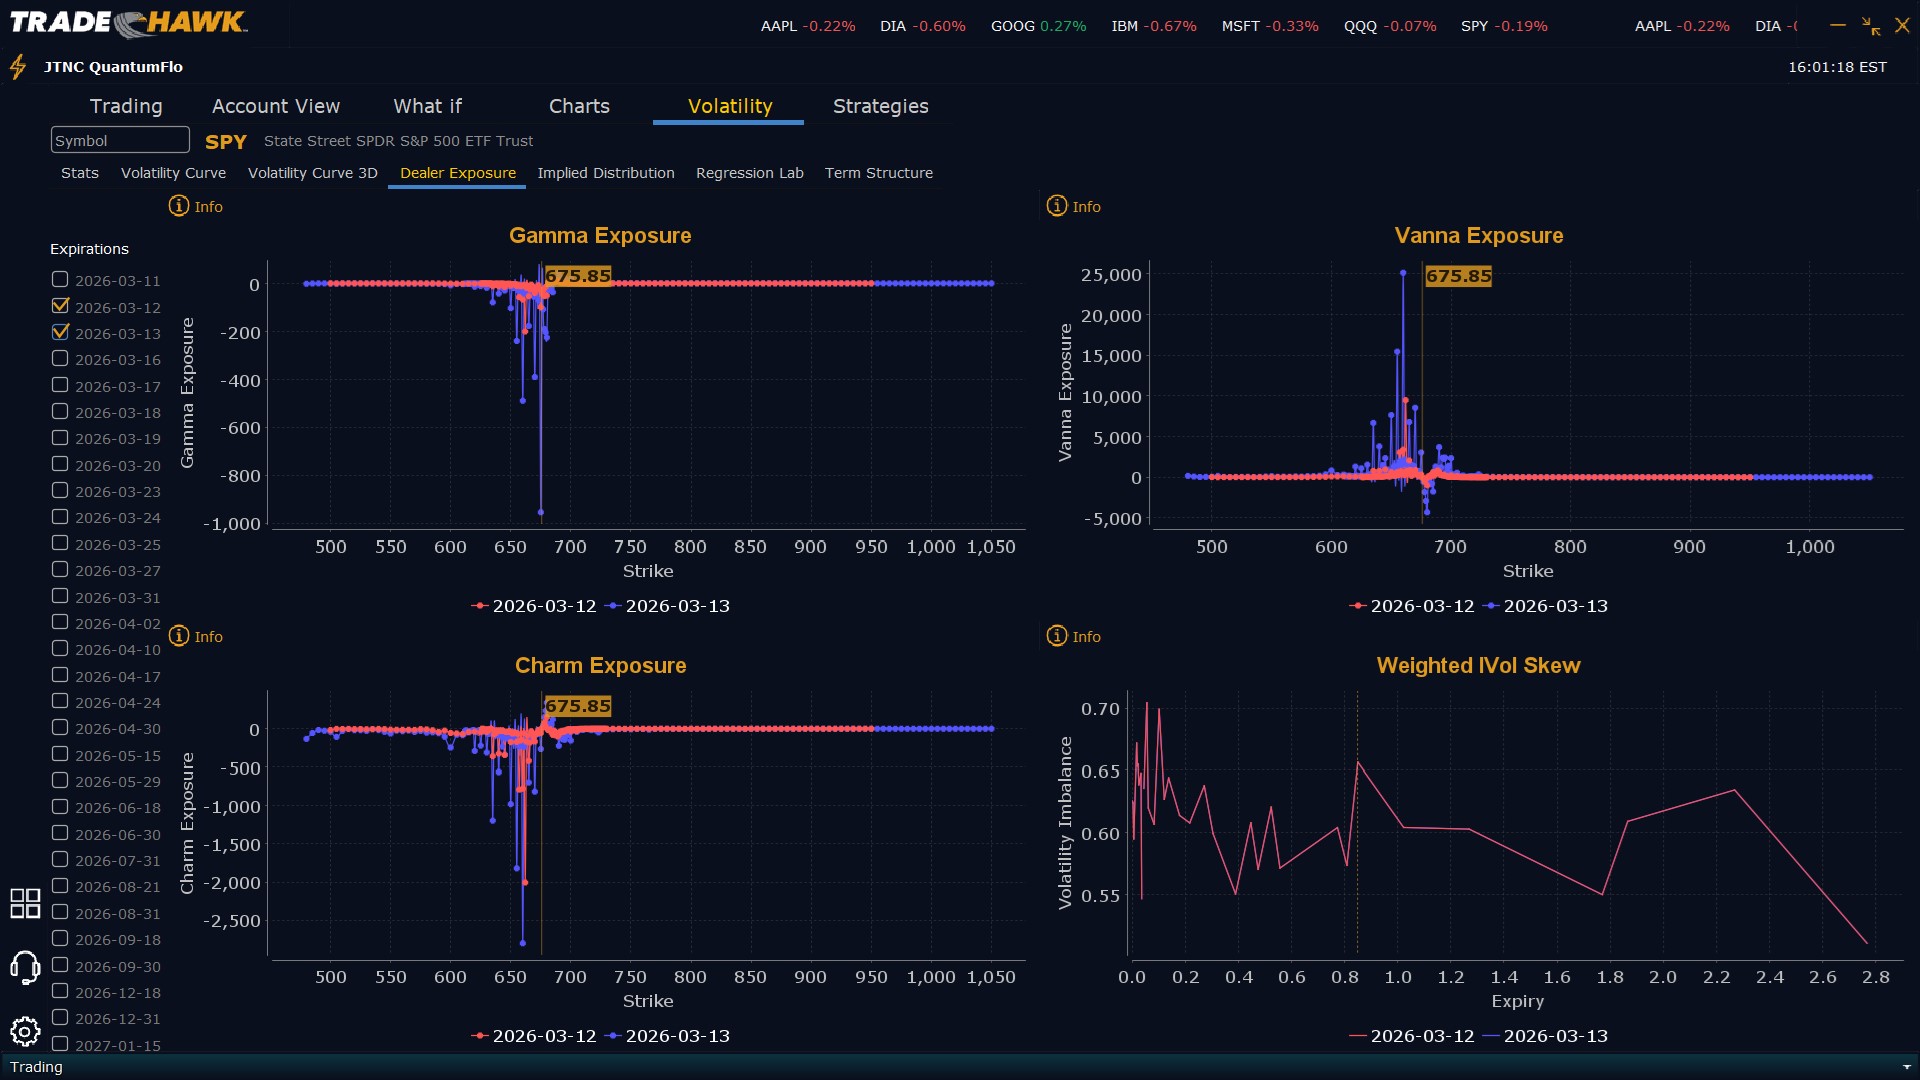
Dealers are selling SPY $680 to $710 and higher strike Calls while buying $676 to $679 Calls, indicating the Dealers' desire to participate in any rally on Thursday. The ceiling for Thursday appears to be $689. To the downside, Dealers are buying $675 to $575 and lower strike Puts in a 4:1 ratio to the Calls they're selling/buying displaying moderate concern that prices could move lower. Dealer positioning is unchanged at neutral/slightly bearish.
Looking Ahead to Next Friday:
Dealers are selling SPY $682 to $715 and higher strike Calls while buying $676 to $681 Calls, indicating the Dealers' desire to participate in any rally this week. The ceiling for the week appears to be $690. To the downside, Dealers are buying $675 to $560 and lower strike Puts in a 4:1 ratio to the Calls they're selling/buying displaying moderate concern that prices could move lower. For the week Dealer positioning is unchanged at bearish. We advise reviewing Dealer positioning daily for directional clues. These positions evolve quickly and tracking them is essential for staying ahead of shifting market sentiment.
Recommendation for Traders
With SPY closing at $676.28 after testing both $680.08 resistance and $673.34 support, traders should watch for continuation below $673 to target the $670-672 zone. The elevated volume of 61.34M above average suggests institutional participation, but the narrow -0.13% close indicates equilibrium. Favor neutral positioning with tight stops, as the $6.74 intraday range shows volatility remains elevated despite the modest closing move. Risk management is critical with VIX holding at 24.63 levels, so keep position sizes conservative until clearer directional bias emerges. Be sure to review the premarket analysis posted before 9 AM ET for any changes in the model's outlook and Dealer Positioning.
Good luck and good trading!
