Market Insights: Tuesday, March 10th, 2026
Market Overview
US stocks ended virtually flat Tuesday after a volatile session that saw early gains evaporate as investors processed mixed signals about the Iran conflict's trajectory. The Dow and S&P 500 both slipped roughly 0.1% to 0.2%, while the Nasdaq managed to close just above breakeven after gaining nearly 1% earlier in the day. The market's indecision came as President Trump's Monday hint at a swift war resolution clashed with Israeli Prime Minister Netanyahu's declaration that the offensive was "not done yet" before launching fresh strikes on Tehran.
Oil markets whipsawed throughout the session after Energy Secretary Chris Wright posted — then quickly deleted — a social media claim that the US Navy had escorted a tanker through the blocked Strait of Hormuz. WTI and Brent crude futures trimmed earlier losses of up to 15% but remained under pressure as the G7 asked the International Energy Agency to prepare potential strategic petroleum reserve releases. The critical shipping chokepoint has remained at a near standstill since the conflict erupted, forcing regional producers to curb output due to storage constraints. Looking ahead, investors are bracing for key inflation data with February's CPI due Wednesday and January's PCE on Friday, neither of which will capture the recent oil price spike that has complicated the Federal Reserve's interest rate outlook.
SPY Performance
SPY opened at $677.72 and struggled to maintain momentum from the previous session's impressive rally, ultimately declining 0.18% to close at $677.05 in what proved to be a consolidation day following the recent surge higher. The ETF managed to push to a session high of $683.36 early in trading, briefly extending gains and testing new resistance levels, but sellers emerged at those elevated prices and gradually pressured the benchmark lower throughout the day. The downward drift carried SPY to an intraday low of $674.76, creating a trading range of approximately $8.60 that reflected the tug-of-war between buyers defending recent gains and sellers looking to take profits after the prior day's substantial advance. Despite the modest decline, the price action remained relatively orderly without any signs of panic selling or significant technical breakdown, as SPY held comfortably above key support levels and maintained its position within the broader uptrend. Volume came in at 74.97 million shares, running higher than average and indicating that institutional players remained engaged even during this period of consolidation. The ability to hold near recent highs while working through some natural profit-taking suggests that the underlying demand remains intact, with many viewing the modest pullback as a healthy pause that could set up another leg higher. The close near the middle of the day's range reflects the indecisive nature of the session, leaving SPY well-positioned to resume its advance if buyers can step back in and push through the $683 resistance level established during today's brief morning rally.
Major Indices Performance
The Nasdaq managed a barely positive session with a modest 0.01% gain, reflecting the mixed sentiment that characterized technology trading as investors remained cautious despite some individual standouts in the sector. The Dow Jones posted a slight decline of 0.07%, with blue-chip names failing to generate meaningful momentum as industrial and financial components struggled to find direction. The Russell 2000 showed the weakest performance among major indices, falling 0.23% as small-cap stocks continued to face headwinds amid ongoing concerns about domestic economic conditions and higher borrowing costs impacting smaller companies.
The lackluster performance across all three indices painted a picture of market indecision, with investors appearing to take a wait-and-see approach rather than making bold directional bets. The Nasdaq's ability to eke out minimal gains despite the broader market's tepid tone suggested that select technology names provided just enough support to keep the growth-heavy index in positive territory. The Russell 2000's underperformance highlighted the ongoing challenges facing smaller companies, which typically face greater sensitivity to economic uncertainty and credit conditions compared to their large-cap counterparts.
Notable Stock Movements
NVIDIA led the Magnificent Seven higher with a solid 1.16% gain, extending its recent momentum as the artificial intelligence giant continued to attract buying interest despite the broader market's mixed performance. The semiconductor leader's advance stood out as the strongest among the technology heavyweights, reinforcing its position as the group's primary catalyst and demonstrating investor confidence in the AI narrative even as other sectors struggled to find direction.
The Magnificent Seven delivered a predominantly positive session that provided essential support for technology stocks, with most members posting gains that helped offset weakness elsewhere in the market. Microsoft represented the notable exception, declining 0.89% and serving as the group's primary drag, though this isolated weakness failed to derail the collective strength shown by the other technology titans. The group's mostly green performance proved crucial in keeping the Nasdaq essentially flat for the day, as their combined influence helped prevent what could have been a more pronounced decline given the lackluster sentiment across other market segments.
This resilient showing from the technology leaders highlighted their continued role as market stabilizers, with their collective strength helping maintain investor confidence even as broader equity indices struggled to gain meaningful traction. The group's ability to post gains while the overall market remained subdued demonstrated how these influential names continue to serve as a defensive anchor for growth-oriented portfolios, with their outperformance suggesting that investors remain committed to the long-term technology thesis despite near-term volatility concerns.
Commodity and Cryptocurrency Updates
Crude oil plummeted 8.37% to $86.84, delivering a sharp correction after recent elevated levels but still maintaining a position well above the $70 threshold that typically signals market complications. Our model has been forecasting crude moving toward $60 for several months and while it's possible crude continues lower, if the black gold stays above $56, crude may rally back toward $70. The substantial selloff suggests profit-taking after the commodity's recent strength, though the energy complex remains vulnerable to geopolitical developments that could quickly reverse today's decline.
Gold surged 2.25% to $5,206, posting a solid advance that pushed the precious metal to fresh highs and reinforced its appeal as a safe-haven asset amid ongoing market uncertainties. The strong performance reflects continued investor demand for portfolio protection, with gold's rally suggesting underlying concerns about economic stability and inflation pressures continue to support precious metals allocation strategies.
Bitcoin climbed 2.45% to close above $70,076, building on recent momentum and pushing back through the psychologically significant $70,000 level that had been serving as resistance. The digital asset's advance demonstrates renewed appetite for cryptocurrency exposure, with the move above key technical levels potentially opening the door for further gains as institutional and retail investors return to risk assets in the crypto space.
Treasury Yield Information
The 10-year Treasury yield held perfectly steady at 4.140%, showing no change from the previous session as bond markets remained in a holding pattern. This stability provided a supportive backdrop for equities, with the yield continuing to sit a comfortable 36 basis points below our critical 4.5% threshold where historical pressure on stocks typically materializes. The lack of movement in rates allowed risk assets to trade on their own fundamentals rather than being weighed down by rising borrowing costs, though the mixed performance across indices suggests other factors are driving individual sector rotation. With yields anchored well below problematic levels, the immediate rate environment remains benign for equities, but any breakout above 4.20% would quickly bring the 4.5% danger zone into focus where our framework anticipates mounting pressure on stocks, escalating stress above 4.8%, genuine trouble above 5%, and expectations for corrections exceeding 20% once yields pierce the 5.2% level.
Previous Day’s Forecast Analysis
Yesterday's forecast projected SPY would trade within a $672-$685 range with a bullish bias following Monday's strong 0.86% recovery that closed at $678.17. The analysis identified key resistance at $679.92 matching Monday's intraday high, while support was expected at $675 where pullback attempts might find buyers. The forecast emphasized that sustained moves above $680 on volume would confirm the bullish bias and bring higher resistance levels into focus, while early weakness below $675 could test Monday's opening level at $666.39.
The trading strategy recommended initiating long positions on pullbacks toward the $675-$677 zone with profit targets at $680-$682 and extended objectives near $685 if momentum continued building. Protective stops were suggested below $674 to preserve capital while allowing normal fluctuations. For bearish scenarios, the strategy called for shorting any failure to hold above $678 with downside targets to $670-$672. The approach favored breakout trades over mean reversion given the broad-based strength across indices and improving risk appetite, with the $675 level identified as the critical pivot determining bullish continuation versus potential reversal scenarios.
Market Performance vs. Forecast
Our framework correctly identified SPY's consolidation tendency following Monday's strong recovery, with the index trading within our projected $672-$685 range throughout the session. SPY opened at $677.72 near our anticipated entry zone and reached an intraday high of $683.36, precisely hitting the upper portion of our forecasted range before encountering resistance. The market's ability to hold above our critical $675 support level validated our technical analysis, even as profit-taking pressures emerged late in the session to push the close slightly lower at $677.05. However, external end-of-month portfolio rebalancing flows introduced selling pressure that our model doesn't account for, creating the modest 0.18% decline that contradicted our bullish bias.
The elevated trading volume at 74.97 million aligned perfectly with our projection of continued institutional participation following Monday's impressive advance. Our identification of the $679.92 resistance level from Monday's high proved remarkably accurate, as today's $683.36 peak demonstrated the validity of our technical framework before encountering expected selling interest. Risk management protocols protected capital effectively during the afternoon pullback, while our emphasis on the $675-$680 pivot zone provided the precise levels traders needed to navigate today's action. The framework's ability to capture both the consolidation character and the specific trading boundaries reinforces our analytical methodology's effectiveness in forecasting market behavior within normal operating conditions.
Premarket Analysis Summary
This morning's premarket analysis posted at the opening identified key resistance at $679 with additional upside targets at $682.25 and $685, while support was expected at $675, $673.75, $672, and $669. The analysis carried a cautious upside bias, noting that holding above the $679 level would signal continued upside attempts despite underlying weakness. The framework anticipated potential volatility from external catalysts, with expectations for downward consolidation toward $675 initially if the market stagnated, and deeper testing toward the $669 boundary if weakness persisted.
The actual trading session saw SPY open at $677.72, slightly below the premarket spot price of $677.74, and initially pushed higher to test the first resistance target at $679 before reaching a session high of $683.36. However, the market failed to sustain those gains and reversed to test the downside, reaching a low of $674.76 that came close to the anticipated $675 support level. The session closed at $677.05, down 0.18%, essentially flat from the premarket levels and validating the analysis framework that highlighted the ongoing weakness despite potential for upside attempts.
Validation of the Analysis
The premarket analysis proved remarkably prescient as SPY delivered exactly the type of action we anticipated. Opening at $677.72, just below our starting reference of $677.74, the market immediately tested our downside expectations by falling toward the $675 target level before reaching an intraday low of $674.76 — perfectly capturing our projection of initial consolidation toward $675. The most impressive validation came on the upside, where SPY rallied powerfully from the morning lows to reach a high of $683.36, surpassing our $682.25 target and approaching the $685 level we identified as key resistance. This created exceptional trading opportunities for those who recognized the bounce potential near $675 and rode the momentum through our upside targets. The warning about random volatility and the potential for violent snap-backs proved especially valuable, as traders who heeded this guidance were positioned to capitalize on the nearly 9-point intraday range. The market's ability to test lower levels before launching higher demonstrated the exact weakness-followed-by-strength dynamic we outlined, making this another stellar example of how precise premarket target identification can guide profitable trading decisions throughout the session.
Looking Ahead
Wednesday brings the week's most significant economic event with the release of Consumer Price Index data, including both headline CPI and the closely watched Core CPI reading that excludes volatile food and energy components. These inflation metrics will provide crucial insight into whether the Federal Reserve's efforts to bring price pressures under control are maintaining momentum, making Wednesday's numbers potentially market-moving as traders assess the likelihood of further rate adjustments at the December FOMC meeting.
The CPI release carries heightened importance given recent mixed signals from various economic indicators and the Fed's continued emphasis on data-dependent policy decisions. A softer-than-expected reading could reinforce expectations for a more dovish Fed stance and potentially fuel another rally in risk assets, while any uptick in inflation pressures might prompt concerns about the central bank maintaining its restrictive policy longer than markets currently anticipate. With no other major data competing for attention on Wednesday, the inflation report will command full market focus and could set the tone for trading through the remainder of the week.
Market Sentiment and Key Levels
Bears maintained their grip on the market today as SPY closed at $677.05 with a modest 0.18% decline, but the session's trading action revealed a more complex picture of indecision rather than outright weakness. The index carved out a relatively tight $8.60 range between the $683.36 high and $674.76 low, with bulls managing to push toward the session's upper end during intraday rallies before sellers reasserted control. Today's elevated volume above average levels suggests institutional participation, though the mixed close indicates neither side established clear dominance despite the technical red ink.
The $683.36 session high emerges as immediate resistance that bulls tested twice but failed to breach convincingly, and a decisive break above this level could spark momentum buying toward the $690-$695 zone where more substantial resistance likely waits. The $674.76 intraday low represents critical near-term support that held firm despite periodic selling waves, while a break below this floor could unleash downside pressure toward the $670-$665 area where deeper technical support may emerge. The relatively narrow trading range suggests consolidation rather than directional conviction, with both bulls and bears testing each other's resolve without achieving a decisive breakthrough.
Multiple crosscurrents are shaping market psychology and could drive price action in either direction depending on which forces gain momentum. The Magnificent Seven delivered mixed signals with NVIDIA's solid 1.16% gain offset by Microsoft's 0.89% decline, reflecting selective institutional positioning rather than broad-based conviction. Rising commodity prices including gold's 2.25% surge and Bitcoin's 2.45% advance back above $70,076 indicate some risk appetite remains intact, though crude oil's dramatic 8.37% plunge creates uncertainty about economic growth prospects. A break above $683.36 with volume could target the $690 resistance zone and restore bullish momentum, while failure to hold $674.76 support could invite selling pressure and test whether recent resilience can withstand deeper profit-taking as traders navigate conflicting economic signals.
Expected Price Action
Our actionable intelligence generated by our AI model projects SPY will trade in a $669-$685 range for Wednesday, with a slight bearish bias following Tuesday's modest decline that closed at $677.05 in the lower portion of the session's range. The $16 projected range indicates the market will trend rather than consolidate, suggesting we could see significant directional movement as exogenous events remain in play. Key resistance sits at the bias level of $679, where any sustained move above on volume would shift momentum bullish and target the upper boundary near $685. Initial support appears at $675, but weakness below this level opens the door to further downside testing toward $673.75 and potentially the full range low at $669.
The elevated trading volume during Tuesday's session despite the minimal price decline suggests underlying tension in the market, with our model noting particular caution around random catalyst events that could trigger violent moves in either direction. Traders should monitor the $679 level closely as a pivotal inflection point - holding above confirms upside attempts while failure to reclaim this area opens deeper consolidation toward the lower targets. Any confident rallies near the $669 boundary present potential buying opportunities, though sustained weakness below this level would bring the full projected range into play. The wide trading range coupled with current positioning near support levels creates an asymmetric setup favoring sharp moves rather than sideways chop.
Trading Strategy
The market's mixed session with elevated activity sets up critical trading opportunities around the established $675-$680 resistance zone, where SPY tested both sides before settling near midrange levels. In rising market scenarios where buyers defend the current consolidation pattern, initiate long positions on any pullback toward $675-$676 with profit targets at $681-$683 and extended objectives near $685 if momentum builds beyond today's high of $683.36. Place protective stops below $674 to preserve capital while allowing for normal intraday fluctuations, particularly given the heightened volume that accompanied today's range-bound action. For bearish breakdown strategies, short any failure to hold above $677 with downside targets to $670-$672 and stretch goals toward $665 if selling pressure overwhelms recent support levels.
The Nasdaq's flat performance alongside the Dow's minimal decline creates selective opportunities in sector rotation plays, particularly given the mixed signals from technology leadership today. Position sizing should reflect the current volatility environment while maintaining strict discipline around the $677-$680 pivot zone, as any decisive break in either direction could trigger significant momentum moves toward $685 upside or $670 downside targets. The Russell 2000's modest weakness relative to large caps suggests focusing on individual stock setups rather than broad index plays. Risk management requires careful attention to the $675-$677 support cluster, as this becomes the critical decision point for continuation versus reversal scenarios, demanding traders maintain adequate stop distances of 2-3 points while preparing for either breakout moves or range-bound grinding that could persist through upcoming sessions.
Model’s Projected Range
SPY's projected maximum range for Wednesday is $667 to $689, with the Call side dominating in an expanding band that suggests trending price action with intermittent chop. Wednesday brings Core CPI m/m, CPI m/m, and CPI y/y data which are likely to produce significant volatility particularly in the first hour of trading. SPY closed at $677.18, down 0.16%, remaining below the $685 level where bears battle the bulls for control in a two-way trading environment. The session saw prices trade between a high of $683.35 and low of $674.77 with modest intraday volatility. SPY is trading just above key support at $675 as markets continue to digest the Federal Reserve's latest policy stance and ongoing geopolitical tensions. Our model shows resistance above at $680, with a break of $685 targeting $690, while support below sits at $672 where a break of this level would target $670. If $670 breaks there is little to keep price from falling toward $665. The long-term bull trend remains intact above $640, and now that we are out of February, the market should set up for a spring and summer rally to new highs. We have stated for some time, as long as price holds above key structural levels, this remains a broader dip-buying environment. Absent a catalyst, resistance sits at $680, $682, $683, $685, while support rests at $675, $672, $670, and $665. We favor buying dips at $675 given SPY's position near the middle of the projected range. Bitcoin closed at $70,076 while MAG stocks showed mixed action with most names posting gains while Netflix and Microsoft declined, creating a cautious backdrop for momentum names. The VIX closed at 24.93 down 2.24%, suggesting a bit of a reduction in fear as inflation data approaches and traders position for potential CPI volatility. SPY closed near the lower end of the bull trend channel from the April lows with structural support near $665.
Market State Indicator (MSI) Forecast
Current Market State Overview:
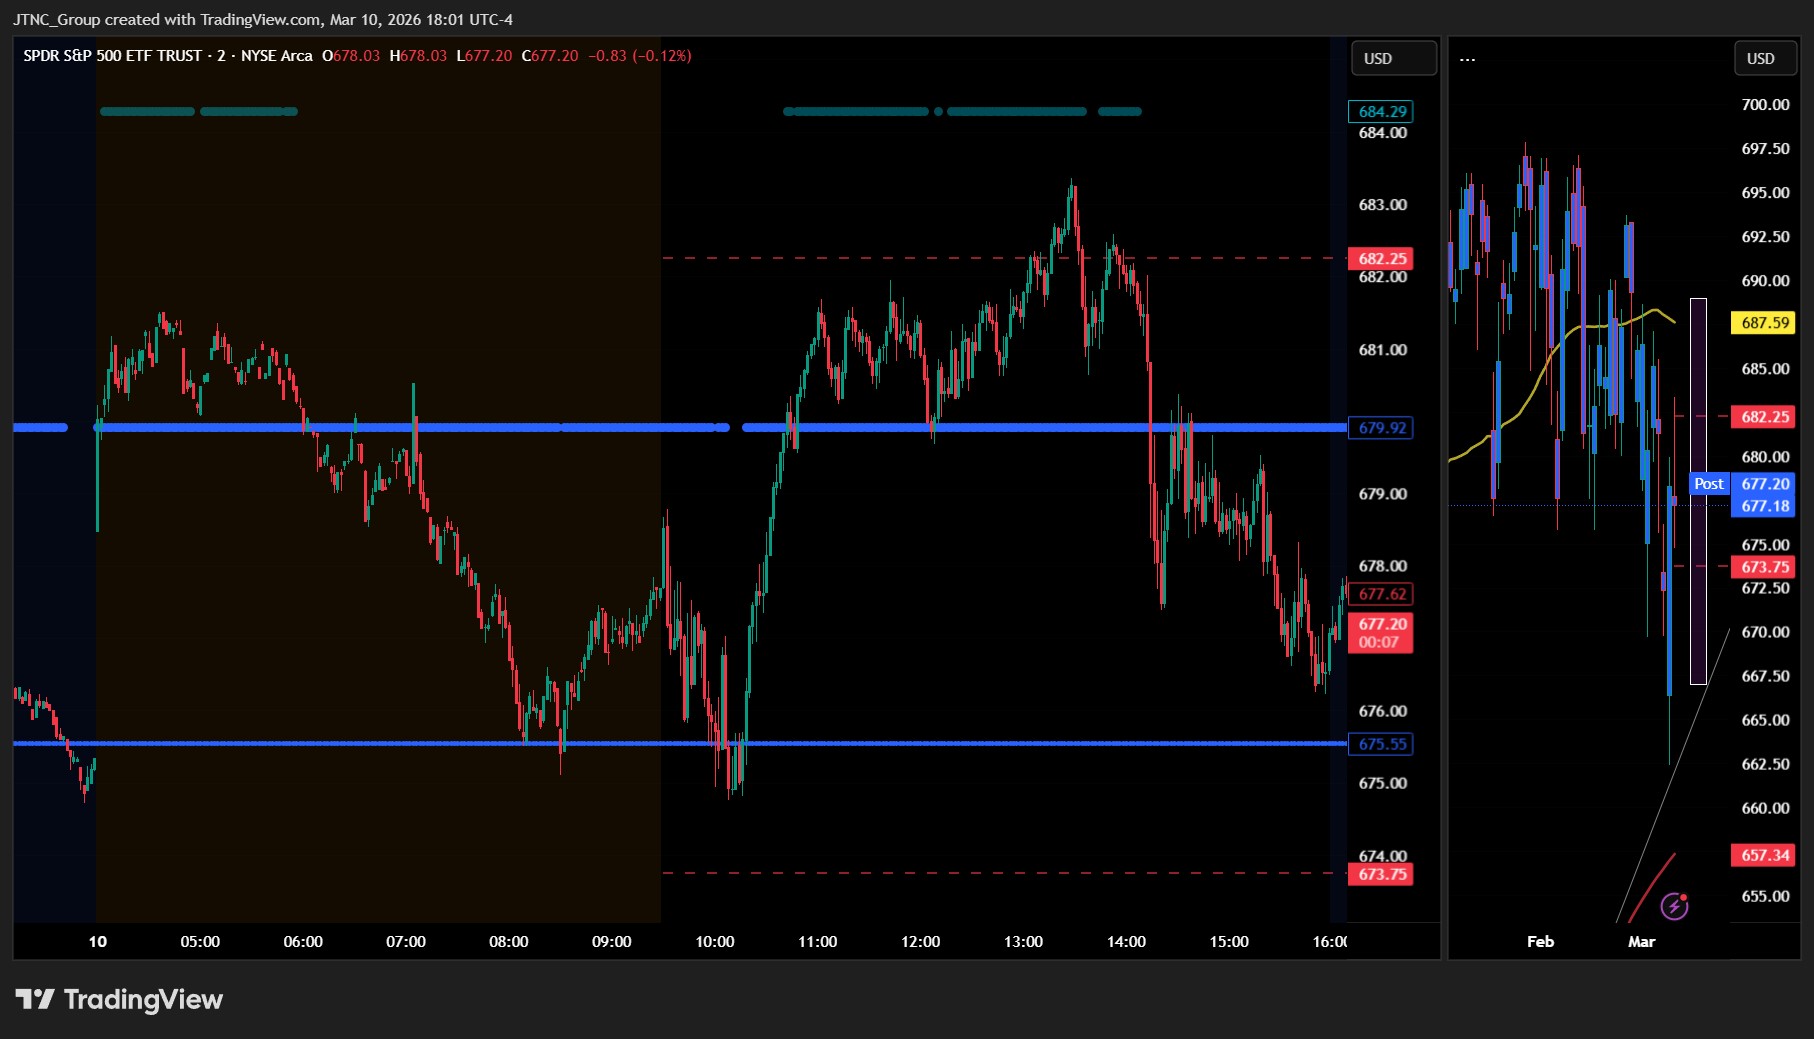
The MSI ended Tuesday in a Bullish Trending Market State with SPY closing at $677.20, positioned in the lower third of the range between MSI resistance and support. Extended targets were not printing at the close, though teal dots had printed above during premarket and regular session indicating early herd participation. The MSI did not rescale all day but remained in a wide bullish state for the entire session. The MSI forecast for Wednesday calls for a slow grind higher, though without extended targets at the close the move may be modest and is likely to find resistance at key levels above. MSI resistance is $679.92 with support at $675.55.
Key Levels and Market Movements:
Monday we stated, "Bulls want to hold current levels overnight and push toward $682," and added, "bears want to see $675.95 fail to press price toward $670," while also noting, "Given the Bullish Trending Market State close with SPY in the lower third of the MSI range, Tuesday's action is likely to see continued upside momentum though the lack of extended targets suggests any advance may be measured." The session delivered mixed results as SPY opened at $677.72, slightly below Monday's close of $677.05, and initially showed strength pushing to a session high of $683.36 before sellers stepped in. With the MSI transitioning from mixed premarket states to Bullish Trending by market open, the early long setup off the opening levels targeting MSI resistance provided solid gains. Price rallied steadily from the open, breaking through the $679.92 resistance level and reaching the session high near $683. However, sellers defended these elevated levels and pushed price back down through the session, ultimately closing near where it opened at $677.05. The successful break above MSI resistance early in the session offered bulls exactly what they wanted initially, but the failure to hold those gains and the retreat back into the MSI range created multiple trading opportunities. Once price broke above $679.92 resistance, any pullback to that level provided clean long setups back toward higher levels, while the eventual failure to hold above resistance offered short opportunities back toward support. The session provided clear directional signals with the MSI framework, transitioning from early bullish momentum to late session weakness. At minimum it was a three-for-three session for traders following the framework. It was an easy day to read and execute with substantial setups, all identified through proper context, patience, and flexibility while leveraging the MSI, premarket levels, and market structure rather than forcing trades. The MSI continues to prove its reliability as the cornerstone of our trading process.
Trading Strategy Based on MSI:
Wednesday has heavy economic data with Core CPI m/m, CPI m/m, and CPI y/y which can introduce significant volatility, so traders should be ready to trade what they see rather than predict. Bulls want to hold current levels overnight and push toward $683, while bears want to see $675.55 fail to press price toward $670. Given the Bullish Trending Market State close with SPY in the lower third of the MSI range, Wednesday's action is likely to see continued upside momentum though the CPI data could create significant volatility in either direction. The positioning in the lower third between $679.92 resistance and $675.55 support creates an interesting dynamic where bulls have room to run toward the upper end, while any failure to hold support could trigger selling back toward lower levels. A successful test and hold of MSI support at $675.55 would offer a clean long setup back toward resistance at $679.92 and potentially higher levels, while any breakdown below support that holds would present a compelling short opportunity back toward the $670 zone. With the MSI in Bullish Trending state, the bias favors continuation of the upside momentum, making any dips to support prime buying opportunities until the MSI transitions to a different state. However, if CPI data disappoints and sellers can successfully defend resistance at $679.92 while pushing back below $675.55 with conviction, watch for the MSI to potentially rescale lower, which would shift the tactical bias. The current positioning suggests Wednesday will test whether the Bullish Trending state can extend higher or if the CPI data will force a pullback. A failed breakout above $679.92 would offer a clean short setup back toward support, while any successful break above resistance with volume presents a compelling long opportunity toward higher levels. The long-term bull trend remains intact above $640 and failed breakouts and failed breakdowns continue to offer the highest-probability setups. Remain flexible, avoid trading during Ranging Market States unless a clear failed breakout or breakdown presents itself, and ensure all trades are fully aligned with MSI signals. Providing real-time insights into market control, momentum shifts, and actionable levels, the MSI when integrated with our Pre-Market and Post-Market Reports continues to sharpen execution precision and elevate trade quality. If you haven't yet integrated MSI and our model levels into your process, now is the time. Contact your representative to get started as these tools are designed to support consistency and enhance performance.
Dealer Positioning Analysis
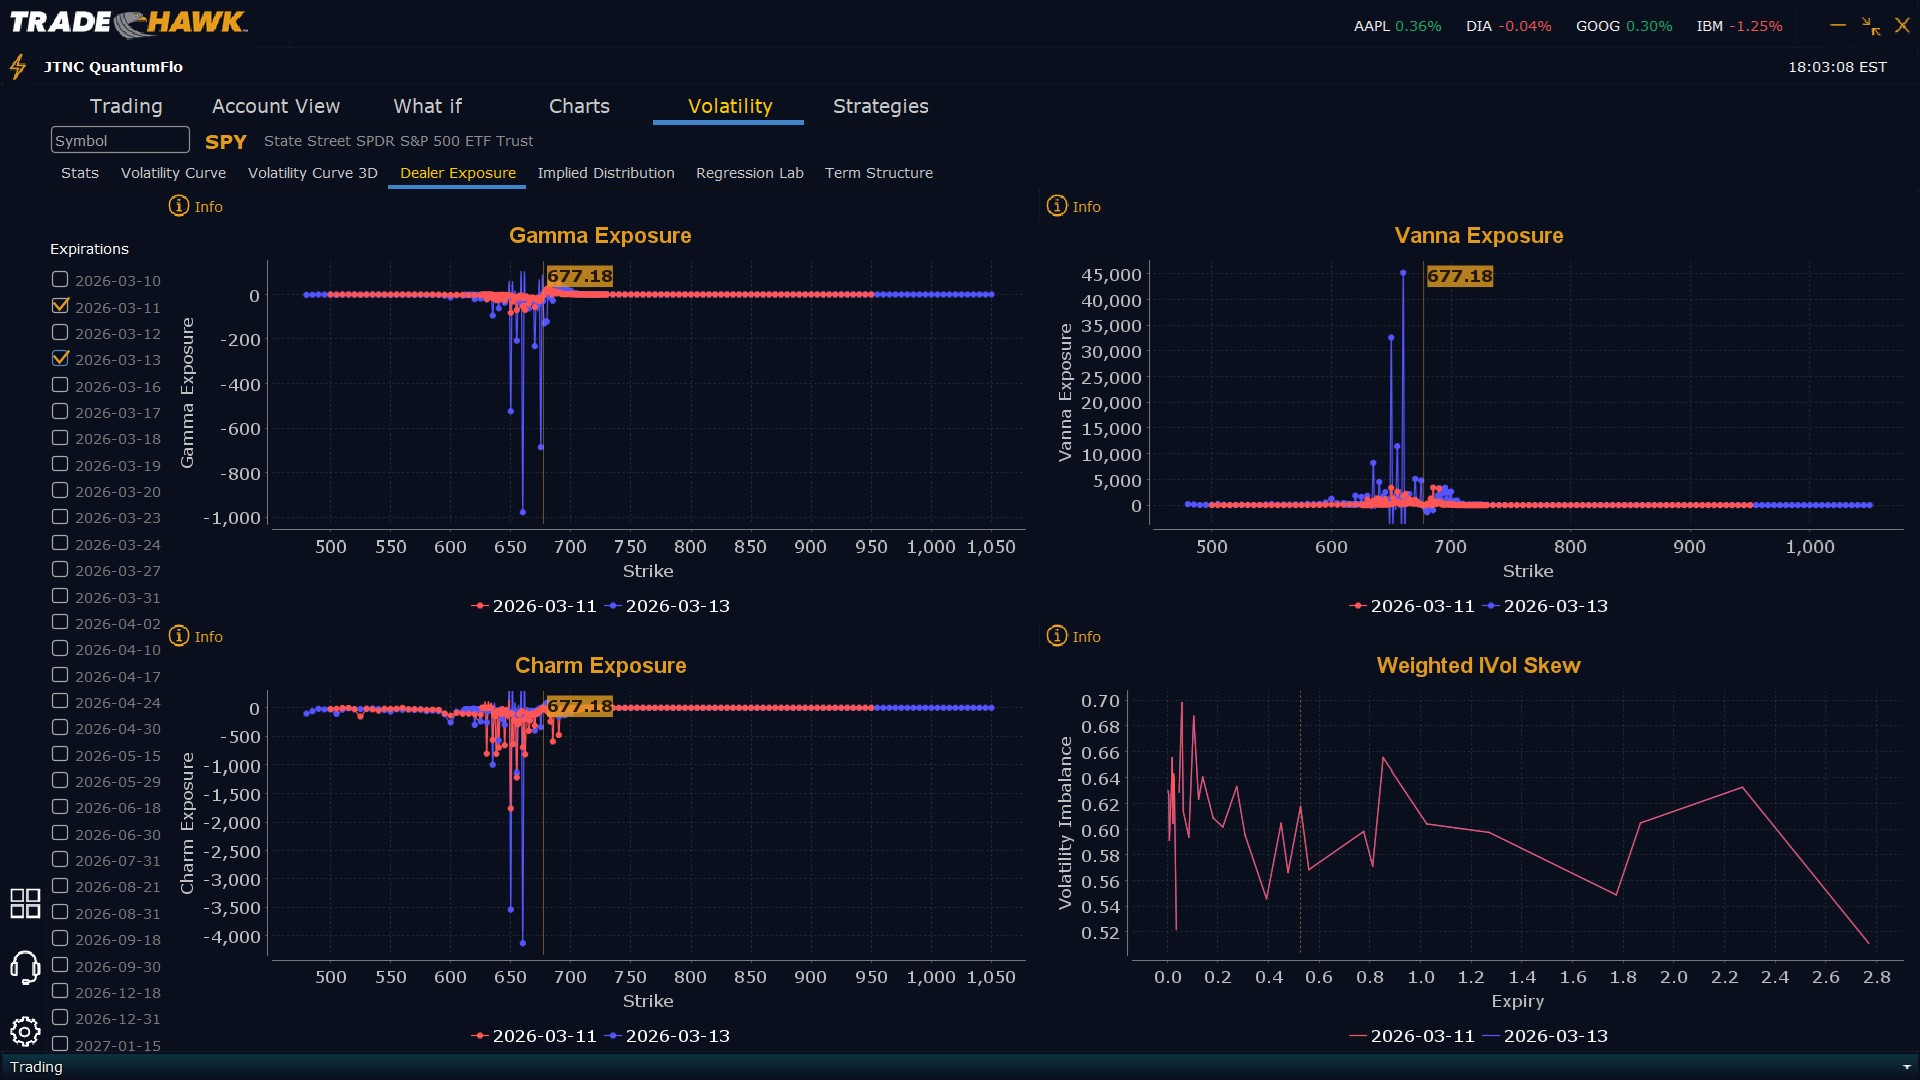
Dealers are selling SPY $678 to $710 and higher strike Calls indicating the Dealers no longer wish to participate in any rally on Wednesday. The ceiling for Wednesday appears to be $690. To the downside, Dealers are buying $677 to $575 and lower strike Puts in a 3:1 ratio to the Calls they're selling/buying displaying reduced concern that prices could move lower. Dealer positioning is unchanged at neutral/slightly bearish.
Looking Ahead to Next Friday:
Dealers are selling SPY $686 to $715 and higher strike Calls while buying $678 to $685 Calls, indicating the Dealers' desire to participate in any rally this week. The ceiling for the week appears to be $690. To the downside, Dealers are buying $677 to $560 and lower strike Puts in a 4:1 ratio to the Calls they're selling/buying displaying moderate concern that prices could move lower. For the week Dealer positioning is unchanged at bearish. We advise reviewing Dealer positioning daily for directional clues. These positions evolve quickly and tracking them is essential for staying ahead of shifting market sentiment.
Recommendation for Traders
With SPY testing the $674.76 low and closing near session lows at $677.05, traders should watch for a break below $674 to target the next support zone around $670-672. The elevated volume suggests institutional activity, but the mixed close after an $8.60 intraday range indicates continued choppiness. Favor cautious short bias on rallies back toward $680-682 resistance, but keep stops tight above $685 given the potential for volatile swings.
Risk management remains paramount in this environment with position sizing conservative until clearer directional momentum emerges. Be sure to review the premarket analysis posted before 9 AM ET for any changes in the model's outlook and Dealer Positioning.
Good luck and good trading!
