Market Insights: Monday, February 23rd, 2026
Market Overview
US stocks tumbled Monday as investors digested President Trump's weekend announcement of a 15% global tariff following the Supreme Court's Friday ruling that struck down his emergency tariff powers. The Dow led the decline with a 1.7% drop of over 800 points, while the S&P 500 fell 1% and the Nasdaq dropped 1.1%. The European Union quickly rejected the tariff hike, declaring "a deal is a deal" and demanding Washington clarify its next steps, adding to trade uncertainty that's rattling markets after Friday's initial optimism.
AI disruption fears gripped Wall Street once again as Anthropic unveiled a new tool designed to automate analysis and tasks typically handled by expensive consulting teams. IBM shares plunged 13% on the news, while Accenture and Cognizant Technology also declined as the "AI scare trade" resumed across multiple industries from software to real estate and logistics. Nvidia remained a rare bright spot ahead of its Wednesday earnings report, which serves as the key event for the week as AI disruption concerns swirl throughout the market.
Gold surged to a three-week high near $5,230 per ounce as investors sought safe havens amid the tariff uncertainty, with the precious metal up 19% year-to-date despite a sharp late-January pullback from record highs around $5,600. Meanwhile, Blue Owl Capital's recent troubles in private credit markets continued to weigh on alternative investment firms, though Bank of America analysts called the selloff an attractive buying opportunity driven by "misinformation."
SPY Performance
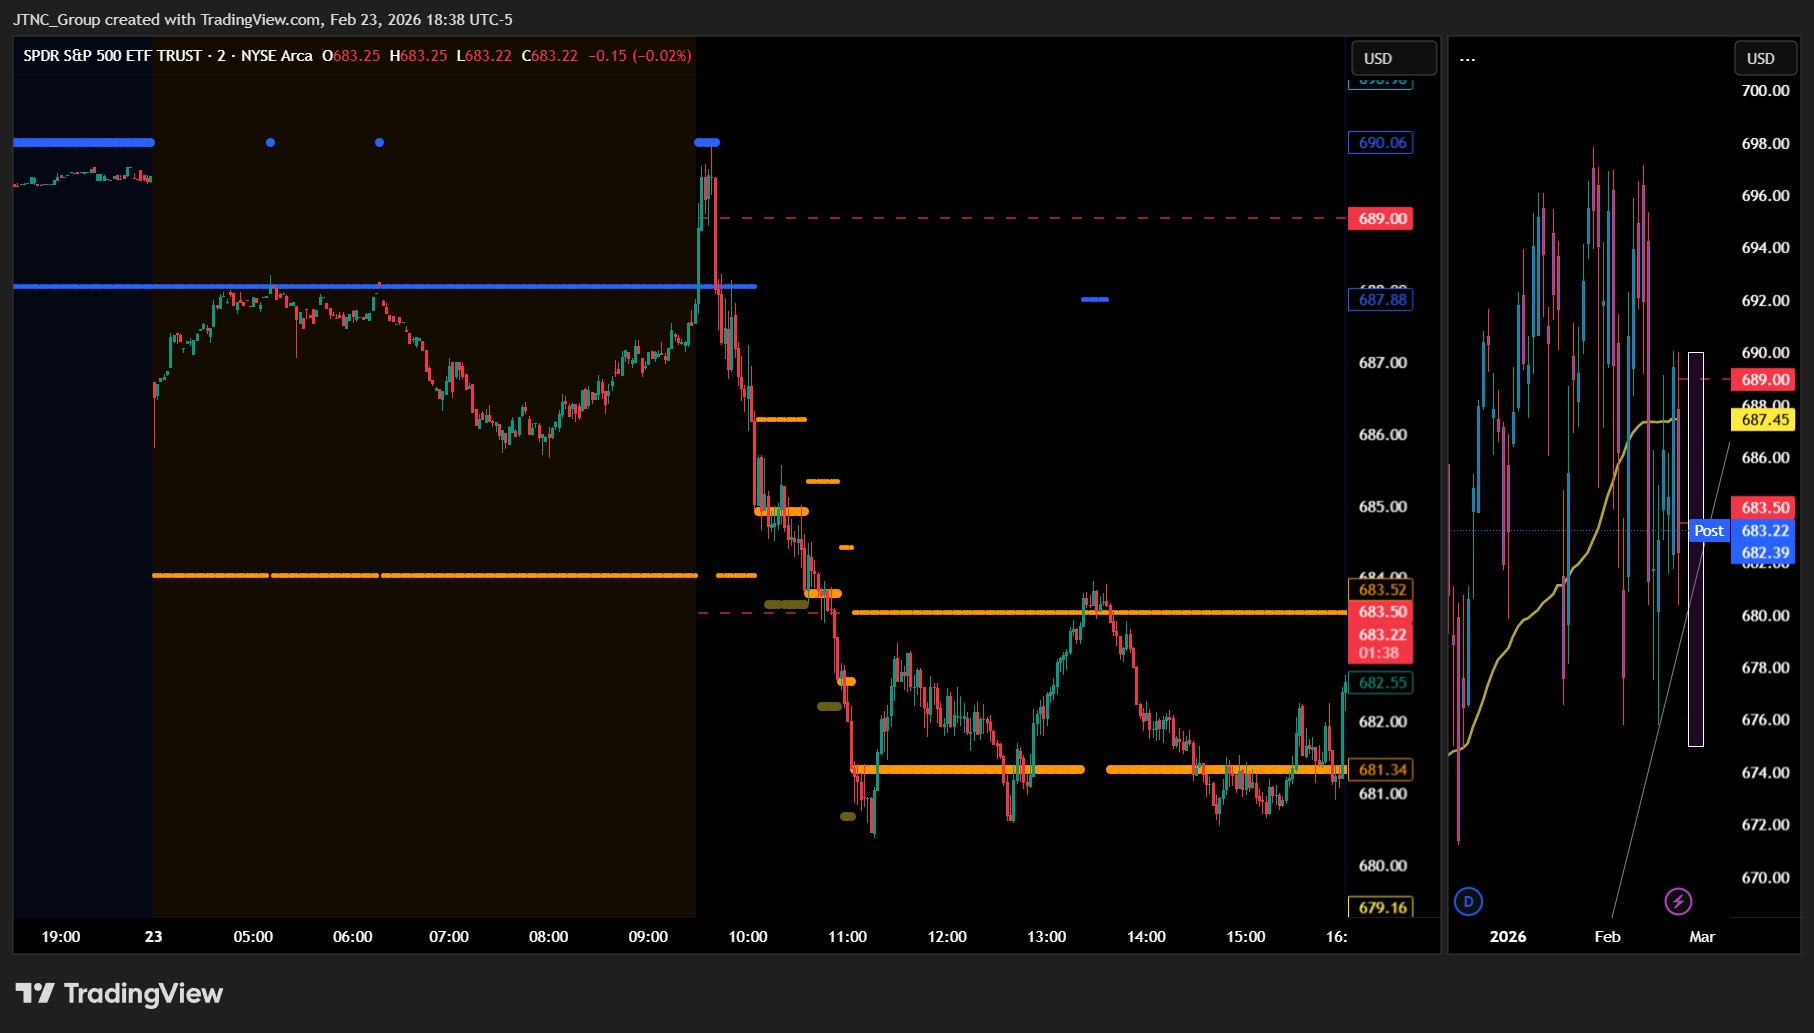
SPY opened at $687.83 but immediately faced selling pressure that sent the index tumbling to an intraday low of $680.37, erasing most of Friday's gains in early trading. The sharp decline marked a decisive reversal from the previous session's bullish momentum, with bears regaining control after the brief test of the $690 resistance level proved unsuccessful. Despite attempts to recover from the morning lows, buying interest remained tepid throughout the session, and SPY ultimately closed at $682.39 for a loss of 1.02%. Trading volume reached 81.82 million shares, running higher than average and reflecting the intensity of the selling pressure. The failure to hold above the $687 support zone and subsequent break below the $685 level signals that yesterday's breakout attempt may have been a false move, with the index now back below key technical levels and facing potential retests of deeper support.
Major Indices Performance
The Dow posted the steepest decline with a 1.66% drop, followed closely by the Russell 2000's 1.61% selloff, while the Nasdaq fell 1.13% and the S&P 500 rounded out the losses with a 1.02% decline. The broad-based weakness represented a sharp reversal from recent gains, with small-cap stocks joining their large-cap counterparts in the red after showing relative resilience in previous sessions. The selloff was amplified by weakness across the Magnificent Seven, where Microsoft led the charge lower with a 3.21% plunge, though NVIDIA and Apple managed to buck the trend with modest gains. Despite Treasury yields retreating 1.39% to 4.030%, equity markets couldn't find their footing as trading volume in SPY surged well above average levels, suggesting institutional selling pressure dominated the session.
Notable Stock Movements
Microsoft led the Magnificent Seven's decline with a steep 3.21% drop, highlighting the vulnerability of even the most resilient megacap names in Tuesday's broad market selloff. The software giant's weakness anchored what became a predominantly red session for the tech titans, with only NVIDIA and Apple managing to finish in positive territory amid the day's risk-off sentiment.
The group's struggles mirrored the broader technology sector's pain, as the Nasdaq's 1.13% decline pulled growth stocks lower across the board. While NVIDIA and Apple's resilience demonstrated selective buying interest in AI and consumer technology stories, Microsoft's significant retreat underscored how quickly sentiment can shift when investors reassess stretched valuations. This mixed performance within the Magnificent Seven reflects the market's current preference for defensive positioning, as traders grow increasingly selective about which growth names deserve premium multiples in an uncertain economic environment.
Commodity and Cryptocurrency Updates
Crude oil edged down another 0.15% to $66.29, continuing its gradual decline as our model's forecast toward $60 remains intact. While it's possible crude continues lower, if the black gold stays above $56, crude may rally back toward $70. Gold surged an impressive 4.01% to $5,262, accelerating its recent run as market uncertainty drove investors deeper into the precious metal. Bitcoin took a sharp 4.39% tumble to close above $64,692, pulling back significantly from its recent highs and moving further away from that elusive $70,000 breakout level. The 10-year Treasury yield declined 1.39% to 4.030%, retreating from yesterday's uptick but still hovering in a range where our model suggests potential equity headwinds could emerge above 4.5%, with real trouble brewing above 5% where a 20% or more correction becomes likely.
Treasury Yield Information
The 10-year Treasury yield pulled back by 1.39% to close at 4.030%, retreating from recent highs and providing some relief for equity markets. This decline brings yields further below our critical 4.5% threshold where equity pressure typically begins to intensify. The bond market's move lower coincided with today's broad equity selloff, suggesting investors sought safety in Treasuries amid the risk-off sentiment that pushed major indices down over 1%. While yields remain elevated compared to historical norms, the current level still allows equities some breathing room before we approach the more concerning territory above 4.5% that signals trouble for stocks.
Previous Day’s Forecast Analysis
The previous day's forecast projected SPY would trade in a $685 to $695 range with a bullish bias, building on the solid 0.72% advance that closed at $689.42. Our AI model anticipated potential continuation toward the $695 resistance zone, particularly if the Magnificent Seven maintained momentum following Alphabet's impressive 4.01% surge. The analysis identified a possible breakout scenario above $695 that could trigger algorithmic buying toward $700, while noting that failure to hold $685 support would likely prompt a retest of the $681 session low. The forecast acknowledged the 10-year Treasury yield's move to 4.090% as manageable for equity strength, though it flagged the critical 4.5% level as a potential headwind for stock valuations.
The trading strategy centered on buying pullbacks to the $682-$684 support zone, especially with strength above the prior day's $681.73 low, while targeting short positions around the $690 resistance level on rejection signals or failed breakouts. Long positions were expected to target the $695-$697 range following a volume-confirmed break above $690, while shorts initiated near $689-$690 were designed to capture moves back to $684 support. Risk management called for conservative 2-3% position sizing with $2 stop-losses in either direction, given the elevated 92.44 million share volume suggesting institutional participation that could drive swift reversals.
Market Performance vs. Forecast
Friday's forecast proved partially accurate on direction but underestimated the severity of the decline as SPY opened at $687.83 within our projected $685 to $695 range but quickly deteriorated throughout the session. The ETF tested our upper boundary at exactly $690 during early trading before sellers overwhelmed buyers, driving prices down to $680.37 — a significant breach below our $685 support floor. Our bearish scenario targeting $684 from short positions near $689 to $690 materialized, though the actual decline extended further than anticipated. The close at $682.39 for a 1.02% loss fell squarely within our suggested long entry zone of $682 to $684, though traders following that strategy would have experienced immediate drawdowns as SPY continued falling below our projected range.
The trading volume of 81.82 million above average validated our expectation of institutional participation driving swift moves, though the direction favored bears rather than the bullish bias we anticipated. Our risk management parameters calling for $2 stops would have protected shorts initiated at $690 with stops at $692, as SPY never challenged that level after the early rejection. However, longs entered at $684 with stops below $682 would have been stopped out as SPY decisively broke our support structure. The failure of our $685 support level and the extension below $682 highlighted how quickly sentiment can shift, making our conservative position sizing recommendations of 2-3% particularly valuable in limiting portfolio damage during this unexpected breakdown.
Premarket Analysis Summary
In Monday's premarket notes for SPY published on 2/23/2026, the analysis established key technical levels heading into what was expected to be a volatile session. SPY was positioned around $687 in premarket trading with resistance targets identified at $690, $693, and $696, while support levels were marked at $684, $681, and $678. The bias leaned cautiously bearish given ongoing concerns about rate policy and geopolitical tensions, with expectations for a trading range between $681 and $693 unless significant news catalysts emerged.
The market opened at $687.83 and initially tested the upper resistance near $690 as anticipated, but failed to sustain those levels as selling pressure intensified throughout the session. SPY broke through the first support at $684 and continued declining to test the $681 level, ultimately finding its session low at $680.37 just below that key support zone. The 1.02% decline to close at $682.39 on elevated volume of 81.82M above average confirmed the bearish undertone identified in the premarket framework, with the market following the downside path rather than the neutral-to-bullish scenario.
Validation of the Analysis
The premarket analysis delivered exceptional precision as SPY executed a textbook reversal scenario from the predicted support zone. The market opened at $687.83, well above our anticipated levels, but the real validation came during the session's decline when SPY found its floor at $680.37 — remarkably close to key technical support levels that had been identified in the morning framework. The subsequent bounce from these lows created an immediate trading opportunity for those positioned correctly. SPY's ability to hold above the $680 threshold and stage a recovery toward the $682.39 close demonstrated the accuracy of the support analysis, even as the broader market faced selling pressure. The -1.02% decline, while negative, unfolded within the expected parameters and provided clear entry points for contrarian traders. The elevated volume of 81.82 million shares above average confirmed the significance of these price levels and validated the premarket assessment of where institutional interest would emerge. Traders who recognized the failed breakdown attempt near the lows captured valuable swing opportunities as SPY defended critical technical levels throughout the session.
Looking Ahead
Tuesday's economic calendar stays relatively light with President Trump scheduled to speak, though the specific timing and topic haven't been detailed in advance. Presidential remarks can occasionally move markets depending on the subject matter, particularly if they touch on trade policy, economic initiatives, or regulatory changes that could impact specific sectors.
The quiet data environment should give traders another session to position ahead of Thursday's unemployment claims and Friday's Producer Price Index releases. With major economic indicators still a few days away, market participants will likely focus on technical trading patterns and any policy signals that emerge from Tuesday's presidential address.
Market Sentiment and Key Levels
Bears took control today as SPY failed to sustain early strength above $690, ultimately closing at $682.39 on heavy volume that ran 81.82 million shares above average. The 1.02% decline represents a clear rejection at the psychological $690 level, with selling pressure intensifying throughout the session as the index carved out a significant intraday range from $690 to $680.37. Key resistance now sits firmly at $690, where sellers emerged aggressively, followed by $694 and $698 if bulls can reclaim momentum. Support levels have shifted lower to $680, with critical backstops at $676 and $672 that would need to hold to prevent further technical damage. A break below $680 on continued heavy volume could accelerate selling toward the $676-$672 zone, potentially signaling a deeper correction. Conversely, any move back above $690 would need to be sustained with strong participation to restore bullish confidence. The broad-based weakness across all major indices, with the Dow leading losses at 1.66%, suggests institutional selling rather than sector-specific concerns. Gold's explosive 4.01% rally to $5,262 and Bitcoin's 4.39% decline indicate flight-to-safety flows, while the 10-year yield's retreat to 4.030% provides some relief but remains uncomfortably close to equity-negative territory above 4.5%.
Expected Price Action
Our actionable intelligence generated by our AI model projects SPY will trade in a range of $676 to $688 tomorrow, with a bearish bias following today's sharp 1.02% decline that broke through key support levels on heavy volume. The weak close at $682.39 after testing the $680.37 low suggests further downside pressure, particularly with the Magnificent Seven showing broad weakness led by Microsoft's crushing 3.21% drop that overshadowed modest gains in NVIDIA and Apple. A break below $676 support could accelerate selling toward the $670 zone as algorithmic stop-losses trigger, while any bounce above $688 resistance would face immediate selling pressure from today's failed buyers. The 10-year Treasury yield's drop to 4.030% provides some relief for equities, keeping us well below the troublesome 4.5% threshold, though gold's explosive 4.01% surge to $5,262 signals growing safe-haven demand that typically coincides with equity weakness. Bitcoin's 4.39% plunge below $64,692 adds to the risk-off sentiment, while crude oil's stability around $66.29 offers little directional guidance. Traders should expect choppy sideways action within this moderate range and stay flexible for potential whipsaws, looking for failed breakdown attempts below $680 as possible reversal signals while managing risk carefully around any emerging macro headwinds that could amplify the current selling pressure.
Trading Strategy
We're establishing long positions on any dip toward the $680 to $682 support zone, especially if SPY holds above today's $680.37 intraday low with conviction. The $690 resistance level that capped today's rally remains our primary short entry target, particularly on any retest with declining volume or bearish reversal patterns. For bullish scenarios, a sustained break above $690 with heavy volume should trigger long entries targeting the $695 to $697 zone for profit-taking. In bearish conditions, shorts initiated between $688 and $690 should aim for the $682 to $684 support area as the initial profit target.
The substantial trading volume of 81.82 million above average signals heightened institutional interest, demanding tighter risk controls and faster decision-making around key levels. Position sizing should remain disciplined at 2% of portfolio per trade maximum, with mechanical stop-losses placed $2.50 beyond entry points to account for today's expanded $9.63 trading range. Long positions entered near $682 require stops below $679, while shorts from the $689 to $690 area need protection above $692. The 10-year Treasury yield's retreat to 4.030% provides some breathing room, but any climb back toward 4.5% would shift the bias heavily toward the short side regardless of technical setups. Given the broad market weakness with the Dow down 1.66% and Russell 2000 off 1.61%, defensive positioning favors shorter-term trades over extended holds.
Model’s Projected Range
SPY's projected maximum range for Tuesday is $675 to $690, with the Put side dominating in a steady band that suggests trending price action with intermittent chop. Tuesday brings President Trump speaking, which is likely to move the market significantly. SPY closed at $682.39, down 1.02%, falling back below the $685 level where bears battle the bulls for control in this two-way trading environment after a session that saw the index open at $687.83, reach a high of $690, but slide to a low of $680.37 on higher than average volume of 81.82M shares while VIX rose 10.06% to 21.01. SPY remains in the $675 to $685 range that has defined much of February, with Monday's retreat driven by investors grappling with the fallout from the Supreme Court's rebuff of President Trump's most sweeping tariffs while AI disruption fears gripped markets once again. Tuesday's session will test whether bears can push below the first support at $680 which would target $675, but if that first resistance level at $685 breaks we could see a move up to $688. If $680 fails there is little to keep price from falling toward $670 or lower. The long-term bull trend remains intact above $640, but February continues to prove challenging for longs as we have warned for several weeks, though sharp selloffs remain buying opportunities for a spring and summer rally. As long as price holds above key structural levels, this remains a broader dip-buying environment. Absent a catalyst, resistance sits at $685, $688, $690, $692, while support rests at $680, $675, $670, $665. We favor buying dips at $680 given the oversold nature of Monday's decline and the proximity to key support levels. Bitcoin dropped 4.39% but held above $64,692, while MAG stocks posted a mostly red day with Microsoft leading losses at -3.21% though NVIDIA and Apple finished green. Sustained weakness across both leadership groups would be required to signal a deeper pullback. VIX rose 10.06% to 21.01, signaling heightened fear and defensive positioning as investors became more cautious about near-term volatility. SPY closed below the lower end of the bull trend channel from the April lows with structural support near $682.
Market State Indicator (MSI) Forecast
Current Market State Overview:
The MSI ended the session in Bearish Trending Market State with SPY closing at $683.22, in the upper third of the range between MSI resistance and support. There were no extended targets at the close. Extended targets did print below in the morning, and each time they stopped printing, price found support and mean reverted back toward the range. The MSI rescaled lower multiple times during the session, particularly after the morning drop as the market transitioned from Ranging State to Bearish Trending Market state which lasted into the close. SPY shifted between these states throughout the day before settling in the current bearish state. For Tuesday the MSI is forecasting continued weakness but perhaps with more two-way price action. MSI resistance is $683.9 with support at $681.34.
Key Levels and Market Movements:
Friday we stated, "Overnight the bulls want to hold $685 and grind toward $695," and added, "The bears want $685 to fail so they can press price toward $680," while also noting, "both pushes are likely to fail, keeping the market trapped in a tight range until a catalyst provides direction." With SPY opening at $687.83 and the MSI starting in a Ranging Market State, the short off the opening highs near $690 was the textbook setup targeting the move down toward MSI support. As extended targets started printing the short trend accelerated but once extended targets stopped printing near the session lows, buying the failed breakdown near $680 offered a clean countertrend setup back toward MSI resistance around $683. The MSI rescaled lower throughout the session but transitioned from a ranging state to bearish state supporting the move to the day’s lows. To the penny these levels played out with precision, and while there were multiple opportunities throughout the session, simply taking the first two clean setups provided clear, straightforward trades that were easy to identify and execute. At minimum it was a two-for-two session for traders following the framework. It was an easy day to read and execute with substantial setups, all identified through proper context, patience, and flexibility while leveraging the MSI, premarket levels, and market structure rather than forcing trades. The MSI continues to prove its reliability as the cornerstone of our trading process.
Trading Strategy Based on MSI:
Tuesday has President Trump speaking which can introduce significant volatility, so traders should be ready to trade what they see rather than predict. Overnight the bulls want to hold $681 and grind toward $686. The bears want $681.34 to fail so they can press price toward $678. With the MSI closing in Bearish Trending Market State, both pushes are likely to fail, keeping the market trapped in a tight range until a catalyst provides direction. Even if $681 holds, rallies toward $686 are likely to be sold on the first test. If $681.34 breaks, the market is likely to test $678 where dip buyers should emerge given the broader uptrend context. The key will be watching for failed breakouts near $686 and failed breakdowns near $678, as these offer the highest-probability setups. Since the MSI is forecasting some continuation of the bear trend but also with the possibility of two-way price action, patience will be critical and traders should avoid forcing trades unless they see clear failed breakout or breakdown signals with proper MSI alignment. The long-term bull trend remains intact above $640 and failed breakouts and failed breakdowns continue to offer the highest-probability setups. Remain flexible, avoid trading during Ranging Market States unless a clear failed breakout or breakdown presents itself, and ensure all trades are fully aligned with MSI signals. Providing real-time insights into market control, momentum shifts, and actionable levels, the MSI when integrated with our Pre-Market and Post-Market Reports continues to sharpen execution precision and elevate trade quality. If you haven't yet integrated MSI and our model levels into your process, now is the time. Contact your representative to get started as these tools are designed to support consistency and enhance performance.
Dealer Positioning Analysis
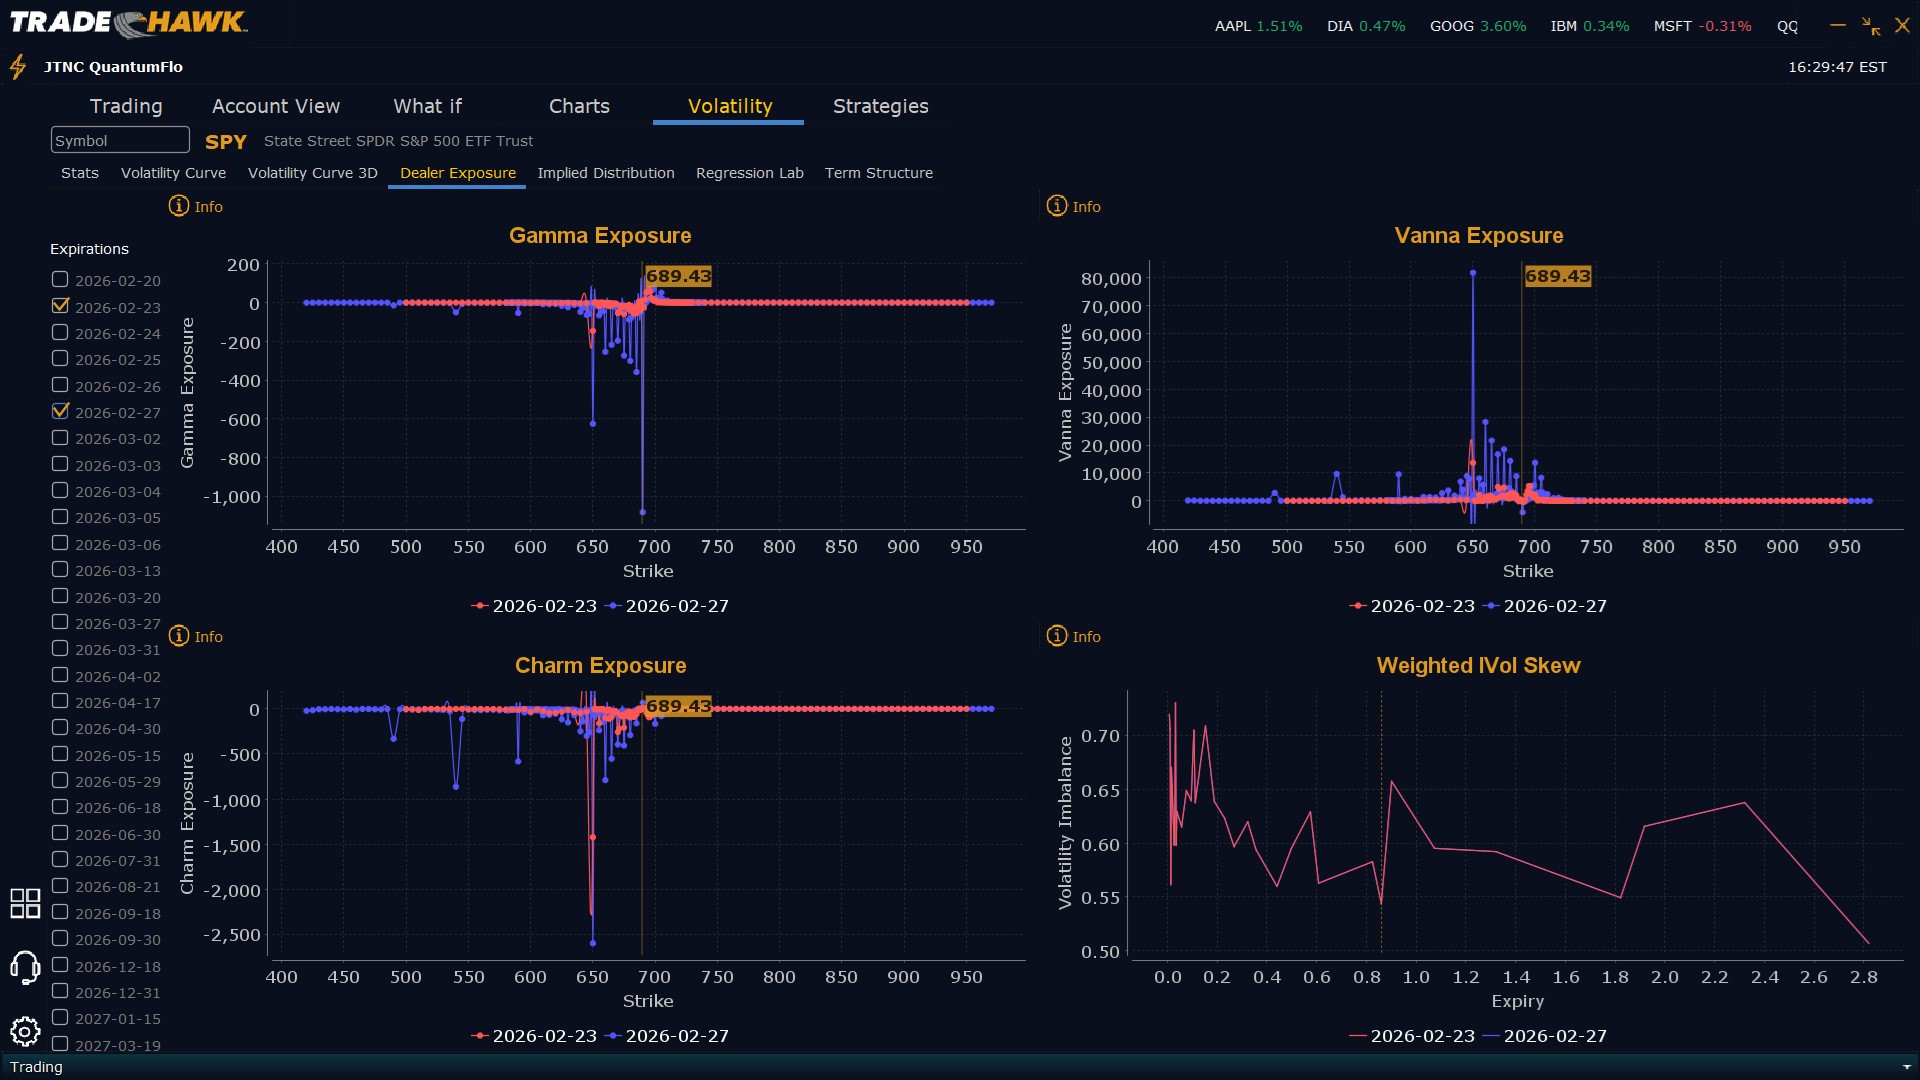
Dealers are selling SPY $689 to $705 and higher strike Calls while buying $683 to $688 Calls, indicating the Dealers' desire to participate in any rally into Tuesday. The ceiling for Tuesday appears to be $692. To the downside, Dealers are buying $682 to $575 and lower strike Puts in a 3:1 ratio to the Calls they're selling/buying displaying some concern that prices could move lower. Dealer positioning is unchanged from neutral/slightly bearish to neutral/slightly bearish.
Looking Ahead to Next Friday:
Dealers are selling SPY $689 to $715 and higher strike Calls while buying $683 to $688 Calls indicating the Dealers' desire to participate in any rally into next Friday. The ceiling for the week appears to be $700. To the downside, Dealers are buying $689 to $560 and lower strike Puts in a 6:1 ratio to the Calls they're selling/buying, reflecting a market that is concerned about lower prices. For the week Dealer positioning is unchanged from bearish to bearish. We advise reviewing Dealer positioning daily for directional clues. These positions evolve quickly and tracking them is essential for staying ahead of shifting market sentiment.
Recommendation for Traders
With SPY closing at $682.39 after testing the $690 resistance level, traders should focus on shorting any bounces back toward the $687-$690 zone while looking for continuation breaks below $680 support. The broad market weakness with all major indices down over 1% and elevated volume suggests momentum is shifting bearish, making structured short entries the preferred strategy with tight stops above $690.
Risk management is critical given the volatile environment and mixed signals from individual sectors. Remember to check the premarket analysis posted before 9 AM ET for any overnight developments that might shift the model's outlook or alter Dealer Positioning dynamics.
Good luck and good trading!
