Market Insights: Friday, February 20th, 2026
Market Overview
US stocks climbed on Friday as the Supreme Court struck down President Trump's sweeping "Liberation Day" tariffs, ruling 6-3 that he lacked authority to impose them using emergency powers under the International Emergency Economic Powers Act. The S&P 500 rose 0.7%, the Dow gained 0.5%, and the tech-heavy Nasdaq led with a 0.9% advance, with all three major averages posting weekly gains. Trump quickly responded at a press conference, announcing plans for a 10% global tariff to replace the duties eliminated by the high court, saying his administration would use "even stronger" methods that have congressional and judicial backing.
The session unfolded against mixed economic data, with fourth-quarter GDP growth disappointing at 1.4% versus forecasts, while the Fed's preferred core inflation gauge rose more than expected in December on both monthly and annual bases. Meanwhile, fresh concerns emerged in cybersecurity software stocks after Anthropic unveiled new security capabilities for its Claude AI model that can scan code for vulnerabilities and suggest patches. CrowdStrike tumbled 5%, Zscaler dropped 3%, and Cloudflare fell 6% as investors worried about AI disruption expanding beyond traditional software into specialized sectors like cybersecurity.
Attention is already turning to next week's key event with Nvidia earnings due Wednesday after the close, as the AI chip giant serves as the industry's primary bellwether. Investors will scrutinize CEO Jensen Huang's commentary on data center growth, demand for Blackwell and Rubin chips, and any discussion of China export controls. Private credit markets also remained in focus after Blue Owl's withdrawal halt sparked fears of broader stress in the sector, particularly around holdings of software companies threatened by AI advances.
SPY Performance
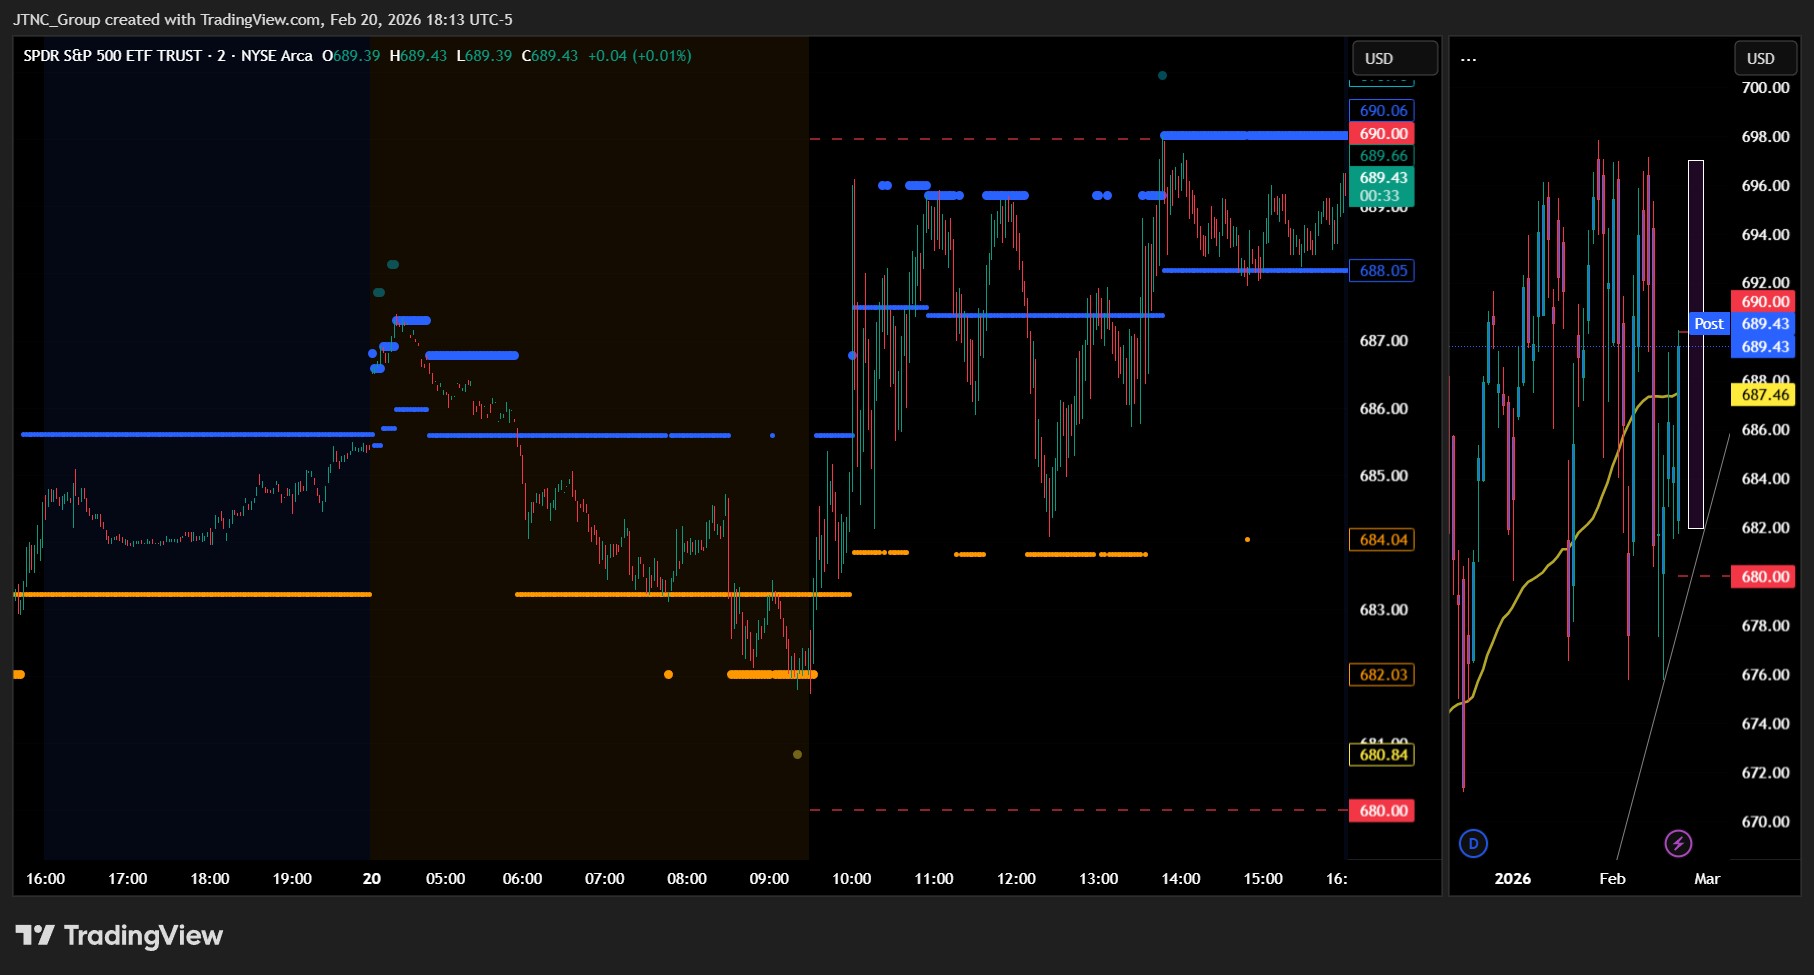
SPY opened at $682.32 and found immediate support above the $681 level, establishing an intraday low of $681.73 in early trading. From there, buyers took control and pushed price steadily higher throughout the session, with momentum accelerating into the afternoon to reach a high of exactly $690. The index closed near session highs at $689.42, gaining 0.72% on the day. Trading volume spiked to 92.44 million shares, well above average levels, indicating strong institutional participation in the move. The decisive break above yesterday's resistance near $689 on heavy volume suggests renewed bullish conviction, with SPY now positioned to test the key $690 to $694 resistance zone that has capped previous rallies.
Major Indices Performance
The Nasdaq delivered the strongest performance with a 0.9% advance, while the S&P 500 gained 0.72% and the Dow climbed 0.47%. The Russell 2000 bucked the trend with a modest 0.13% decline, highlighting the continued divergence between large-cap strength and small-cap weakness. The rally was powered by standout performances from Magnificent Seven stocks, particularly Alphabet which surged 4.01%, though Microsoft weighed on the group with a 0.31% drop. The broader market participation reflected investors' continued appetite for growth names amid relatively stable Treasury yields, with the 10-year yield rising just 0.27% to 4.090%.
Notable Stock Movements
Alphabet dominated the Magnificent Seven with a commanding 4.01% surge, leading an otherwise mixed session for the megacap cohort. The search giant's strength contrasted sharply with Microsoft's decline of 0.31%, which dragged on the group's overall performance. The remaining five members posted modest gains, creating a bifurcated picture that reflected broader market uncertainty despite the day's solid advance.
The mixed showing among tech titans mirrors the underlying tension between growth optimism and valuation concerns that continues to grip markets. While Alphabet's breakout suggests selective strength remains in fundamentally sound names, Microsoft's weakness serves as a reminder that even the most resilient megacaps aren't immune to profit-taking. This divergence within the Magnificent Seven aligns with the broader market's cautious optimism, where gains are increasingly stock-specific rather than driven by broad-based momentum.
Commodity and Cryptocurrency Updates
Crude oil dipped 0.18% to $66.31, pulling back slightly from yesterday's gains but remaining well within our model's key range. Our model has been forecasting crude moving toward $60 for several months and while it's possible crude continues lower, if the black gold stays above $56, crude may rally back toward $70. Gold extended its rally with a robust 2.70% gain to $5,110, building on yesterday's momentum as investors continued seeking safe-haven assets. Bitcoin managed a modest 1.12% advance to close below $67,706, inching closer to the psychologically important $70,000 level but still lacking the conviction needed for a decisive breakout. The 10-year Treasury yield rose 0.27% to 4.090%, creeping higher but remaining below the 4.5% threshold that our model indicates would spell trouble for equities.
Treasury Yield Information
The 10-year Treasury yield edged higher by 0.27% to close at 4.090%. This puts yields just slightly above yesterday's close and still comfortably below our critical threshold of 4.5% where equity pressure typically begins to mount. The bond market remains relatively stable, giving stocks room to breathe as evidenced by today's broad gains across major indices. While we're watching for any sustained move above 4.5% that could signal trouble for equities, current levels suggest the Treasury market isn't posing an immediate headwind to risk assets.
Previous Day’s Forecast Analysis
Our Thursday forecast called for SPY to trade within a $676 to $692 range with the Put side dominating, anticipating choppy price action in a two-way trading environment. We identified $685 as the key battleground level where bears would fight bulls for control, with resistance above at $689, $690, $692, and $694, and support below at $682, $680, $676, and $675. The strategy emphasized buying dips near $682 and shorting failed breakouts near resistance, while warning that February would continue to prove challenging for longs.
Market Performance vs. Forecast
Friday's price action delivered a decisive break above our forecast range as the Supreme Court's tariff ruling provided the catalyst markets had been waiting for. SPY opened at $682.32 near our projected bottom of $682 and initially dipped to $681.73, briefly testing just below our range floor before buyers stepped in with conviction. From there, SPY surged to $690, breaking through the $685 battleground level and the $689 and $690 resistance levels we identified. The close at $689.42 for a 0.72% gain on significantly above-average volume of 92.44M confirmed the bulls had reclaimed control, validating our support levels while blowing past the resistance targets on the unexpected news catalyst.
Premarket Analysis Summary
In Friday's premarket notes for SPY published on 2/20/2026, the analysis outlined key levels and expectations for the trading session ahead of a heavy slate of economic data including GDP, PCE, and PMI releases. SPY was trading near $684 in the premarket with upside targets near $685, $688, and $690, while downside levels sat at $682, $681, and $678. The expectation was for volatility around the data releases with the potential for a decisive directional move if the numbers surprised in either direction.
The Supreme Court's tariff ruling provided an unexpected catalyst that overshadowed the economic data. SPY opened at $682.32, quickly found its low at $681.73, then rallied steadily through each upside target, reaching $690 before settling at $689.42. The 0.72% gain on volume of 92.44M well above average confirmed the bullish breakout the premarket framework had identified as the upside scenario.
Validation of the Analysis
The premarket roadmap proved remarkably useful as SPY navigated the volatile session with precision. The market found support right at the $682 downside level, with Friday's low of $681.73 coming within 27 cents of that key threshold before the rally began. Each upside target was systematically hit as SPY advanced through $685, $688, and ultimately $690. The Supreme Court ruling served as the catalyst our model had been waiting for, breaking SPY out of the $675-$685 February range that had contained prices for weeks. Traders who recognized the failed breakdown below $682 and initiated longs captured a nearly 8-point move to the highs. The session reinforced the value of the premarket framework for identifying both the support floor and the resistance targets that ultimately became profit-taking zones.
Looking Ahead
Monday's economic calendar remains quiet with no high-impact releases scheduled, giving traders a chance to digest this week's developments and position for the busy data flow ahead. The absence of major economic announcements should allow market participants to focus on technical levels and any overnight developments from global markets.
Market Sentiment and Key Levels
Bulls regained control today as SPY pushed through key resistance levels on elevated volume, closing at $689.42 after testing the $690 psychological barrier. The 0.72% gain on volume significantly above average suggests institutional participation, though the inability to hold $690 indicates some hesitation at these levels. Immediate resistance now sits at $690, followed by $694 and $698, while support has shifted higher to $684, $681, and $678. A decisive break above $690 with sustained volume could target the next resistance cluster around $694-$698, potentially signaling a broader risk-on environment. However, failure to hold above $684 would likely trigger profit-taking back toward the $681-$682 range. The 10-year yield's climb to 4.090% remains a key headwind, as any move toward 4.5% could quickly shift sentiment bearish. With the Magnificent Seven showing mixed signals and small caps lagging, the market's ability to maintain this momentum will depend heavily on whether institutional flows continue supporting large-cap growth names at these elevated valuations.
Expected Price Action
Our actionable intelligence generated by our AI model projects SPY will trade in a range of $685 to $695 tomorrow, with a bullish bias following today's solid 0.72% advance on elevated volume. The closing push to $689.42 sets up potential for continuation toward the $695 resistance zone, particularly if the Magnificent Seven maintain their positive momentum led by Alphabet's impressive 4.01% surge. A break above $695 could trigger algorithmic buying and push SPY toward $700, while failure to hold the $685 support level would likely result in a retest of the $681 low from today's session. The 10-year Treasury yield's move to 4.090% remains within acceptable parameters for equity strength, though traders should monitor any approach toward the critical 4.5% level that historically pressures stock valuations. With Bitcoin holding above key support and gold's 2.70% rally signaling some inflation hedging demand, risk assets appear well-positioned for further gains. Traders should stay flexible given the moderate range and be prepared for potential whipsaws around the midpoint, while looking for failed breakouts above $692 as short entry opportunities and managing risk carefully ahead of any unexpected macro developments that could shift sentiment quickly.
Trading Strategy
We're targeting long positions on any pullback to the $682 to $684 support zone, particularly if SPY shows intraday strength above yesterday's $681.73 low. The $690 level proved to be significant resistance today, making it an ideal area to initiate short positions if we see rejection candles or failed breakout attempts above this threshold. For rising market scenarios, we're looking for a clean break above $690 with volume confirmation before targeting the $695 to $697 range for profit-taking. In falling market conditions, shorts initiated near $689 to $690 should target the $684 support level for quick profits.
Risk management remains critical given the elevated trading volume of 92.44 million above average, which suggests institutional participation that could drive swift reversals. Position sizing should be conservative at 2-3% of portfolio per trade, with stop-losses set $2 beyond entry points in either direction. Long positions entered at $684 require stops below $682, while shorts from $690 need stops above $692. The 10-year Treasury yield's climb to 4.090% warrants close monitoring, as any push toward 4.5% could trigger systematic selling pressure that would favor the short side regardless of technical levels.
Model’s Projected Range
SPY's projected maximum range for Monday is $682 to $697, with the Call side dominating in a steady band that suggests trending price action with intermittent chop. There is no economic news due out Monday. SPY closed at $689.42, up 0.72%, once again above the $685 level where bulls are in control and bears are sidelined after a session that saw the index open at $682.32, reach a high of $690, and hold above a low of $681.73 on higher than average volume of 92.44M shares. SPY remains in the $675 to $685 range that has defined much of February, though Friday's rally was bolstered by the Supreme Court ruling that President Trump's most sweeping "Liberation Day" tariffs are unlawful, saying he lacked the authority to impose them using emergency powers. Monday's session will test whether bulls can hold above $685 and target $695, but if that first support level at $685 breaks we could see a move down to $683 which must hold. If $683 fails there is little to keep price from falling toward $680 or lower. The long-term bull trend remains intact above $640, but February continues to prove challenging for longs as we have warned for several weeks, though sharp selloffs remain buying opportunities for a spring and summer rally. As long as price holds above key structural levels, this remains a broader dip-buying environment. Absent a catalyst, resistance sits at $695, $696, $700, $703, while support rests at $687, $685, $683, $680. We favor buying dips at $685 given Friday's strong close above the bull control level and selling failed breakouts above $696. Bitcoin gained 1.12% but closed below $67,706, while MAG stocks posted a mostly green day across the board led by Alphabet up 4.01% with the exception of Microsoft down 0.31%. Sustained weakness across both leadership groups would be required to signal a deeper pullback. VIX dropped 5.29% to 19.16, signaling improved risk sentiment and reduced fear in the market as investors gained confidence from the tariff ruling. SPY closed above the lower end of the bull trend channel from the April lows with structural support near $678.
Market State Indicator (MSI) Forecast
Current Market State Overview:
The MSI ended the session in Bullish Trending Market State with SPY closing at $689.30, just below MSI resistance. There were no extended targets at the close. Extended targets did print above and below price in the premarket and very briefly around 1 PM, and each time they stopped printing, price found support and mean reverted back toward the range. The MSI rescaled lower multiple times overnight and during the day session as the market transitioned from Ranging Market state to a Bullish Trending Market State early in the session. SPY bounced between these states all day and finally settled in the current bullish state by the close. For Monday the MSI is forecasting a slow grind higher which is likely to find major resistance above $693. MSI resistance is $690.06 with support at $688.05.
Key Levels and Market Movements:
Thursday we stated, "Overnight the bulls want to hold $685 and grind toward $690," and added, "The bears want $685 to fail so they can press price down to $680," while also noting, "Like today, both pushes are likely to fail and keep the market trapped in a wide range." With SPY opening at $682.32 and the MSI starting in a Bearish Trending Market State, buying the failed breakdown near MSI support offered the first clean setup targeting the move back toward $690 resistance. Once extended targets stopped printing around 1 PM near the session highs, the short off MSI resistance around $690 was the textbook fade setup, working back down toward MSI support. The MSI rescaled throughout the session but remained in a ranging or bullish state all day supporting the day’s rally. To the penny these levels played out with precision, and while there were multiple opportunities throughout the session, simply taking the first two clean setups provided clear, straightforward trades that were easy to identify and execute. At minimum it was a two-for-two session for traders following the framework. It was an easy day to read and execute with substantial setups, all identified through proper context, patience, and flexibility while leveraging the MSI, premarket levels, and market structure rather than forcing trades. The MSI continues to prove its reliability as the cornerstone of our trading process.
Trading Strategy Based on MSI:
Monday has little economic news so the market is likely to move more sideways to up than trend given the narrow Bullish Trending Market State at close. Overnight the bulls want to hold $685 and grind toward $695. The bears want $685 to fail so they can press price toward $680. With the MSI closing in Bullish Trending Market State, both pushes are likely to fail, keeping the market trapped in a tight range until a catalyst provides direction. Even if $685 holds, rallies toward $695 are likely to be sold on the first test. If $685 breaks, the market is likely to test $680 where dip buyers should emerge given the broader uptrend context. The key will be watching for failed breakouts near $695 and failed breakdowns near $680, as these offer the highest-probability setups. Since the MSI is forecasting a slow grind higher, patience will be critical and traders should avoid forcing trades unless they see clear failed breakout or breakdown signals with proper MSI alignment. The long-term bull trend remains intact above $640 and failed breakouts and failed breakdowns continue to offer the highest-probability setups. Remain flexible, avoid trading during Ranging Market States unless a clear failed breakout or breakdown presents itself, and ensure all trades are fully aligned with MSI signals. Providing real-time insights into market control, momentum shifts, and actionable levels, the MSI when integrated with our Pre-Market and Post-Market Reports continues to sharpen execution precision and elevate trade quality. If you haven't yet integrated MSI and our model levels into your process, now is the time. Contact your representative to get started as these tools are designed to support consistency and enhance performance.
Dealer Positioning Analysis
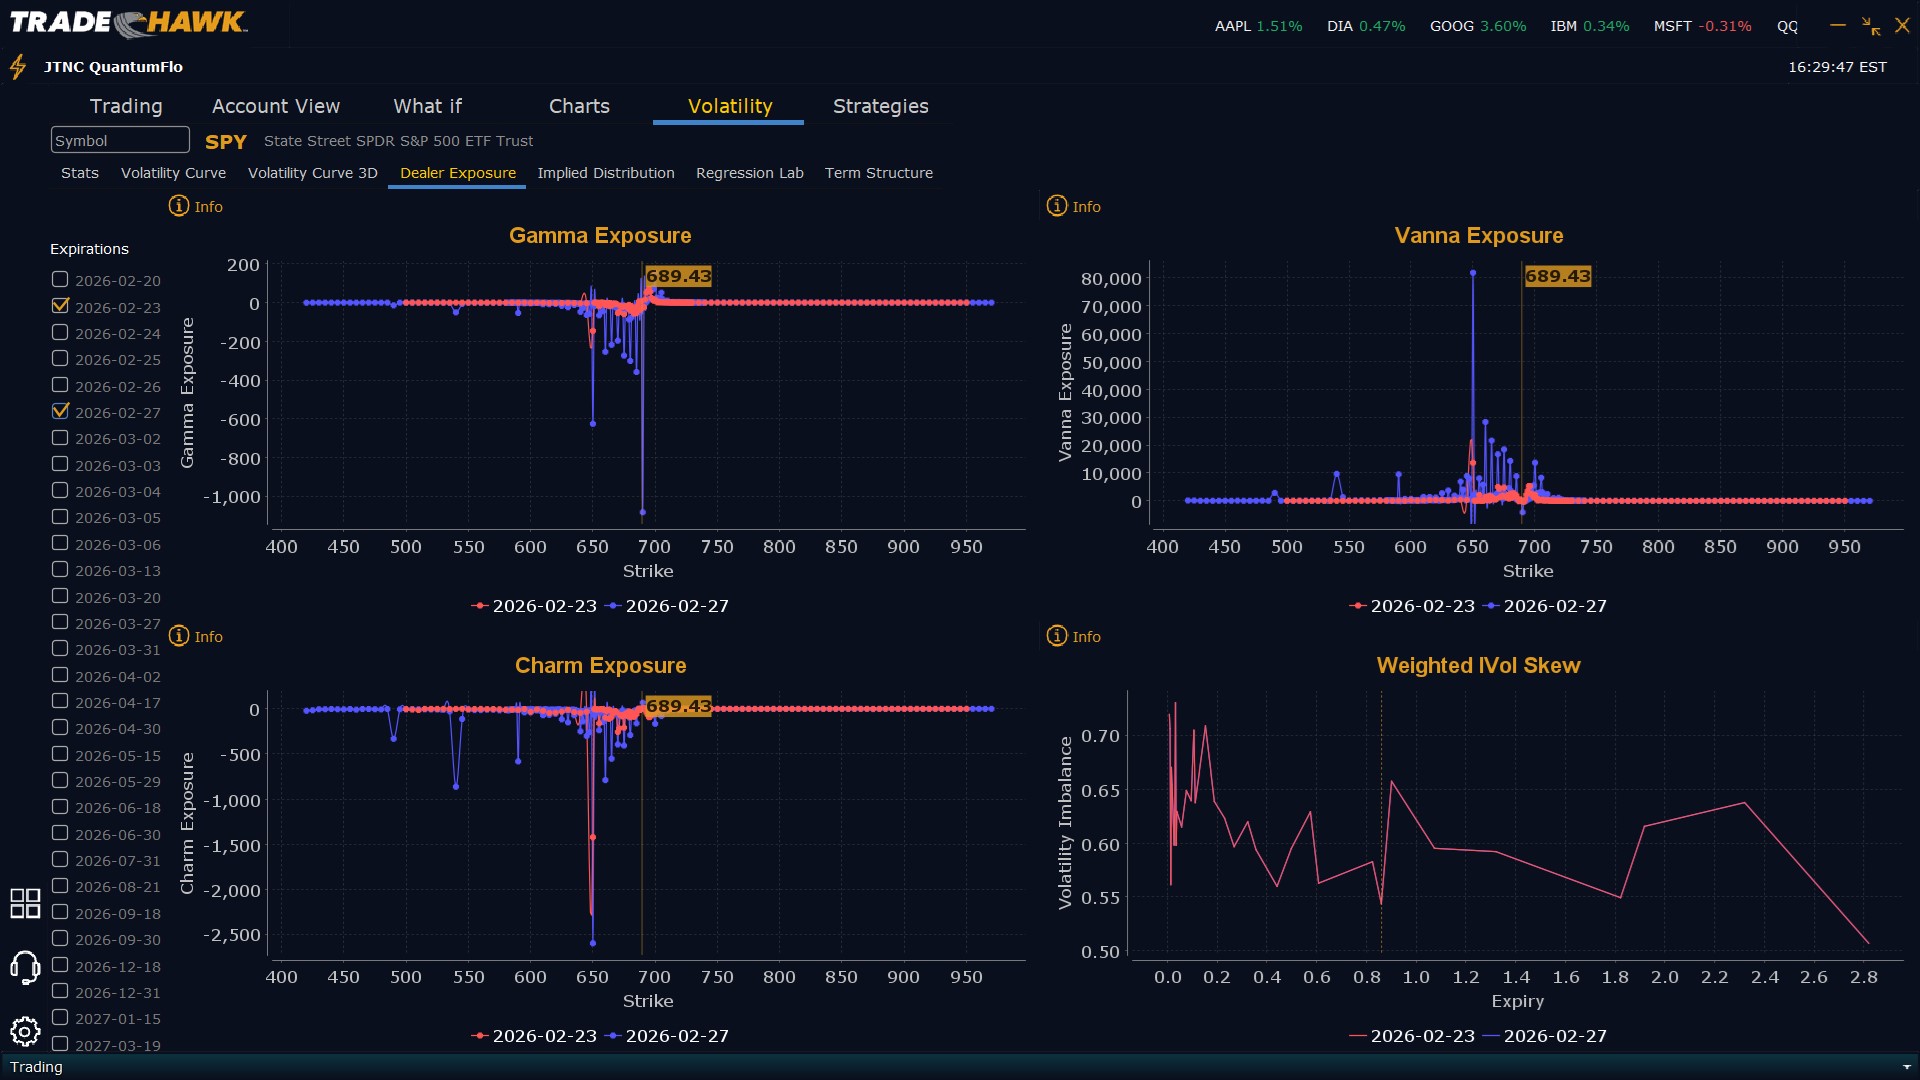
Dealers are selling SPY $693 to $710 and higher strike Calls while buying $690 to $692 Calls, indicating the Dealers' desire to participate in any rally into Monday. The ceiling for Monday appears to be $696. To the downside, Dealers are buying $689 to $630 and lower strike Puts in a 3:1 ratio to the Calls they're selling/buying displaying some concern that prices could move lower. Dealer positioning is unchanged from neutral/slightly bearish to neutral/slightly bearish.
Looking Ahead to Next Friday:
Dealers are selling SPY $692 to $715 and higher strike Calls while buying $690 to $691 Calls indicating the Dealers' desire to participate in any rally into next Friday. The ceiling for the week appears to be $700. To the downside, Dealers are buying $689 to $590 and lower strike Puts in a 6:1 ratio to the Calls they're selling/buying, reflecting a market that is concerned about lower prices. For the week Dealer positioning is unchanged from bearish to bearish. We advise reviewing Dealer positioning daily for directional clues. These positions evolve quickly and tracking them is essential for staying ahead of shifting market sentiment.
Recommendation for Traders
With SPY reclaiming the $690 level on strong volume, favor buying any dips back toward $685 support while watching for continuation above yesterday's high. The broad market strength with Nasdaq leading at 0.9% suggests momentum players should focus on structured long entries, but keep stops tight given the Russell 2000's weakness signaling some underlying divergence. Risk management remains paramount as we navigate this technical breakout zone. Remember to check the premarket analysis posted before 9 AM ET for any overnight developments that might shift the model's outlook or alter Dealer Positioning dynamics.
Good luck and good trading!
