Market Insights: Thursday, February 19th, 2026
Market Overview
US stock futures held steady late Thursday as investors prepared for a crucial economic data dump, with the Dow and S&P 500's three-day winning streak coming to an end. Futures contracts for all major indices traded around flat levels ahead of Friday's Personal Consumption Expenditures report, where economists expect headline PCE to rise 2.8% year over year and core PCE to climb 3%. The first reading of fourth-quarter GDP will also hit markets, giving investors fresh insight into economic momentum as they weigh the Federal Reserve's next moves on interest rates.
Oil markets commanded attention as both Brent and West Texas Intermediate crude extended their rally amid escalating US-Iran tensions. President Trump's announcement that he'll decide within 10 days whether to pursue military strikes against Iran over its nuclear program added geopolitical risk to an already volatile energy landscape. Meanwhile, Fed officials remain split on the rate-cutting path forward, with January meeting minutes revealing some policymakers want clearer evidence of cooling inflation before endorsing additional cuts, while others prioritize protecting labor market strength.
The earnings calendar stays busy with Nvidia and Dell set to report next week, potentially offering clarity on whether the recent AI selloff was as overblown as some analysts suggest. For the week, the S&P 500 sits up 0.4% while the Nasdaq is positioned to snap a five-week losing streak with a 0.6% gain. The Dow lags slightly, down 0.2% over the same period, reflecting the mixed sentiment as markets navigate between economic optimism and lingering uncertainty around technology valuations.
SPY Performance
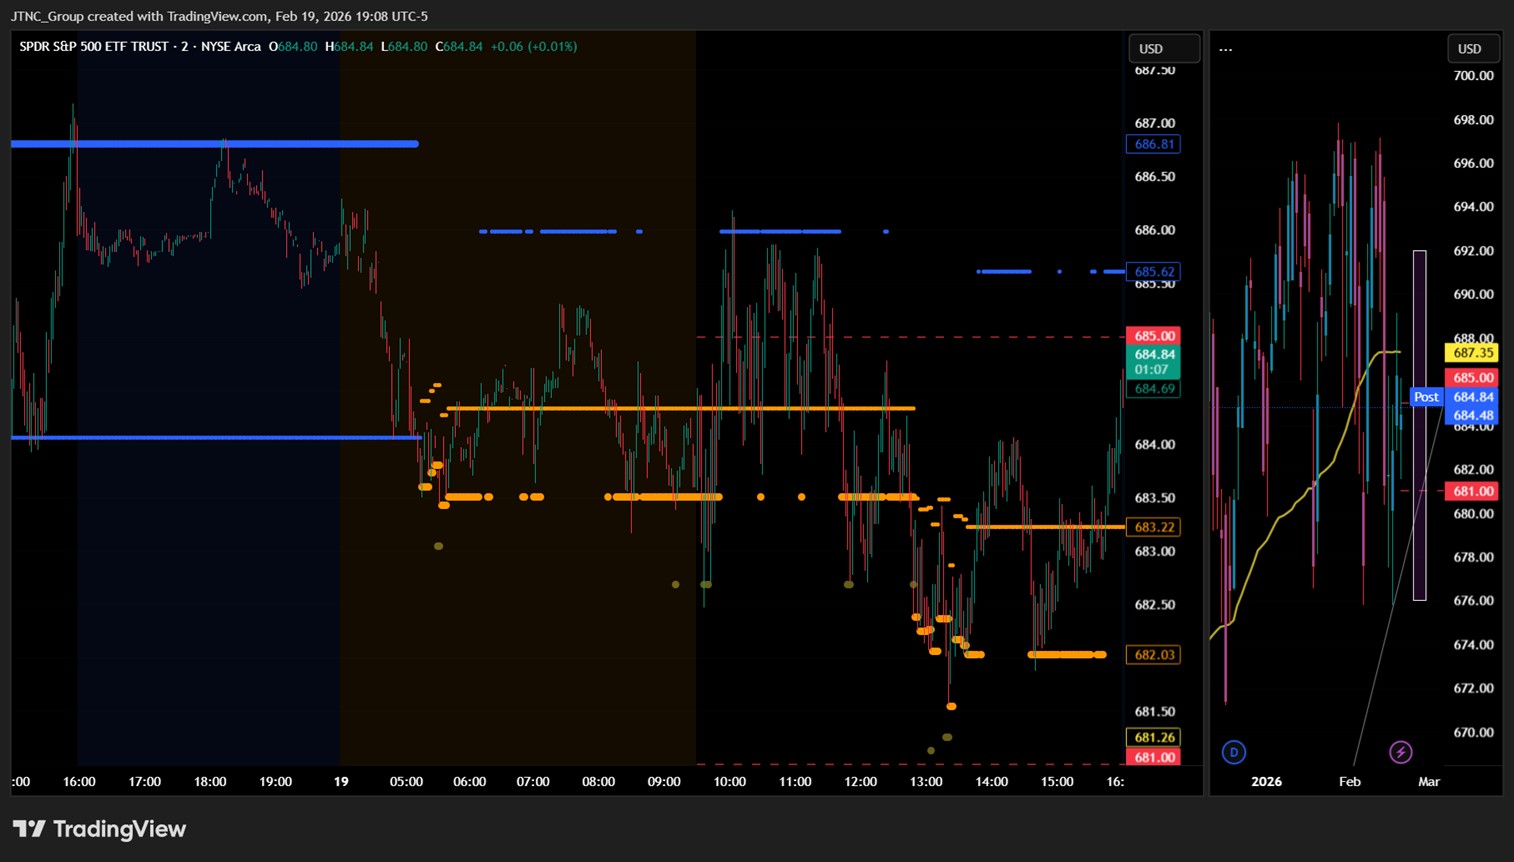
SPY opened at $683.84 and spent most of the session grinding lower in a choppy, indecisive fashion. The index touched an intraday low of $681.55 during midday selling before recovering modestly into the close. Despite the late-day bounce, SPY managed only a high of $686.18 and settled at $684.48, down 0.26% on the day. Trading volume registered 58.53 million shares, near average levels. The decline represents a pullback from yesterday's bullish close above $685, with bears reasserting some control as the index failed to hold key support. The close below $685 suggests near-term momentum may be shifting, though the selling pressure remained relatively contained without any major capitulation.
Major Indices Performance
The Russell 2000 managed a modest 0.24% gain as the only major index to finish in positive territory, showing relative strength in small-cap names despite broader market weakness. The S&P 500 declined 0.26%, while the Nasdaq fell 0.31% and the Dow posted the steepest loss at 0.54%. The divergent performance suggests investors rotated away from large-cap growth and mega-cap technology names, with the Magnificent Seven stocks mostly finishing red as Apple led losses down 1.43%, though Meta, Tesla, and Amazon bucked the trend with modest gains. The mixed session came as the 10-year Treasury yield pulled back slightly to 4.070%, providing some relief from recent rate pressures that have weighed on growth-sensitive sectors.
Notable Stock Movements
The Magnificent Seven delivered a mixed performance that reflected broader market uncertainty, with Apple leading the declines at 1.43% as the iPhone maker faced continued pressure. The tech heavyweight's weakness stood out against a backdrop where most megacaps struggled to find direction. Meta, Tesla, and Amazon managed to finish in positive territory, providing some stability to the group, but their gains weren't enough to offset the selling pressure elsewhere. The divergent performance within this elite group mirrors the market's current indecision, where investors are weighing conflicting signals about economic growth and monetary policy. While the losses weren't severe enough to signal a breakdown, the lack of cohesive strength suggests the megacaps are still searching for a clear catalyst to drive sustained momentum.
Commodity and Cryptocurrency Updates
Crude oil advanced 2.35% to $66.72, building on yesterday's strong gains. Our model has been forecasting crude moving toward $60 for several months and while it's possible crude continues lower, if the black gold stays above $56, crude may rally back toward $70. Gold added another 0.55% to $5,014, maintaining its position above the key $5,000 threshold as precious metals continue attracting safe-haven flows. Bitcoin climbed 1.16% to close below $67,197, pushing closer to the psychologically important $70,000 level that has served as resistance in recent months.
Treasury Yield Information
The 10-year Treasury yield declined 0.10% to close at 4.070%. This pullback provided some relief for equity markets, keeping rates well below our critical thresholds. In our framework, yields above 4.5% begin to pressure equities, above 4.8% typically precede sharper selloffs, and above 5% signals significant equity risk. At 5.2%, we anticipate a 20% or more correction. Current levels remain comfortably below these stress points, allowing equities to maintain relatively stable footing despite mixed performance across major indices.
Previous Day’s Forecast Analysis
Our Thursday forecast called for SPY to trade within a $675 to $691 range, anticipating choppy price action as markets positioned ahead of Friday's key economic releases. We expected the index to face significant resistance in the $689 to $691 zone while finding support around the $684 level. The trading strategy emphasized buying any dips that held above $684 and shorting failed breakout attempts near the upper resistance band. We warned readers to stay flexible and avoid forcing trades, given the range-bound environment with heavy overhead resistance that had been capping recent rallies. The forecast anticipated sideways grinding action rather than any decisive directional move, reflecting the market's cautious stance ahead of the upcoming data that could influence Federal Reserve policy expectations.
Market Performance vs. Forecast
Thursday's price action validated our forecast with remarkable precision. SPY opened at $683.84, just below our projected range of $675 to $691, and spent the entire session navigating within those boundaries. The high of $686.18 fell well short of our resistance zone between $689 to $691, while the low of $681.55 stayed comfortably above the $675 floor we outlined. The choppy, range-bound character we anticipated materialized exactly as expected, with SPY closing at $684.48 for a modest 0.26% decline. Our suggested strategy of buying dips above $684 would have worked perfectly, as the morning weakness found support right at that level and bounced. However, there were no meaningful breakout attempts near $689 to $691 to short, leaving that part of the trade plan unused but appropriately cautious.
Premarket Analysis Summary
In Thursday's premarket notes published at 8:21 AM, SPY was trading at $684.37 with upside targets at $685, $688.25, $689.25, and $693, and downside levels at $682.50, $681, and $678.25. The analysis anticipated a cautious market ahead of unemployment news, with expectations for upward activity toward $688.25 and potentially $690-$693 if price could hold above the bias level at $685. However, if negative sentiment emerged and the bias level failed, the expectation was for consolidation down toward $682.50 or further to $678.25.
The actual market performance fell short of the bullish scenario, as SPY opened at $683.84 and never managed to reclaim the critical $685 bias level. Instead, the index traded in a narrow range with a high of $686.18 that briefly touched the first upside target before retreating. The low of $681.55 came close to but held above the $681 downside target, and SPY closed at $684.48 for a modest decline of 0.26% on average volume.
Validation of the Analysis
The premarket analysis proved remarkably accurate as SPY navigated precisely within the outlined framework. Opening at $683.84, just below the $685 bias level, the market initially tested downside support at $681.55, which aligned closely with the projected $682.50 target zone. This early weakness validated the cautious sentiment noted in the premarket assessment. However, SPY demonstrated resilience by recovering above the bias level and advancing to a high of $686.18, falling just short of the primary upside target at $688.25. The inability to sustain momentum above $685 throughout the session reflected the anticipated consolidation behavior, with the market ultimately settling at $684.48. Traders who recognized the early bounce from support levels near $681.55 could have captured meaningful intraday moves, while the clear resistance around $686 provided logical profit-taking opportunities. The session's range-bound action between key technical levels reinforced the value of the premarket framework for identifying both entry points and exit zones.
Looking Ahead
Friday delivers a heavy lineup of economic data that could provide the spark markets need to break out of recent trading ranges. The marquee release is Advance GDP, which will show whether the economy maintained its momentum through the latest quarter. Equally important is the Core PCE Price Index, the Federal Reserve's preferred inflation gauge, which could influence expectations for future rate decisions.
The Flash PMI readings for both Manufacturing and Services will round out the data dump, offering fresh insights into business activity momentum heading into year-end. With markets currently stuck in consolidation mode, this barrage of high-impact releases has the potential to drive significant volatility and establish clearer directional trends across asset classes.
Market Sentiment and Key Levels
Bears managed to nudge SPY slightly lower despite a relatively narrow trading range, with the index struggling to maintain momentum above key technical levels. The modest decline alongside heavier losses in the Dow suggests underlying caution, though small caps showed resilience with Russell 2000 posting gains. Current resistance appears at $686, matching today's high, followed by $689 and $691. Support has emerged at $684, with deeper levels at $681 and $678 if selling intensifies. A break above $686 could target the $689 area where bulls need to prove their conviction, while a drop below $684 opens the door to a test of $681. The Treasury yield pullback to 4.070% provides some relief for equities, though crude oil's sharp rally and mixed signals from mega-cap tech create cross-currents that could influence direction. Volume remains average, suggesting the market is waiting for clearer catalysts to establish a stronger directional bias.
Expected Price Action
SPY's projected trading range for Thursday spans $678.25 to $693, suggesting potential for meaningful directional movement as markets await unemployment data. Our actionable intelligence generated by our AI model shows a cautiously bullish bias with the critical pivot point at $685. If SPY holds above this bias level, expect upward momentum targeting $688.25 initially, with extension possibilities toward the $690-$693 zone. However, if negative sentiment takes hold and the index fails to reclaim $685, look for consolidation pressure toward $682.50, with further downside risk extending to $678.25. The relatively wide trading range indicates trending action is more likely than sideways churn, though traders should remain flexible given the mixed signals from yesterday's session where small caps outperformed while mega-caps struggled. External factors include pending unemployment figures that could serve as a catalyst, plus ongoing concerns about Treasury yields hovering near the 4.07% level. Trade with the prevailing trend once direction becomes clear, watch for failed breakouts around key resistance levels, and manage risk carefully around any economic releases that could spark volatility.
Trading Strategy
With SPY closing at $684.48 after testing both sides of a tight range, traders should focus on the key $684 support level that held during today's session. For bullish setups, look to initiate long positions on any pullback toward $682 with stops below $680, targeting initial profits at $687 and extended moves toward $690. The current consolidation pattern suggests limited downside as long as $684 support remains intact.
For bearish scenarios, short opportunities emerge on rallies back toward $687 to $688 resistance, particularly if accompanied by weak volume or rejection candles. Set stops above $690 and target profits at $682 initially, with extended downside potential toward $680 if selling accelerates. Position sizing should remain conservative given the compressed range and lack of directional conviction.
In a rising market scenario where SPY breaks decisively above $690, shift to momentum longs on any pullback to former resistance around $688, targeting $694 and potentially $697. Conversely, if support at $684 fails convincingly, prepare for acceleration toward $680 and possibly $676, where oversold bounces become more likely. Risk management remains critical in either direction given the market's current indecisive character and the need to preserve capital for clearer directional moves ahead.
Model’s Projected Range
SPY's projected maximum range for Friday is $676 to $692, with the Put side dominating in a steady band that suggests trending price action with intermittent chop. Friday brings Advance GDP q/q, Core PCE Price Index m/m, Flash Manufacturing PMI, and Flash Services PMI, which are likely to produce significant volatility particularly in the first hour of trading. SPY closed at $684.48, down 0.26%, falling back below the $685 level where bears battle the bulls for control in a two-way trading environment. The session saw SPY open at $683.84, reach a high of $686.18 before selling off to a low of $681.55, with trading volume of 58.53M near average while VIX rose 3.11% to 20.23. SPY remains in the $675 to $685 range that has defined much of February, as US stock futures were steady late Thursday with investors bracing for a heavy slate of economic data after the end of a three-day winning streak for the Dow and S&P 500. Our model shows resistance above at $689, $690, $692, and $694, with a break of $689 targeting $690, while support below sits at $682, $680, $676, and $675, where a failure of $682 would target $680, and if $675 breaks there is little to keep price from falling toward the next round number below. The long-term bull trend remains intact above $640, but February continues to prove challenging for longs as we have warned for several weeks, though sharp selloffs remain buying opportunities for a spring and summer rally. As long as price holds above key structural levels, this remains a broader dip-buying environment. Absent a catalyst, resistance sits at $689, $690, $692, $694, while support rests at $682, $680, $676, $675. We favor buying dips at $682 given SPY's position in the lower half of its range. Bitcoin gained 1.16% but closed below $67,197, while MAG stocks had a mostly red day with Apple leading losses at -1.43%, though Meta, Tesla, and Amazon finished green, and sustained weakness across both leadership groups would be required to signal a deeper pullback. VIX rose 3.11% to 20.23, reflecting increased risk-off sentiment as markets face uncertainty ahead of key economic data. SPY closed near the lower end of the bull trend channel from the April lows with structural support near $680.
Market State Indicator (MSI) Forecast
Current Market State Overview:
The MSI ended the session in Ranging Market State with SPY closing at $684.84, in the upper third of the range between MSI resistance and support. There were no extended targets at the close, consistent with the Ranging state. During the session, extended targets printed below price mid-morning, around noon, and mid-afternoon, with each cessation marking key reversal points where price found support and mean reverted. The MSI rescaled lower multiple times throughout the session as it transitioned from Bearish Trending at the open to Ranging by close. For Friday the MSI is forecasting choppy, two-way price action, likely testing both ends of the day's range without establishing a sustained trend. MSI resistance is $685.67 with support at $683.27.
Key Levels and Market Movements:
Thursday we stated, "Overnight the bulls want to hold $685 and grind toward $690," and added, "The bears want $685 to fail so they can press price down to $680," while also noting, "Like today, both pushes are likely to fail and keep the market trapped in a wide range." With the MSI opening in a Bearish Trending Market State with extended targets printing below, the short off the open near $683.84 was the textbook setup, targeting the session low around $681.55 where extended targets stopped printing. Once extended targets ceased mid-morning, buying MSI support on a failed breakdown near $682 offered a clean countertrend setup back toward $685. The afternoon brought another opportunity to fade strength near $686 when extended targets stopped printing, working back down to MSI support levels. To the penny these levels played out with precision, and while there were multiple opportunities throughout the session, simply taking the first two clean setups provided clear, straightforward trades that were easy to identify and execute. At minimum it was a two-for-two session for traders following the framework. It was an easy day to read and execute with substantial setups, all identified through proper context, patience, and flexibility while leveraging the MSI, premarket levels, and market structure rather than forcing trades. The MSI continues to prove its reliability as the cornerstone of our trading process.
Trading Strategy Based on MSI:
Friday has heavy economic data with Advance GDP q/q, Core PCE Price Index m/m, Flash Manufacturing PMI, and Flash Services PMI which can introduce significant volatility, so traders should be ready to trade what they see rather than predict. Overnight the bulls want to hold $684 and push toward $688. The bears want $683.27 to fail so they can press price down to $680. Given the MSI's Ranging state at the close, both pushes are likely to fail, keeping the market trapped in a tight range until the data provides a catalyst. If data sparks a move, watch for the MSI to rescale rapidly with extended targets — that signals a real trend and traders should align with it rather than fade it. Absent a strong catalyst, expect failed breakouts near $688 and failed breakdowns near $680 to offer the highest-probability setups. If $683.27 breaks cleanly, $680 becomes the next target where dip buyers typically emerge. Conversely, if $685.67 is reclaimed, rallies toward $688 are likely to face selling pressure on the first test. The long-term bull trend remains intact above $640 and failed breakouts and failed breakdowns continue to offer the highest-probability setups. Remain flexible, avoid trading during Ranging Market States unless a clear failed breakout or breakdown presents itself, and ensure all trades are fully aligned with MSI signals. Providing real-time insights into market control, momentum shifts, and actionable levels, the MSI when integrated with our Pre-Market and Post-Market Reports continues to sharpen execution precision and elevate trade quality. If you haven't yet integrated MSI and our model levels into your process, now is the time. Contact your representative to get started as these tools are designed to support consistency and enhance performance.
Dealer Positioning Analysis
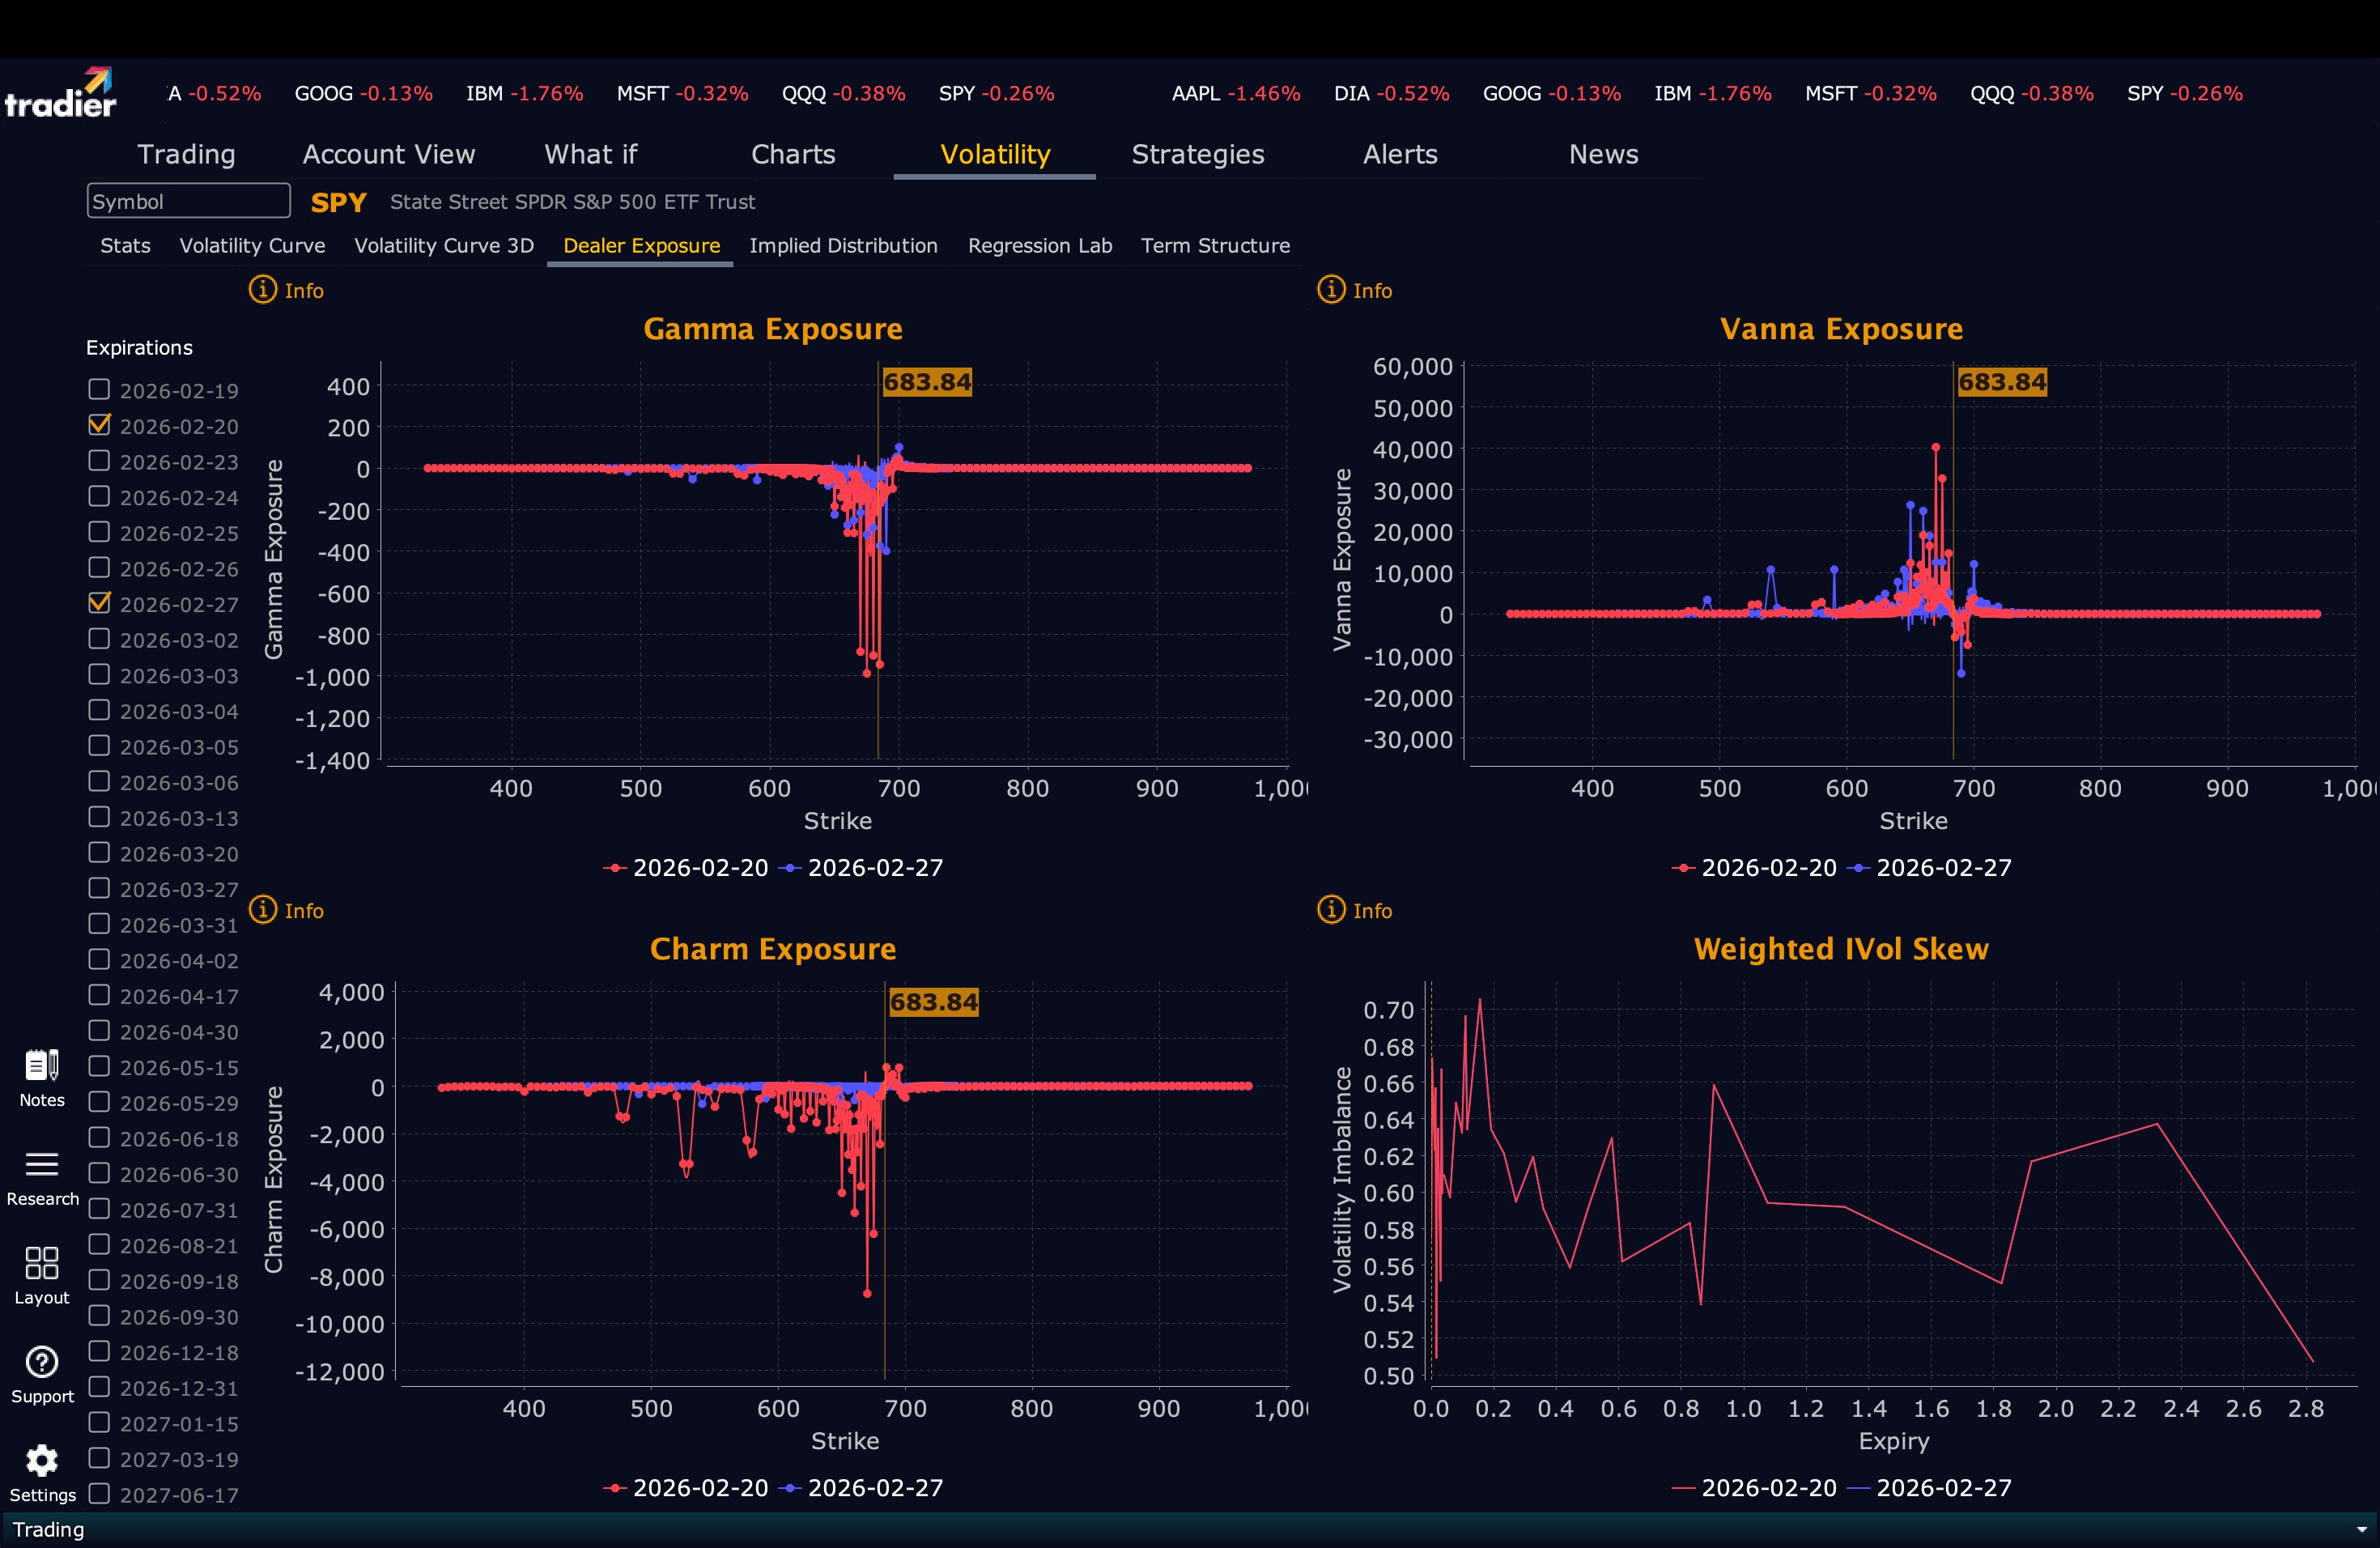
Dealers are selling SPY $692 to $715 and higher strike Calls while buying $685 to $691 Calls, indicating the Dealers' desire to participate in any rally into tomorrow. The ceiling for tomorrow appears to be $698. To the downside, Dealers are buying $684 to $565 and lower strike Puts in a 3:1 ratio to the Calls they're selling/buying displaying some concern that prices could move lower. Dealer positioning is unchanged from neutral/slightly bearish to neutral/slightly bearish.
Looking Ahead to Next Friday:
Dealers are selling SPY $688 to $715 and higher strike Calls while buying $685 to $687 Calls indicating the Dealers' desire to participate in any rally into Friday. The ceiling for the week appears to be $700. To the downside, Dealers are buying $684 to $565 and lower strike Puts in a 6:1 ratio to the Calls they're selling/buying, reflecting a market that is concerned about lower prices. For the week Dealer positioning is unchanged from bearish to bearish. We advise reviewing Dealer positioning daily for directional clues. These positions evolve quickly and tracking them is essential for staying ahead of shifting market sentiment.
Recommendation for Traders
SPY's close at $684.48 after testing the $686 resistance suggests consolidation around current levels. Favor structured dip buying near $682-683 support with stops below $681, while selling any failed attempts above $686. The narrow range and average volume indicate patient execution over aggressive positioning.
Keep position sizes manageable as we navigate this consolidation phase, and remember that our Treasury yield levels remain well below the danger zone at 4.070%. Check the premarket analysis posted before 9 AM ET for any changes in the model's outlook and Dealer Positioning.
Good luck and good trading!
