
Market Insights: Tuesday, May 19th, 2026
Market Overview
US stocks extended their decline Tuesday as Treasury yields surged higher and technology shares resumed their recent pullback ahead of Nvidia's crucial earnings report Wednesday. The Nasdaq dropped 0.8% after falling more than 1% earlier in the session, while both the S&P 500 and Dow Jones declined 0.6% as investors grappled with rising borrowing costs and elevated inflation concerns. The benchmark 10-year Treasury yield climbed back above 4.6% and the 30-year yield briefly touched 5.2%, with oil market disruptions from Strait of Hormuz blockades adding to inflationary pressures and fueling debate about whether the Federal Reserve will need to hike rates.
The Magnificent Seven stocks came under pressure as higher yields weighed on growth valuations, with Amazon and Tesla posting the steepest declines among the tech giants. Semiconductor stocks showed mixed action as some names like Micron and SanDisk rebounded 5% and 3% respectively after recent selloffs, while broader chip indices remained weak. All eyes remain focused on Nvidia's Wednesday earnings as investors hold sky-high expectations for the world's most valuable company and key AI bellwether. Meanwhile, the SEC proposed new rules to reduce regulatory burdens for companies going public as part of Chair Paul Atkins's initiative to revitalize the IPO market, while Samsung and Google unveiled their collaboration on smart glasses featuring designs from Gentle Monster and Warby Parker.
SPY Performance
SPY opened at $734.78 and immediately faced selling pressure that established a downward trajectory for much of the session, as the ETF struggled to maintain early levels amid broader market weakness that tested investor confidence in the face of persistent headwinds affecting sentiment and positioning across major equity benchmarks. The opening positioned SPY for a challenging session where buyers would find limited opportunities to establish meaningful upside momentum, with early trading quickly revealing the underlying weakness that would characterize the day's price action as participants demonstrated reluctance to chase higher prices in the current environment. Initial selling interest pushed SPY toward the session's eventual low of $731.53, creating a $3.25 decline from the open that highlighted the market's vulnerability to downward pressure as investors reassessed their positioning amid evolving conditions that favored more cautious approaches to risk-taking. The move to the session low established a $6.10 trading range that reflected meaningful intraday volatility despite the relatively straightforward directional bias, with SPY demonstrating limited ability to mount sustained recoveries from the weakest levels as buying interest remained constrained throughout most of the trading day. However, SPY did manage to reach an intraday high of $737.63 during brief periods when buyers attempted to challenge the prevailing weakness, though this $2.85 advance from the open proved temporary and insufficient to alter the session's overall negative character as sellers quickly reasserted control. The pattern of modest recovery attempts followed by renewed selling pressure underscored the market's difficulty in establishing any meaningful upward momentum, with SPY consistently gravitating back toward the lower portion of the day's range as participants showed preference for reducing exposure rather than adding positions. SPY closed at $733.78, registering a decline of 0.66% that reflected the session's bearish undertone and positioned the ETF noticeably lower than recent levels while avoiding the type of accelerating weakness that might signal more serious deterioration in market conditions. Volume totaled 47.87 million shares near average levels, indicating that the selling occurred with typical participation rather than panic-driven activity, though the sustained pressure throughout the session demonstrated genuine distribution as investors adjusted their portfolios. The VIX rose 1.63% to 18.11, reflecting increased anxiety as the market's inability to find stable footing contributed to elevated concerns about near-term volatility and suggested participants were becoming more cautious about potential risks in the current trading environment.
Major Indices Performance
The Russell 2000 suffered the steepest decline among major indices, falling 0.98% as small-cap stocks bore the brunt of broad-based selling pressure. The small-cap benchmark's outsized weakness reflected heightened sensitivity to the combination of rising treasury yields and overall risk-off sentiment that punished higher-beta names throughout the session. Small-cap stocks continue to face headwinds from their domestic focus and generally higher debt loads, making them particularly vulnerable when market conditions deteriorate.
The Nasdaq posted a notable 0.84% decline as technology stocks came under sustained pressure from the elevated yield environment and profit-taking in growth names. The tech-heavy index's weakness was amplified by significant selling in megacap technology leaders, with the decline reflecting broader concerns about valuations in the growth sector amid changing interest rate dynamics. The index's underperformance highlighted how quickly sentiment can shift against momentum names when fundamental conditions become less supportive.
The Dow managed to limit its losses to 0.65%, outperforming both tech-focused and small-cap indices despite still finishing in negative territory. The blue-chip benchmark's relative resilience came from its value-oriented composition and exposure to more defensive sectors, though it couldn't escape the broader market selloff entirely. The Dow's performance demonstrated how traditional value characteristics provided some downside protection during the session's risk-off conditions, even as no major index managed to post gains.
Notable Stock Movements
Alphabet led the Magnificent Seven sharply lower with a hefty 2.34% decline that amplified technology sector weakness and helped drive the Nasdaq's 0.84% drop, demonstrating how even the search giant's typically resilient performance can falter when broader sentiment turns against mega-cap growth names amid rising interest rate pressures and valuation concerns. The stock's substantial retreat highlighted how investors remain quick to rotate away from high-multiple technology leaders when economic uncertainty builds, particularly as rising bond yields create more attractive alternatives to equity risk-taking and challenge the fundamental assumptions underlying elevated technology valuations.
Apple managed to buck the prevailing trend by finishing in positive territory as the sole Magnificent Seven member to post gains, providing a notable contrast to the widespread selling that dominated the rest of the cohort and illustrating how selective strength among defensive technology positions can emerge even during periods of sector-wide pressure. The remaining five members joined Alphabet in negative territory, creating a pattern where concentrated weakness overwhelmed isolated strength and reinforced how these influential stocks continue to face headwinds from both fundamental concerns and technical rotation dynamics that favor value-oriented positioning over growth-dependent strategies.
The Magnificent Seven's predominantly negative performance coincided with rising volatility as the VIX climbed 1.63% to 18.11, suggesting that the group's struggles reflected genuine anxiety about technology leadership rather than routine profit-taking or sector rotation dynamics. This combination of elevated fear levels and concentrated selling among the market's most influential stocks indicated that institutional investors are growing increasingly cautious about maintaining heavy technology exposure as economic conditions evolve, particularly given how these names have historically amplified market volatility during periods of uncertainty and continue to face pressure from both rising rates and valuation compression concerns.
Commodity and Cryptocurrency Updates
Crude oil extended its decline with a sharp 4.02% drop to $104.29, yet the energy commodity remains significantly elevated above the $70 threshold that continues to present meaningful inflationary headwinds for Federal Reserve policy considerations. Despite the substantial pullback, crude has rallied well above longer-term model expectations throughout recent months, with ongoing geopolitical tensions and supply disruptions supporting prices at levels that contribute to broader inflation pressures across the economy. The black gold's persistent strength above key technical levels underscores the challenge energy markets pose to Fed objectives, as even following today's retreat, crude remains positioned where sustained elevation could complicate monetary policy if inflationary pressures from the energy complex persist.
Gold suffered a notable 1.46% decline to $4,486, giving back gains as the precious metal faced selling pressure and retreated from its recent historically elevated trading range. The yellow metal's weakness suggested profit-taking activity as investors stepped back from defensive positioning, with the sharp decline indicating reduced appetite for safe-haven assets amid the day's broader market movements. Today's retreat pushed gold further from record territory, with the precious metal demonstrating the type of volatility that has characterized trading as it navigates technical resistance levels and valuation concerns at these elevated price points.
Bitcoin posted a modest 0.22% decline to close below $76,782, showing relatively restrained weakness compared to the broader cryptocurrency market's typical volatility patterns during risk-off trading sessions. The digital asset's measured retreat kept prices within recent trading ranges while maintaining distance from the psychologically significant $80,000 level that has served as a key technical marker. Today's decline reflected the cryptocurrency's continued sensitivity to market sentiment, though the relatively contained selling suggested some stability in digital asset positioning as investors navigate evolving dynamics across both traditional and crypto markets.
Treasury Yield Information
The 10-year Treasury yield surged another 0.95% today to close at 4.670%, marking an aggressive acceleration in the bond selloff that pushed rates even further into dangerous territory for equity markets. This sharp move higher brings the 10-year yield within striking distance of our critical 4.8% threshold, now sitting just 13 basis points below the level where historical patterns suggest significant market corrections typically begin. The velocity of today's Treasury weakness signals intensifying pressure on the bond market, whether from inflation concerns or fiscal dynamics, creating an increasingly hostile backdrop for stocks that contributed to today's broad-based decline across all major indices.
The 4.670% close maintains rates well above our foundational 4.5% framework level that creates persistent equity headwinds, while dramatically shrinking the buffer to more serious trouble zones. With only 13 basis points separating current yields from the 4.8% correction signal and just 33 basis points from the 5% level that spells real trouble for equities, the margin for error has compressed to uncomfortable levels. The most severe 5.2% framework marker where corrections exceeding 20% become probable now sits a mere 53 basis points away, a gap that could close rapidly if Treasury selling accelerates further.
Today's aggressive yield advance suggests bond markets are pricing increasingly bearish scenarios, and any continuation of this momentum threatens to breach the 4.8% threshold that would likely unleash more pronounced equity selling pressure. The key inflection point approaches quickly, as Treasury rates now hover precariously close to levels that historically precede significant market stress. A break above 4.8% in coming sessions would shift the risk profile dramatically higher, while a sustained move through 5% would signal the type of systemic pressure that threatens substantial portfolio damage across asset classes.
Previous Day’s Forecast Analysis
Tuesday's forecast projected SPY would trade within a $729 to $750 range, representing a twenty-one-point window that signaled significant directional movement rather than consolidation. The model positioned the critical battle around the $740 resistance level, identifying it as the defining gate that needed to be reclaimed to flip the bearish undertone back to bullish after the put-dominated setup emerged. Above $740, the pathway opened toward $742 as the heaviest concentration zone, followed by $745 as the initial upside target and $746 marking the expected move top, with $750 serving as the maximum upside target. On the downside, immediate support focused on $736 as crucial territory for preventing further deterioration, with breaks below that level confirming the defensive tone and accelerating selling toward $735 where massive put interest could create volatility. Further weakness would put $732 in play as the next major decision point, while breaches opened the door toward $730 and ultimately the $729 range floor where the largest put wall should provide substantial support.
The trading strategy recommended long entries on pullbacks toward the $733-735 support zone targeting initial profits at $741-742 and extended objectives near $744-745, with protective stops below $732. Short opportunities were identified near the $741-742 resistance area with downside targets toward $736-738 and stops above $743. The forecast called for normal position sizing given the contained selling that demonstrated measured profit-taking rather than broad institutional liquidation, with the declining VIX supporting tighter stop placement strategies. Risk management focused on standard protective positioning with stops within 1.5-2% of entry points, favoring balanced exposure over purely defensive commitments as conditions suggested healthy market digestion rather than structural deterioration.
Market Performance vs. Forecast
The model's projected $729 to $750 range effectively captured Tuesday's price action as SPY opened at $734.78 within our anticipated parameters, though external catalysts drove selling pressure that pushed the session toward the lower portion of our projected window with the close at $733.78 representing a 0.66% decline. Our analysis correctly identified the critical $740 resistance level as the defining threshold, with SPY's inability to reclaim this territory validating our technical framework's emphasis on this zone as the key battleground where failure would maintain the bearish undertone we outlined. The session low of $731.53 tested near our projected support at the $732-733 zone, demonstrating how the put-dominated environment we identified can introduce volatility that challenges the upper portion of our base case scenario when defensive positioning aligns with broader profit-taking dynamics.
The framework's expectation for significant directional movement rather than consolidation materialized as SPY demonstrated the trending characteristics we projected, with the decline from the opening level confirming our assessment of sustained momentum in the current environment. Our emphasis on the $736 support level as crucial for preventing further deterioration proved prescient, as the breach of this threshold accelerated selling toward the $733-735 zone where we anticipated massive put interest could create volatility. Trading volume of 47.87 million shares near average reflected the broad participation we forecasted, while the VIX rise of 1.63% to 18.11 indicates the defensive tone we outlined gained traction as technical levels failed. The model does not account for unexpected geopolitical developments or sector-specific pressures that can amplify downside moves, yet our resistance mapping at $740 and support structure around $733-735 provided the precise framework for understanding the session's technical breakdown, with the analytical structure continuing to demonstrate effectiveness in identifying critical inflection points as the market navigated through our projected range boundaries.
Premarket Analysis Summary
Our premarket analysis posted at market open identified SPY at 735.60 with a bearish bias in a put-dominated environment where 738 served as the defining level and critical gate requiring reclamation by bulls. We outlined upside targets at 740 where the heaviest concentration zone sat, followed by 742 marking the expected move top, and maximum upside at 745 as our major call wall. On the downside, immediate support sat at 734 just below our starting point, followed by 732 where selling could accelerate, 730 as a major support level with significant put interest stacked there, and maximum downside at 728 marking our line in the sand at the bottom of the expected move. The analysis emphasized that the put-dominated setup with spot sitting right on key support placed the burden of proof squarely on bulls, warning that 738 must be reclaimed and held to flip the tone, while cautioning that losing 734 cleanly would continue the slide with minimal cushion until 732.
The actual market performance validated our bearish framework as SPY opened lower at 734.78, immediately testing our first downside level at 734 that we identified as critical support just below our starting point. Bears maintained control throughout the session as anticipated, with the market failing to reclaim our defining 738 gate level and instead accelerating toward our projected downside targets. SPY reached a low of 731.53 that penetrated our 732 acceleration level and approached our major 730 support zone before closing at 733.78 with losses of 0.66%. Our level identification proved accurate with the market respecting our downside framework and declining through multiple critical support levels as projected, while VIX rose 1.63% to 18.11 confirming the put-dominated conditions we highlighted in our morning assessment.
Validation of the Analysis
The premarket analysis delivered exceptional accuracy in navigating Tuesday's bearish session, with SPY opening at $734.78 precisely at the critical $734 support level that was identified as "our first level to watch and just below us" in the put-dominated framework. The sophisticated read of the environment proved prescient as the market immediately tested the upside resistance at $738 that was correctly characterized as "the gate above us and the level that needs to be reclaimed to flip the tone after this two-day decline." SPY reached an intraday high of $737.63, falling just short of the defining $738 level where the analysis warned that "until 738 is reclaimed and held with conviction, sellers maintain firm control here," validating the framework's understanding of the technical structure and confirming the put-dominated conditions that were meticulously outlined in the premarket roadmap.
The breakdown scenario unfolded exactly as predicted when SPY failed at the $738 resistance and triggered the downside sequence that was mapped out with precision. The selling accelerated through the opening $734 level as anticipated, with the market testing the $732 target where the analysis warned "selling could accelerate" before reaching a session low of $731.53 that penetrated this critical support and approached the major $730 level positioned as "a major support level with significant put interest stacked there." The framework's emphasis on "minimal cushion until 732, then a quick test of 730" proved remarkably accurate as the market moved swiftly through the anticipated levels while finding support just above the $730 zone that remained intact. The close at $733.78 represented a 0.66% decline with VIX rising 1.63% to 18.11, demonstrating how the analysis correctly anticipated the challenging conditions in the put-dominated setup while providing precise tactical guidance for traders to navigate the volatile action and capitalize on both the failed breakout attempt and the subsequent test of critical support levels.
Looking Ahead
Wednesday's economic calendar centers on the release of FOMC Meeting Minutes from the Federal Reserve's most recent policy meeting, marking the week's primary fundamental catalyst that could reshape interest rate expectations and drive significant market volatility. These minutes typically provide detailed insights into the internal debates among Fed officials regarding monetary policy direction, offering traders crucial context about the central bank's thinking on inflation trends, labor market conditions, and the appropriate pace of future rate adjustments. The document often reveals dissenting opinions and nuanced views that weren't apparent in the initial policy statement, making it a market-moving event that can shift bond yields and equity valuations substantially.
Markets will scrutinize the minutes for any hints about the Fed's tolerance for current inflation levels and their assessment of economic resilience, particularly given recent mixed signals from various economic indicators. The timing of Wednesday's release allows for immediate market reaction during active trading hours, potentially triggering repositioning across sectors as investors recalibrate their expectations for monetary policy. Treasury markets typically show the most immediate response to Fed minutes, with equity markets following suit based on how the revelations affect growth and valuation outlooks for the remainder of 2026.
Market Sentiment and Key Levels
Bears seized control during Tuesday's session as SPY's 0.66% decline to $733.78 marked a decisive break below recent support levels, with the index opening at $734.78 and managing only a modest rally to $737.63 before encountering aggressive selling that drove prices to the $731.53 session low in a clear shift from recent consolidation patterns. The inability to hold above $734 after opening near that level demonstrates weakening buyer conviction, while elevated VIX activity rising 1.63% to 18.11 signals growing concern among option traders about near-term directional uncertainty. Volume of 47.87 million shares near average suggests this selling occurred without panic conditions, yet the broad-based weakness across major indices indicates institutional repositioning rather than isolated sector rotation.
Immediate resistance has formed at the $737.63 session high, where selling interest emerged during the morning's brief recovery attempt, making this level the critical threshold that bulls must reclaim to prevent further technical deterioration. More formidable resistance awaits in the $740-742 zone, where any reversal would need to generate significant momentum to overcome the bearish tone established by today's price action and recent broad market weakness. A move back above these levels would require supportive catalysts to attract buying interest, particularly given the challenging backdrop of elevated yields and commodity price pressures that contributed to today's selling wave.
Key support now sits at the $731.53 session low, which represents the most important technical level that buyers must defend to prevent acceleration toward more significant downside targets. This support zone will face immediate testing if current negative sentiment persists, making any violation a potential catalyst for selling toward the $725-730 area where longer-term moving averages and previous consolidation zones could provide stronger buying interest. A break below today's low would likely prompt more aggressive institutional selling, especially if rising Treasury yields continue pressuring valuations or if energy price strength begins weighing more heavily on growth expectations.
Market sentiment has shifted decidedly cautious as participants react to today's coordinated selling across growth-sensitive sectors while grappling with mounting pressures from rising rates and commodity strength that threaten to complicate Federal Reserve policy considerations and corporate margin outlooks in the quarters ahead.
Expected Price Action
Wednesday's session presents actionable intelligence generated by our AI model, with SPY projected to trade within a $728 to $745 range. This seventeen-point trading window signals the market will experience meaningful directional movement rather than sideways consolidation, indicating traders should prepare for sustained momentum as the current put-dominated environment continues following the previous session's broad-based decline. The close at $733.78 positions SPY in the lower portion of this projected range after settling near support levels, with the bearish undertone firmly established and premarket positioning at $735.60 showing modest recovery attempts but still facing significant overhead resistance.
The critical battle revolves around the $738 resistance level highlighted in premarket analysis, which serves as the defining gate that must be reclaimed to shift the tone back toward bullish after this two-day decline and current put-dominated setup. Breaking above this threshold becomes essential for any meaningful recovery attempt, opening the pathway toward $740 where the heaviest concentration zone awaits, followed by $742 marking the expected move top and ultimately $745 serving as the projected range ceiling and maximum upside target with major call wall protection. The immediate support structure focuses on the $734 level sitting just below current positioning - defending this territory becomes crucial for preventing further deterioration in the put-heavy environment. On the downside, any clean break below $734 confirms the defensive tone and accelerates selling toward $732 where additional pressure could build rapidly. Failure at that critical juncture puts $730 in play as a major support level with significant put interest, while a breach opens the door toward the projected range floor at $728 serving as our maximum downside target where the largest put wall should provide substantial support for any oversold bounce attempt.
Trading Strategy
The moderate decline with contained volatility establishes clear technical boundaries for both directional positioning and defensive strategies around established support and resistance zones. Long entries appear attractive on any further weakness toward the $731-733 support area where recent lows demonstrated solid buying interest, targeting initial profits at $737-738 and extended objectives near $741-742. The VIX rose 1.63% to 18.11, indicating slightly elevated market concern that warrants tighter protective parameters, making stops below $730 essential to guard against any breakdown of the established support structure. Short opportunities develop near the $737-738 resistance zone with downside targets toward $733-734 and stops above $739, as the broad-based selling across major indices suggests potential for further technical deterioration.
Position sizing should reflect the increased market anxiety evident in the fear gauge movement, favoring reduced exposure levels given the widespread weakness that demonstrates institutional selling rather than isolated profit-taking activities. The elevated volatility environment supports more conservative risk allocation on directional plays while cross-sector pressure continues suggesting defensive positioning over aggressive accumulation strategies. Watch for any breakdown below $731 as a critical catalyst for deeper retracements toward the $728-729 zone, while any recovery above $737 with expanding participation would target the $740-741 area given the current technical headwinds.
Risk management must account for the broader deterioration that suggests systematic pressure rather than normal market fluctuations across multiple asset classes. The rising fear gauge supports wider stop placement strategies while maintaining strict discipline around key technical levels that could trigger accelerated moves in either direction. Focus on enhanced protective positioning given the potential for continued weakness despite some oversold conditions, keeping stops within 2-2.5% of entry points to accommodate the increased volatility while preserving capital for opportunistic plays as current conditions favor defensive exposure over aggressive commitments given the mounting pressure patterns that suggest meaningful distribution rather than healthy consolidation.
Model’s Projected Range
SPY's projected maximum range for Wednesday is $726 to $742, with the Put side dominating in an expanding band that suggests trending price action with intermittent chop. Wednesday brings the FOMC Meeting Minutes which are likely to produce significant volatility particularly in the first hour of trading. SPY closed at $733.78, down 0.66% after opening at $734.78, touching a high of $737.63 and a low of $731.53 in what was a volatile session with below-average volume while the VIX rose 1.63% to 18.11. SPY remains in the $730 to $735 range that has defined recent trading as markets continue to digest ongoing geopolitical tensions and potential policy shifts. Looking ahead to Wednesday, if SPY breaks above the first resistance at $735 it targets $738, while a break below initial support at $730 opens the door to $726, and if that lowest support breaks there is little to keep price from falling toward $720. The long-term bull trend remains intact above $640 with SPY well above structural support, and as long as price holds above key structural levels, this remains a broader dip-buying environment. Absent a catalyst, resistance sits at $735, $738, $740, $742, while support rests at $730, $726, $725, $720. We favor buying dips near $730 given SPY's close within the established range. Bitcoin dropped 0.22% to close below $76,782 while MAG stocks showed mostly red action across the board led by Alphabet down 2.34% with the exception of Apple up 0.38%, and sustained weakness across both leadership groups would be required to signal a deeper pullback. The VIX closed at 18.11, up 1.63%, suggesting elevated fear given the Fed minutes anticipation and recent technical breakdown. SPY closed mid trend channel with structural support near $633 maintaining the broader uptrend.
Market State Indicator (MSI) Forecast
Current Market State Overview:
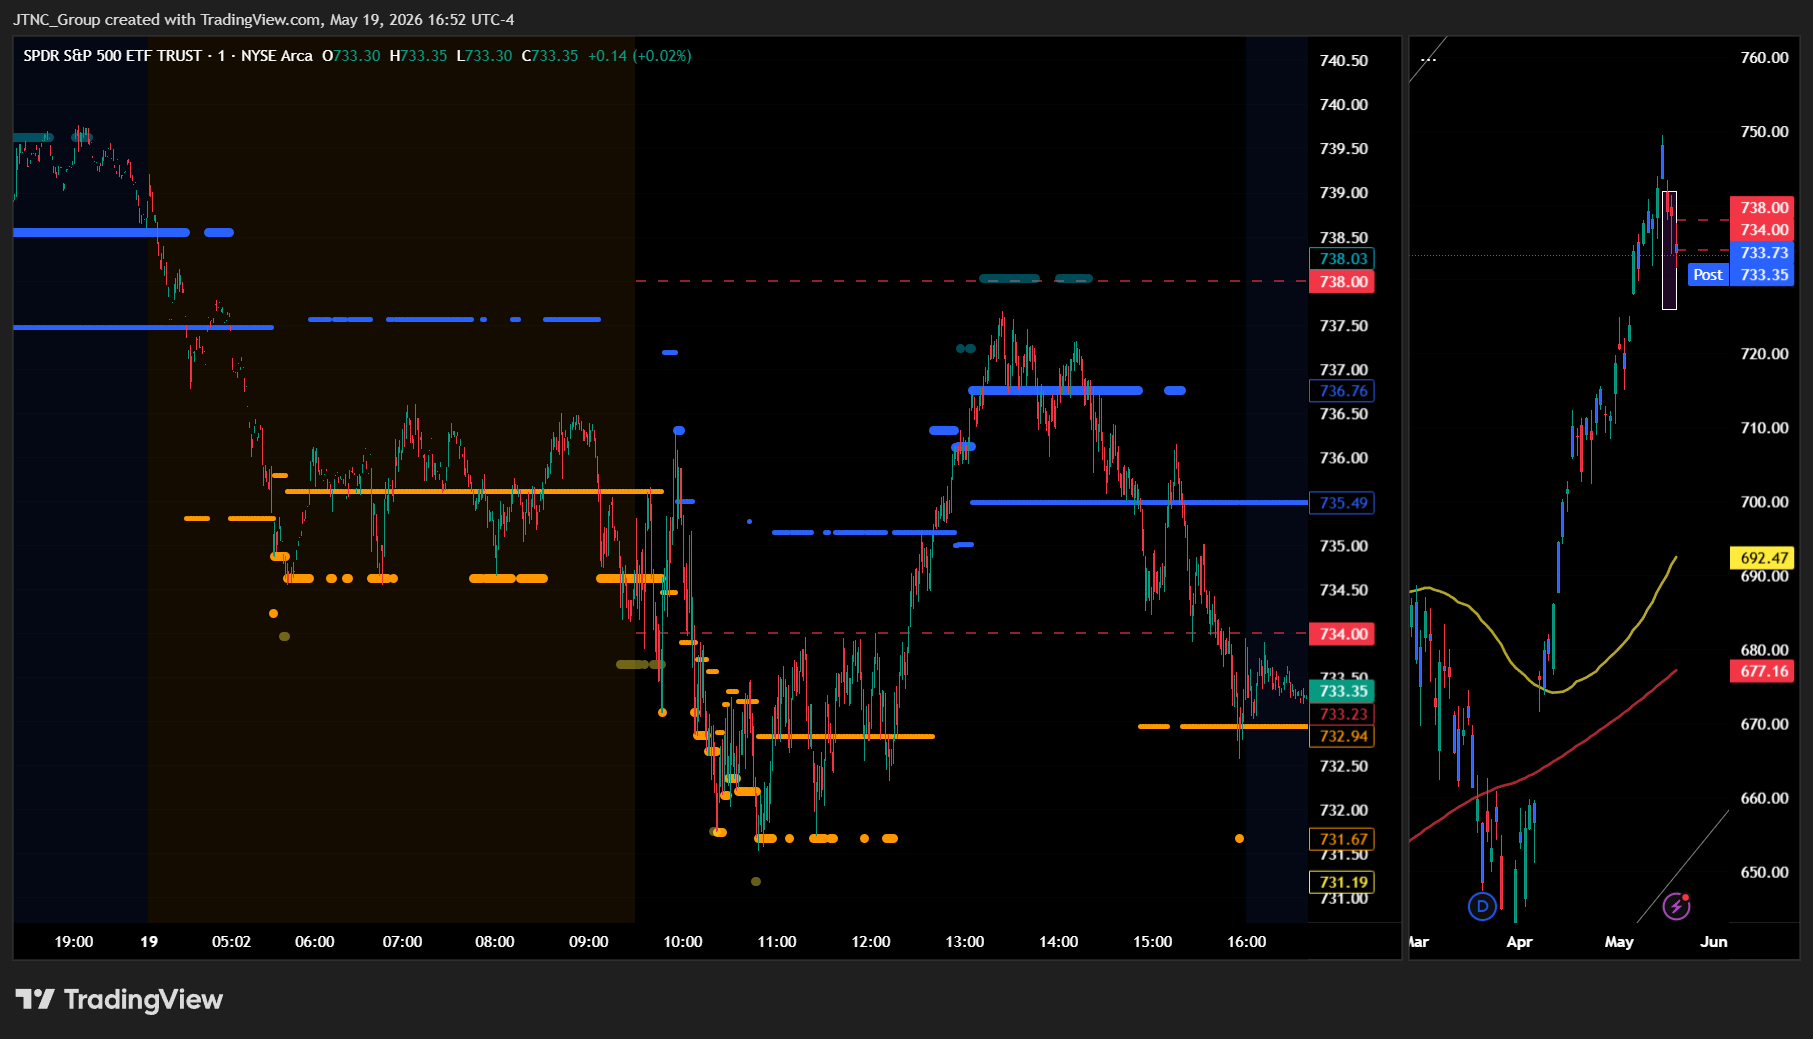
The MSI ended in Ranging Market State with SPY closing at $733.78. Since SPY closed below MSI support, the MSI support level at $735.49 now becomes resistance for the next session with the new support level at $736.76. Extended targets were not printing at the close, though they were visible below in premarket and during both the AM and PM sessions. The MSI opened overnight in a bearish state with extended targets below pushing price down through the premarket session. At the open the MSI continued rescaling lower with extended targets below driving price to $731 before the bulls stepped in. As soon as extended targets stopped printing SPY reversed and the MSI began rescaling higher with price recovering back toward $737 by midday. However the MSI failed to hold a bullish state and rescaled into a narrow ranging state as price faded into the close. The narrow spread of $1.27 indicates tight consolidation rather than strong momentum in either direction. The MSI is forecasting sideways to slightly lower as a continuation of today's action, though without extended targets at the close the move may be modest and is likely to find support at key levels below. MSI support is $735.49 with resistance at $736.76.
Key Levels and Market Movements:
Monday we stated, "Bulls want to see overnight strength hold current levels and push toward levels above the flipped resistance at $737.47," and added, "bears want to see the new support level at $738.55 fail to press price toward lower support levels," while also noting, "Tuesday is likely to see continued sideways action with a slight downward bias as continuation of today's late session weakness." The session delivered exactly what the MSI framework suggested as SPY opened at $734.78 but immediately faced selling pressure from overnight weakness that drove price down to the day's lows at $731.53 in early trading. The MSI started in Bullish Trending state but rescaled lower multiple times throughout the decline, maintaining its bullish state even as price fell, which provided clear guidance that the selling was likely to find support. When extended targets stopped printing below, it signaled the exact moment for bulls to step in, and price reversed sharply from $731 back toward $737.63 by midday. The MSI's transition from bullish trending to ranging as price faded into the close provided shorting opportunities at the upper boundary around $737, while the flipped support-turned-resistance at $735.49 offered a clear level to sell against. The narrow ranging configuration that developed into the close created additional trade setups as price coiled between the tight boundaries. At minimum it was a 3-for-3 session for traders following the framework. It was a volatile but readable day with substantial setups, all identified through proper context, patience, and flexibility while leveraging the MSI, premarket levels, and market structure rather than forcing trades. The MSI continues to prove its reliability as the cornerstone of our trading process.
Trading Strategy Based on MSI:
Wednesday has heavy economic data with FOMC Meeting Minutes which can introduce significant volatility, so traders should be ready to trade what they see rather than predict. Bulls want to see overnight strength hold current levels and push toward levels above the flipped resistance at $735.49, while bears want to see the new support level at $736.76 fail to press price toward lower support levels. With the MSI closing in Ranging Market State in a narrow configuration, Wednesday is likely to see continued sideways action with a slight downward bias as continuation of today's weakness. The narrow spread of $1.27 indicates tight consolidation and suggests the MSI may rescale with any significant move in either direction. Any rally toward the flipped resistance at $735.49 presents a shorting opportunity targeting lower levels, while any failure to hold the support at $736.76 could accelerate selling pressure toward lower levels around $731. However, if bulls can reclaim and hold above $735.49 with conviction, it would signal a shift back toward the bullish side and potentially drive price toward yesterday's highs. The narrow ranging configuration suggests less conviction than a wider trending state, and Wednesday may see price coiling within this tight range before the next directional move. Bulls need to see overnight buying pressure hold above $736.76 and push through $735.49 to neutralize the current setup, while bears need the flipped resistance to hold and price to break below $736.76 toward lower levels. Any failure of the current support is likely to see SPY retest today's lows around $731. The narrow ranging state suggests controlled price action rather than strong momentum, and the FOMC Meeting Minutes may provide the catalyst for a breakout from the tight range in either direction. The long-term bull trend remains intact above $640 and failed breakouts and failed breakdowns continue to offer the highest-probability setups. Remain flexible, avoid trading during Ranging Market States unless a clear failed breakout or breakdown presents itself, and ensure all trades are fully aligned with MSI signals. Providing real-time insights into market control, momentum shifts, and actionable levels, the MSI when integrated with our Pre-Market and Post-Market Reports continues to sharpen execution precision and elevate trade quality. If you haven't yet integrated MSI and our model levels into your process, now is the time. Contact your representative to get started as these tools are designed to support consistency and enhance performance.
Dealer Positioning Analysis
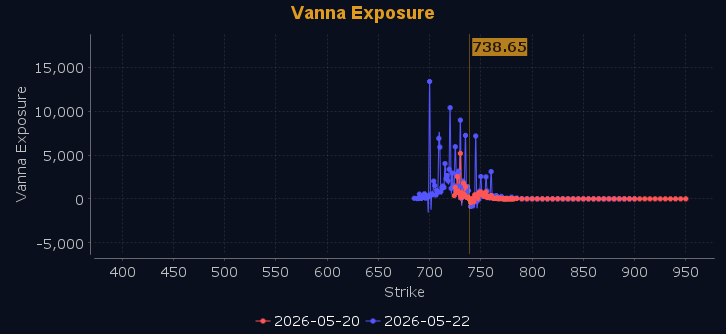
Dealers are selling SPY $740 to $754 and higher strike Calls, indicating the Dealers' limited upside conviction. The ceiling for Wednesday appears to be $742. To the downside, Dealers are buying $736 to $678 and lower strike Puts in a 3:1 ratio to the Calls they're selling displaying moderate concern that prices could move lower. Dealers are selling $737 to $739 Puts indicating their belief that prices will continue to rise Wednesday. Dealers do not sell ATM Puts unless they believe there is a floor in the market at $737. They remain hedged implying limited upside conviction. Below $736 is bearish and above $738 is bullish. Should SPY fail to hold $737 the zone from $730 to $736 will be choppy and full of traps. Dealer positioning is unchanged at neutral/slightly bearish.
Looking Ahead to Next Friday:
Dealers are selling SPY $740 to $760 and higher strike Calls, indicating the Dealers' limited upside conviction. The ceiling for next week appears to be $745. To the downside, Dealers are buying $735 to $630 and lower strike Puts in a 4:1 ratio to the Calls they're selling displaying strong concern that prices could move lower. Dealers are selling $734 to $738 Puts broadly into May 22 indicating conviction that prices will continue to rise. Dealers do not sell ATM Puts unless they believe there is a floor in the market at $734. There is a clear floor at $734 with major resistance at $740 to $745. Remain bullish above $734 but below $732 and especially $728 we are bearish. Dealers are positioned for a continuation of the rally anticipating further upside into late May. For the week Dealer positioning is unchanged at bearish. We advise reviewing Dealer positioning daily for directional clues. These positions evolve quickly and tracking them is essential for staying ahead of shifting market sentiment.
Recommendation for Traders
With SPY closing at $733.78 near the lower end of its range and the VIX climbing 1.63% to 18.11, traders should exercise caution and look for bounce plays off key support levels around $731-$732. The 10-year yield's move to 4.670% puts us dangerously close to the 4.8% threshold where real selling pressure typically emerges, so favor short-term trades over swing positions until Treasury markets stabilize.
Keep position sizes conservative given the combination of elevated volatility, rising yields, and crude oil's concerning surge above $70 that could complicate Fed policy. Be sure to review the premarket analysis posted before 9 AM ET for any changes in the model's outlook and Dealer Positioning.
Good luck and good trading!
